ZSF1 rat as animal model for HFpEF: Development of reduced diastolic function and skeletal muscle dysfunction
Abstract
Aims
The prevalence of heart failure with preserved ejection fraction (HFpEF) is still increasing, and so far, no pharmaceutical treatment has proven to be effective. A key obstacle for testing new pharmaceutical substances is the availability of suitable animal models for HFpEF, which realistically reflect the clinical picture. The aim of the present study was to characterize the development of HFpEF and skeletal muscle (SM) dysfunction in ZSF1 rats over time.
Methods and results
Echocardiography and functional analyses of the SM were performed in 6-, 10-, 15-, 20-, and 32-week-old ZSF1-lean and ZSF1-obese. Furthermore, myocardial and SM tissue was collected for molecular and histological analyses. HFpEF markers were evident as early as 10 weeks of age. Diastolic dysfunction, confirmed by a significant increase in E/e′, was detectable at 10 weeks. Increased left ventricular mRNA expression of collagen and BNP was detected in ZSF1-obese animals as early as 15 and 20 weeks, respectively. The loss of muscle force was measurable in the extensor digitorum longus starting at 15 weeks, whereas the soleus muscle function was impaired at Week 32. In addition, at Week 20, markers for aortic valve sclerosis were increased.
Conclusions
Our measurements confirmed the appearance of HFpEF in ZSF1-obese rats as early as 10 weeks of age, most likely as a result of the pre-existing co-morbidities. In addition, SM function was reduced after the manifestation of HFpEF. In conclusion, the ZSF1 rat may serve as a suitable animal model to study pharmaceutical strategies for the treatment of HFpEF.
Introduction
Heart failure (HF) is a global burden affecting ~26 million people worldwide resulting in >1 million patients being hospitalized every year in the USA and Europe.1 Approximately 50% of all HF patients present with a preserved left ventricular ejection fraction (LVEF) (HFpEF; LVEF > 50%), and the prevalence is still increasing owing to an aging population and an increase in other risk factors such as diabetes mellitus, arterial hypertension, and sedentary lifestyle.2 While HF with reduced ejection fraction (HFrEF; LVEF lower than 40%) is often the result of a direct insult, for example, myocardial infarction or volume overload leading to an impaired contractility of the left ventricle (LV), HFpEF is triggered by a variety of metabolic risk factors, like obesity, diabetes mellitus type II, and hypertension.
Subsequently, HFpEF patients develop structural and cellular myocardial changes reaching from hypertrophy to inflammation and fibrosis, all leading to an impaired relaxation ability of the left ventricle. Clinical trials investigating the efficacy of classical HF medications have failed so far in improving prognosis and mortality.3-6 Therefore, the search for new therapeutic strategies is urgently warranted. A key obstacle for testing new pharmaceutical substances is the availability of suitable animal models. In the current literature, a variety of animal models are described as developing signs of HFpEF ranging from murine models (for review, see Valero-Munoz et al.7) to a pig model.8 Most of these animal models develop HFpEF triggered by a single factor like hypertension (Dahl salt-sensitive rat (DSS rat),9, 10 aldosterone-infused uninephrectomized mouse,11 and transverse aortic constriction-induced pressure overload in mouse12), obesity/diabetes (db/db mouse13, 14), and aging (senescence-accelerated mouse15).
As patients with HFpEF mostly harbour several co-morbidities like hypertension, obesity/metabolic dysfunction, and advanced age,2 Schiattarella and colleagues recently formulated a ‘two-hit’ hypothesis, inducing HFpEF in mice by metabolic stress (feeding of a high fat diet) and mechanical stress (hypertension induced by blocking eNOS activity) as second stressor.16 However, another animal model, developing HFpEF owing to diabetes and hypertension, is the ZSF1 (Zucker fatty and spontaneously hypertensive) rat. This model was developed by crossing rat strains with two separate leptin receptor mutations (fa and facp), the lean female ZDF rat (+/fa) and the lean male SHHF rat (+/facp). Offspring being homozygous for both mutations (fa:facp) are obese and develop insulin resistance, hyperglycaemia, and mild hypertension (ZSF1-obese). The heterozygous offspring (ZSF1-lean) are lean and exhibit no signs of obesity and diabetes. As previous studies have shown, the ZSF1-obese animals developed signs of HFpEF [elevated E/e′, elevated left ventricular end-diastolic pressure (LVEDP), and preserved LVEF] at age of 20 weeks.17-20 In addition, these animals show exercise intolerance,20, 21 reduced skeletal muscle contractility,21 and impaired endothelial function.22
At the moment, it is uncertain at what age the animals start to develop signs of HFpEF and skeletal muscle dysfunction. Furthermore, it is unknown if these alterations of skeletal muscle function occur in parallel to or as a consequence of the development of HFpEF.
Regarding the co-morbidities triggering HFpEF like obesity, diabetes mellitus, hypertension, and hyperlipidaemia, it is well accepted that they are also associated with an increased risk to develop atherosclerosis/endothelial dysfunction and aortic stenosis (AS).23, 24 The development of endothelial dysfunction in HFpEF is well accepted,25, 26 and recently, our group reported endothelial dysfunction also in ZSF1-obese rats.22 With respect to the association between HFpEF and AS, not much is known so far. It is established that hypertension is commonly encountered in patients with AS and may contribute to remodelling and dysfunction of the left ventricle.27 There is evidence that arterial hypertension may hasten progression of AS28 and may increase aortic valve calcification29, 30 leading to HFpEF.
Therefore, the aim of the present study was to characterize the development of HFpEF and skeletal muscle dysfunction in ZSF1-obese animals in comparison with ZSF1-lean over time. In addition, the presence and development of AS in ZSF1-obese animals were investigated.
Methods
Animals and study design
ZSF1-lean and ZSF1-obese animals were purchased from Charles River at age of 5 weeks. At different ages, 6-, 10-, 15- (five ZSF1-lean and five ZSF1 obese animals at each time point) 20-, and 32-week (10 ZSF1-lean and 10 ZSF1-obese animals of each age group) animals were randomly selected; and functional measurements on the myocardium (echocardiography and invasive haemodynamic measurements) were performed. At the end of the invasive haemodynamic measurement, the animals were sacrificed, and the extensor digitorum longus (EDL) and the soleus muscle were prepared for functional analyses. In addition, organ weights of heart and lung were determined, and skeletal muscle as well as heart tissue was snap frozen in liquid nitrogen.
All experiments and procedures were approved by the local animal research council, TU Dresden and the Landesbehörde Sachsen (TVV 42/2018).
Echocardiography
Rats were anaesthetized by isoflurane (1.5–2%), and transthoracic echocardiography was performed using a Vevo 3100 system and a 21 MHz transducer (Visual Sonic, Fujifilm) to assess cardiac function as previously described.10
For systolic function, B-mode and M-mode of parasternal long and short axes were measured at the level of the papillary muscles. Diastolic function was assessed in the apical four-chamber view using pulse wave Doppler [for measurement of early (E) and atrial (A) waves of the mitral valve velocity] and tissue Doppler [for measurement of myocardial velocity (E′ and A′)] at the level of the basal septal segment in the septal wall of the left ventricle.
Functional parameters (i.e. LVEF and stroke volume) and ratios of E/e′ and E/A were obtained using the Vevo LAB 2.1.0 software.
Assessment of aortic flow velocity and aortic opening area
In the suprasternal view, pulsed-wave Doppler imaging at 16 MHz was used to record velocity time integrals (VTIs) from the aorta and left ventricular outflow tract (LVOT) to determine aortic valve peak velocity (AV Peak Vel.) and calculate aortic valve peak pressure gradient [4 × (AV Peak Vel./1000)2]. B-mode images (21 MHz, suprasternal view) were assessed to determine midsystolic LVOT diameter. Aortic valve opening area was calculated by the continuity equation method using the LVOT and peak aortic jet velocity: [(LVOT/2)2 × π × LVOT VTI Peak Vel.]/AV Peak Vel. The average of three consecutive cardiac cycles was used for each measurement.
Invasive haemodynamic measurements
Invasive haemodynamic pressure measurements were performed as the terminal procedure. In anaesthetized (ketamine and xylazine) but spontaneous breathing rats, the right carotid artery was cannulated with a Rat PV catheter (SPR-838, ADInstruments Limited), which was gently placed in the middle of the left ventricle. The LV end-diastolic and end-systolic pressures, maximum rate of pressure rise (dP/dtmax), maximum rate of pressure fall (dP/dtmin), and time constant (τ) for LV relaxation, after which withdrawal of the catheter into the aorta, and phasic and mean arterial pressures (MAPs) were measured. MAP was measured in the ascending aorta. Data were recorded in LabChart8 software (ADInstruments).
Skeletal muscle function
The right EDL and the left soleus were dissected and mounted vertically in a Krebs–Henseleit buffer-filled organ bath between a hook and force transducer, with the output continuously recorded and digitized (1205A: Isolated Muscle System—Rat, Aurora Scientific Inc., Ontario, Canada). In vitro muscle function was assessed by platinum electrodes stimulating the muscle with a supra-maximal current (700 mA, 500 ms train duration, 0.25 ms pulse width) from a high-power bipolar stimulator (701C; Aurora Scientific Inc., Ontario, Canada). The muscle bundle was set at an optimal length (Lo) equivalent to the maximal twitch force produced, after which bath temperature was increased to 25°C and a 15 min thermos equilibration period followed. A force-frequency protocol was then performed at 1, 15, 30, 50, 80, 120, and 150 Hz, separated by 1 min rest intervals.
RNA isolation and quantitative real-time PCR
Total RNA was isolated from LV tissue using Qiazol reagent and miRNeasy Mini Kit (Qiagen, Germany) following the standard protocols. cDNA was synthesized with the Revert AID™ H Minus First Strand Synthesis Kit (Thermo Scientific, Germany) using oligo-dT primers. Real-time PCR was performed using the CFX384TM Real Time PCR System (BioRad, USA) and Maxima SYBR Green qPCR Kit (Thermo Scientific, Germany). PCR program for all primer sets (Table 1) was as follows: 95°C for 8 min prior to 40 amplification cycles, each consisting of 95°C for 10 s, 58°C for 15 s, and 72°C for 30 s with a final extension step at 72°C for 2 min. Melting point analysis was done to prove the identity of the PCR products. Relative quantification of gene expression was calculated by ∆∆CT method with Polr2a and Rpl-32 as housekeeping genes using BioRad CFX Manager software (BioRad, USA). The expression of specific genes was normalized to its expression in ZSF1-lean animals.
| Gene | Primer 1 | Primer 2 | Gene bank ID |
|---|---|---|---|
| BNP | ACAATCCACGATGCAGAAGC | GAAGGCGCTGTCTTGAGACC | NM_031545 |
| Col1A1 | CTGCACGAGTCACACCGGAA | CCAATGTCCAAGGGAGCCAC | NM_053304 |
| Col1A2 | GTGGCAGCCAGTTTGAATAC | TGTTCTGAGAAGCACGGTTG | NM_053356 |
| Col3A1 | TGGCTGCACTAAACACACTG | CCAATGTCATAGGGTGCGAT | NM_032085 |
| Rpl-32 | GGTGAAGCCCAAGATCGTCAA | TCTGGGTTTCCGCCAGTTTC | NM_013226.2 |
| Polr2a | GGTATTGAGCAGATCAGCAAGG | CAATGCCCAGTACCGTGAAG | XM_343922 |
Statistical analyses
Data are presented as mean ± SEM. One-way analysis of variance (ANOVA) followed by Bonferroni post hoc was used to compare groups, while two-way repeated measures ANOVA followed by Bonferroni post hoc was used to assess contractile function. Holm–Šídák multiple t-test was used to assess valvular function (GraphPad Prism). Significance was accepted as P < 0.05.
Results
Animal characteristics and organ weights
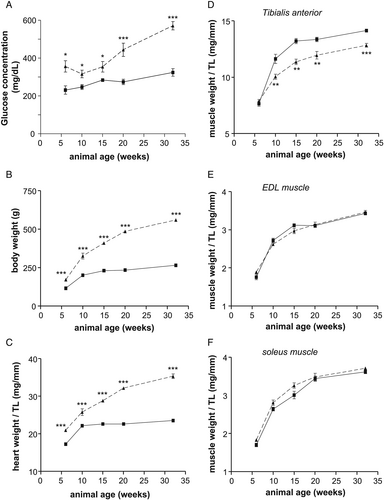
By analysing non-fasting blood glucose concentration, as sign for the presence of diabetes, a significant elevated concentration was already detected at age of 6 weeks. This significant elevation in blood glucose concentration in obese animals was observed in all age groups (Figure 1). With respect to body weight (Figure 1) and heart weight normalized to tibia length (Figure 1), a highly significant difference between the lean and obese animals was detected in all age groups. Signs of muscle atrophy, as deduced from muscle wet weight normalized to tibia length, were seen in the tibialis anterior (TA) muscle (Figure 1) but not in the EDL (Figure 1) and soleus muscle (Figure 1F). Tibia length was not different between the groups (data not shown).
Development of heart failure with preserved ejection fraction—myocardial parameter
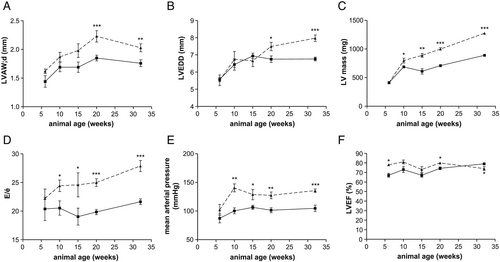
The development of HFpEF in the animals was assessed by quantification of specific parameters like E/e′, LVEF, thickness of the LV anterior wall (LVAW;d), LV end-diastolic diameter (LVEDD), LV mass, and MAP by echocardiography and invasive haemodynamic measurements. As shown in Figure 2, a significant increase in LVAW;d (Figure 2), LVEDD (Figure 2), LV mass (Figure 2), E/e′ (Figure 2), and MAP (Figure 2) was detected in ZSF1-obese when compared with their lean counterparts. LVEF was normal (above 60%) in all animals (Figure 2). Differences in LVAW;d and LVEDD were significantly increased starting at 20 weeks of age, whereas significant differences in LV mass, E/e′, and MAP were detected earlier at 10 weeks of age. In addition, LVEDP was significantly elevated by 23% in 20-week-old ZSF1-obese animals (lean: 17.45 ± 1.08 vs. obese: 21.57 ± 1.24 mmHg; P < 0.05) and 43% in 32-week-old ZSF1-obese animals (lean: 15.26 ± 0.86 vs. obese: 21.81 ± 1.47 mmHg; P < 0.05). No significant difference in LVEDP was seen in 6-, 10-, and 15-week-old animals (data not shown).
Skeletal muscle dysfunction
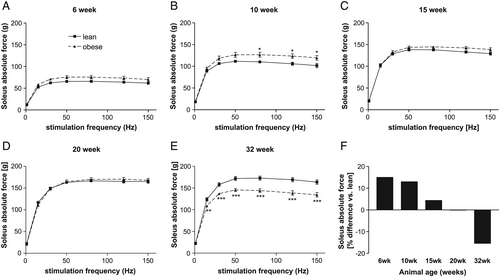
By analysing soleus muscle force development in the different age groups, a higher but not significant absolute force was seen in the ZSF1-obese animals at age of 6 weeks, reaching significance at 10 weeks of age (Figure 3). This difference was no longer detected in animals at age of 15 weeks (Figure 3). In 32-week-old animals, a clear significant drop in absolute muscle force was obvious in the ZSF1-obese animals when compared with the lean counterparts (Figure 3). Comparing the development of maximal absolute force in the ZSF1-obese with that of the ZSF1-lean animals over time, a 15% higher absolute force was present in the 6-week-old ZSF1-obese animals whereas a 15% lower maximal absolute force was seen in 32-week-old ZSF1-obese rats (Figure 3).
With respect to the development of specific muscle force (Figure 4), a higher force was seen in ZSF1-obese animals at age of 15 weeks (Figure 4). This changed completely in 32-week-old animals where a significant lower specific force was detected in ZSF1-obese animals (Figure 4). By analysing the maximal specific force of the soleus muscle, a 9% loss was obvious in obese animals when compared with the lean counterparts (Figure 4).
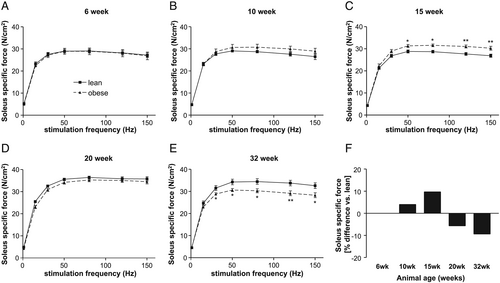
In the EDL muscle, absolute (Figure S1) and specific force (Figure S2) was significantly reduced in ZSF1-obese animals starting at age of 15 weeks.
Aortic valve sclerosis
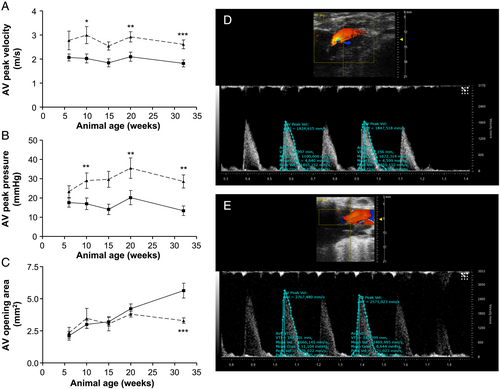
AV peak velocity (Figure 5) is significantly increased in 10-week-old obese ZSF1 animals compared with age-matched lean controls (2.99 ± 0.35 vs. 2.03 ± 0.19 m/s, P ≤ 0.01). This effect proceeds at age of 20 and 32 weeks (20 weeks, 2.92 ± 0.21 vs. 2.10 ± 0.19 m/s, P ≤ 0.01; 32 weeks, 2.61 ± 0.18 vs. 1.82 ± 0.14 m/s, P ≤ 0.001, obese vs. lean). In addition, AV peak pressure gradient (Figure 5) is increased in 10-week-old ZSF1-obese rats (37.9 ± 9.4 vs. 17.0 ± 3.0 mmHg, P ≤ 0.01). These effects propagate in 20- and 32-week-old ZSF1 rats (20 weeks, 35.5 ± 5.3 vs. 20.2 ± 3.7 mmHg, P ≤ 0.01; 32 weeks, 28.6 ± 3.4 vs. 13.4 ± 2.5 mmHg, P ≤ 0.01, obese vs. lean). At the age of 32 weeks, AV opening area (Figure 5) is significantly decreased in obese vs. lean ZSF1 animals (3.3 ± 0.8 vs. 5.7 ± 2.0 mm2, P ≤ 0.001).
Expression of BNP and collagen
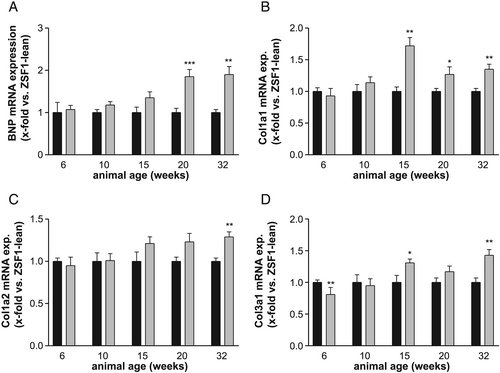
BNP mRNA expression in the left ventricle continuously increased in ZSF1-obese animals, reaching statistical significance at age of 20 weeks (Figure 6). By analysing different collagen mRNA expression in the LV of ZSF1-lean and obese animals, a significant elevated expression for collagen 1A1 was detected starting in 15-week-old animals (Figure 6). With respect to collagen 1A2 (Figure 6) and collagen 3A1 (Figure 6), a significant higher expression was seen in 32- or 15-week-old ZSF1 obese animals, respectively.
Discussion
- The animals develop signs of HFpEF, as deduced from echocardiographic and invasive measurements, at age of 10 to 15 weeks. This is accompanied with hypertension, hyperlipidaemia, obesity, and diabetes, which are already seen at age of 6 weeks. A continuous increase in myocardial BNP expression reaches statistical significance at age of 20 weeks.
- The ZSF1-obese animals develop muscle atrophy and muscle dysfunction at ~20 weeks of age. Muscle dysfunction is detected first in the EDL muscle followed by the soleus.
- The ZSF1-obese animals also develop aortic valve sclerosis probably owing to the co-morbidities known to drive the development of AV stenosis.
Taken together, the ZSF1 rat model seems to be a very good animal model of HFpEF developing HFpEF at ~15 weeks of age and subsequently occurring myocardial and skeletal muscle dysfunction. Therefore, this animal model may be suitable to test new pharmaceutical treatment strategies to fight HFpEF.
Development of heart failure with preserved ejection fraction in ZSF1-obese animals
Echocardiography and invasive haemodynamic measurements are ideal methods to test for myocardial alterations occurring in HFpEF. A recently published consensus recommendation from the European Heart Failure Association31 concludes that no single non-invasive criterion for diagnosing HFpEF is available. Therefore, a combination of echocardiographic measurements (cardiac structure and function) and measurements of natriuretic peptides is recommended. In addition, signs of HFpEF, like exercise intolerance, should be present. Following these recommendations, the question is whether the ZSF1-obese rat develops HFpEF and at what age. Echocardiographic analyses in our study clearly showed that LVEF is preserved over the whole observation period of 32 weeks and that a significant increase in E/e′ was evident starting at 10 weeks of age. Measurements of cardiac structure like LV mass, LVAW;d, and LVEDD were also significantly elevated at the age of 10 weeks. In addition, left ventricular BNP expression was significantly enhanced at 20 weeks, and mean arterial blood pressure was slightly elevated at 10 weeks. With respect to exercise intolerance, earlier studies in ZSF1 animals confirmed reduced peak oxygen uptake at 20 weeks.17 Taken together, we can conclude that the ZSF1-obese animals develop signs of HFpEF and that early echocardiographic alterations are picked up at 10 weeks. At the age of 20 weeks, all criteria for the diagnosis of HFpEF are fulfilled.
Other HFpEF animal models, which are often used in the current literature, are the DSS rat, the thoracic aortic constriction (TAC)-induced pressure overload model, or the diabetic db/db mouse. However, none of them seems to be the ideal candidate concerning comparability to the human clinical picture. The DSS rat, a pure hypertensive HFpEF model, develops severe hypertension (>200 mmHg),32 which is very uncommon in HFpEF patients. In TAC operated mice, a transition of HFpEF to HFrEF is observed frequently, an effect that is rarely seen in humans.33 Furthermore, in these models, HFpEF is induced by artificial interference, which might alter a ‘natural’ emergence and progression of the clinical picture. In contrast, the obese ZSF1 rat carries two leptin receptor mutations leading to symptoms of a metabolic syndrome already at a young age, which in turn seems to trigger the development of HFpEF. Another murine model with alterations of the leptin receptor is the db/db leptin receptor-deficient mouse, which develops morbid obesity accompanied by severe hyperglycaemia secondary to type 2 diabetes.34 However, previous findings are controversial and raise doubt if this model is suitable, owing to an age-dependent drop of the LV ejection fraction.35, 36 Other studies even report no significant functional and structural differences between db/db mice and their lean age-matched controls.37 This is in accordance with recent findings of our group (unpublished data). Therefore, the ZSF1-obese rat seems to be superior to other HFpEF models because it reflects the actual human conditions of HFpEF by far better.
Development of skeletal muscle dysfunction in ZSF1-obese animals
Exercise intolerance is a hallmark of HFrEF and also for patients with HFpEF. Earlier studies in patients and animal models clearly documented alterations in the peripheral skeletal muscle and the diaphragm including muscle atrophy,10, 21, 38 fat infiltration,38 fibre type shift,39 and reduced mitochondrial content and activity.40, 41
In the present study, muscle dysfunction was evident in ZSF1-obese animals beginning at age of 15 weeks depending on the muscle analysed. Not only the absolute force, which depends on muscle mass, was impaired, but also the specific muscle force was reduced in the EDL and soleus muscle. In the EDL muscle, the absolute force is significantly impaired starting at 15 weeks of age, whereas the function of the soleus muscle is much longer preserved and exhibiting functional loss only at 32 weeks of age. These results are in good agreement with earlier observations made in HFpEF animal models10, 21 where a loss of absolute force of the EDL was detected in 20-week-old ZSF1-obese animals,21 whereas the loss of specific force in the soleus was evident but did not reach significance.10 Because no loss of muscle wet weight was detected in the EDL and soleus muscle up to 32 weeks of age, the significant loss of absolute muscle force is somewhat unexpected. Nevertheless, the muscle wet weight might be not the correct measure to assess muscle atrophy. As documented by Haykowsky and collaborators,38 HFpEF patients exhibit increased intermuscular fat content, and these abnormalities in skeletal muscle composition may contribute to the severely reduced exercise capacity as seen in older HFpEF patients. Therefore, we may see no reduction in muscle wet weight, owing to replacement of muscle fibres by fat, but the absolute force may be reduced. Indeed, when staining sections of the EDL muscle from 32-week-old ZSF1-lean and obese animals by using Oil red O, lipid droplets were seen in ZSF1-obese animals.
Absolute and specific muscle force was found to be even higher in ZSF1-obese animals compared with their lean counterparts at a young age, which might be a consequence of higher functional strain due to the significantly elevated body weight. The development of skeletal muscle dysfunctions occurred later in time (starting at Week 15) as the first signs of HFpEF development (seen at age of 10 weeks) were seen. Therefore, it is reasonable to assume that the development of skeletal muscle dysfunction is related to the development of HFpEF and not due to the different genetic mutations present in the leptin receptor in the ZSF1-lean and obese animals.
Development of aortic valve sclerosis in ZSF1-obese animals
Diastolic dysfunction evolves during normal cardiac aging and manifests not only in HFpEF but also in aortic valve stenosis.42 In both entities, an increased afterload predisposes patients to concentric myocardial remodelling and contractile dysfunction. Among the shared co-morbidities, especially, hypertension is highly prevalent among patients with AS43 whereupon the true prevalence of the association is unknown.44 In the present study, we could detect for the first time an impaired aortic valve function represented by an increased flow velocity and pressure gradient in the ZSF1-obese rats. These changes manifested already at 10 weeks of age when E/e′, LV mass, LVAW;d, and LVEDD were increased and MAP became slightly elevated. At 32 weeks of age, when all features of HFpEF were distinct, we could further demonstrate a decrease in aortic valve opening area representing another hallmark of AS. AS is an actively regulated cellular process because the predominant cell population, valvular interstitial cells, can acquire an activated state and mediate an extracellular matrix remodelling, for example, during exposure to elevated mechanical stress in bicuspid aortic valve.45 Whether altered blood-flow dynamics and/or fibrotic remodelling of the myocardium in the condition of HFpEF affects these pathological cellular processes in AS is not clear. As the prognosis of HFpEF and AS is largely driven by co-morbidities,23 it would be preferential to evaluate this point in an experimental model. Based on the respective findings of the present work, we appreciate the ZSF1 rat model also as a valuable tool to investigate changes of aortic valve function in an HFpEF setting.
Study limitations
The present study, describing the development of HFpEF and skeletal muscle dysfunction in the ZSF1 rat model, is very descriptive; and not many molecular mechanisms are presented to explain the development of HFpEF. Nevertheless, just describing the time point at which this animal model develops cardiac and peripheral features of HFpEF is very important for the usage of this model in HFpEF drug development.
As there is no established rat model for AS, estimation of severity of observed changes in valvular function is limited. Because degenerative AS is typically a disease of the elderly,28, 29 the period of observation in our study might be too short to fully understand the development of aortic sclerosis and potentially haemodynamically significant AS in the ZSF1-obese rat model.
Conflict of interest
None declared.
Funding
We are grateful to the Fondation Leducq (network 13CVD04) for the generous support.


