The prognosis of mid-range ejection fraction heart failure: a systematic review and meta-analysis
Abstract
Aims
Mid-range ejection fraction is a new entity of heart failure (HF) with undetermined prognosis till now. In our systematic review and meta-analysis, we assess the mortality and hospitalization rates in mid-range ejection fraction HF (HFmrEF) and compare them with those of reduced ejection fraction heart failure (HFrEF) and preserved ejection fraction HF (HFpEF).
Methods and results
We conducted our search in March 2018 in the following databases for relevant articles: PubMed, CENTRAL, Google Scholar, Web of Science, Scopus, NYAM, SIEGLE, GHL, VHL, and POPLINE. Our primary endpoint was assessing all-cause mortality and all-cause hospital re-admission rates in HFmrEF in comparison with HFrEF and HFpEF. Secondary endpoints were the possible causes of death and hospital re-admission. Twenty-five articles were included in our meta-analysis with a total of 606 762 adult cardiac patients. Our meta-analysis showed that HFmrEF had a lower rate of all-cause death than had HFrEF [relative risk (RR), 0.9; 95% confidence interval (CI), 0.85–0.94]. HFpEF showed a higher rate of cardiac mortality than did HFmrEF (RR, 1.09; 95% CI, 1.02–1.16). Also, HFrEF had a higher rate of non-cardiac mortality than had HFmrEF (RR, 1.31; 95% CI, 1.22–1.41).
Conclusions
We detected a significant difference between HFrEF and HFmrEF regarding all-cause death, and non-cardiac death, while HFpEF differed significantly from HFmrEF regarding cardiac death.
Introduction
Left ventricular ejection fraction (LVEF) has long been used in the stratification of patients with HF, although it is not an ideal parameter owing to its relative subjectivity. The lack of evidence supporting the use of other parameters such as myocardial deformation imaging made LVEF widely accepted for stratifying HF patients.1
Considering LVEF, there are three types of heart failure (HF); the largest is the reduced ejection fraction (HFrEF) (EF < 40%), which is widely distributed, and the smallest is the preserved ejection fraction (HFpEF) (EF > 50%).2 Although HFpEF was considered in the literature only two decades ago, it proved that almost half of HF patients fall in this category with an expected rise in the future.3 Between these two types, there is the mid-range ejection fraction (HFmrEF) (EF 40–49%), which is considered as a grey zone according to the European Society of Cardiology guidelines.2, 4
Although few studies described HFmrEF prevalence in comparison with that of other HF types, HFmrEF proved to have intermediate clinical picture, haemodynamics, laboratory findings, and echocardiographic data between the other two types.1, 5-7
In 2017 and depending on a registry report, the mortality rates of HFmrEF, HFrEF, and HFpEF were reported8; however, a stronger evidence is needed to estimate the rate difference.
In our meta-analysis, we measured all-cause mortality, cardiac mortality, non-cardiac mortality, all-cause hospitalization, and HF-related hospitalization in HFmrEF in comparison with HFrEF and HFpEF to better understand the differences between the three subgroups and to determine the features of HFmrEF.
Methods
The study is written according to the guidelines and recommendations in the PRISMA (Preferred Reporting Items for Systematic Reviews and Meta-Analyses) statement.9 No published protocol for this systematic review and meta-analysis exists.
Literature search strategy
We conducted a systematic search in PubMed, CENTRAL, Google Scholar, Web of Science, Scopus, NYAM, SIEGLE, GHL, VHL, and POPLINE using the terms mid-range ejection fraction heart failure, mid-range ejection fraction heart failure, borderline ejection fraction heart failure, HFmrEF, prognosis, mortality, death, and re-admission. We conducted this search in December 2017, and it was updated in March 2018.
Study selection
Studies were eligible if (i) they aimed at defining the prognosis of HFmrEF in terms of mortality and hospitalization, (ii) they included patients (adult men or women) aged >18 years old with no restriction to the date of publication, and (iii) the studies defined HF subtypes according to the European Society of Cardiology guidelines (HFrEF as <40%, HFmrEF as 40–49%, and HFpEF as ≥50%).2, 4 We did not include studies not restricting to this guideline for fear of data overlap between the HF subtypes.Reviews, comments, duplicated publications, non-English articles, articles with unreliable data extraction, and pooling analyses of original studies were excluded. After including the eligible articles, we manually searched the reference lists of these studies for relevant articles.
Data extraction and quality assessment
The following data were extracted: (i) study characteristics like study title, year of publication, study design, country of study, inclusion criteria of the patients, total sample size, number of patients in each category of HF, their ages, and their gender male percentage; and (ii) criteria of the study outcomes like all-cause mortality, cardiac mortality, non-cardiac mortality, all-cause hospitalization, and HF-related hospitalization.
The methodological quality of included studies was appraised using National Institutes of Health (NIH) Quality Assessment Tool for Observational Cohort and Cross-Sectional Studies.10 The score consists of 14 questions covering the assessment of the study methodology. A study was given one or zero points according to its fulfilment of the conditions. The total score was 14 points, and a study with a score ≥ 10 points was considered of high quality.
Statistical analysis
The study measures included all-cause mortality, cardiac mortality, non-cardiac mortality, all-cause hospitalization, and HF-related hospitalization.
All statistical analyses were performed with the REVMAN software (version 5.3; Cochrane Collaboration, Oxford, UK). The Mantel–Haenszel method was used to calculate estimates, confidence intervals (CIs), and P values. Statistical heterogeneity was tested with the I2 statistic, with I2 ≤ 50% indicating no significant heterogeneity.11 In case of significant heterogeneity, a random effect model was used, while a fixed effect model was used in case of no significant heterogeneity. Relative risk (RR) was calculated from raw published study data, and all outcomes were reported with a 95% CI. For the χ2 test, a P value < 0.05 was considered statistically significant.
Results
Search results
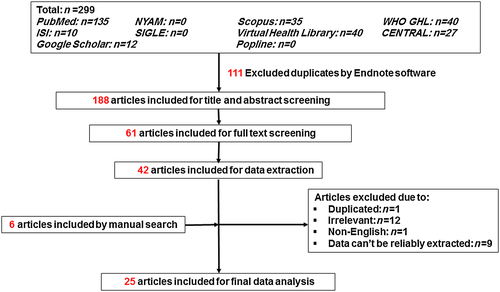
As shown in Figure 1, we identified 299 records in the preliminary search. After scanning the titles or abstracts and removing the duplicates, we excluded 238 articles. The remaining 61 publications underwent full-text screening, of which 42 failed to meet the inclusion criteria and were removed. On data extraction, 23 articles were excluded. On manual searching of the reference lists of the remaining 19 articles, we found another six articles to include. Finally, 25 articles were included in the final data analysis.3, 8, 12-34
Study characteristics
As shown in Table 1, the set of eligible studies consists of 10 prospective cohort studies and 15 retrospective studies with a total of 606 762 patients. The included studies were published from 2001 to 2018. The period of follow-up ranged from 1 month to 5 years, and the most common adjusted variables were age and sex. Regarding the quality of the studies, the NIH scores ranged from 9 to 13 with a mean of 11.2, suggesting the presence of high methodological quality.
| Study | Publication year | Patients' country | Design | Total sample size | HFrEF | HFmrEF | HFpEF | ||||||
|---|---|---|---|---|---|---|---|---|---|---|---|---|---|
| Number | Age (years) | % men | Number | Age (years) | % men | Number | Age (years) | % men | |||||
| Lam et al. | 2018 | New Zealand and Singapore | Prospective cohort | 2039 | 1209 | 62.1 ± 13.2 | 83 | 256 | 65.8 ± 12.7 | 69 | 574 | 71.5 ± 11.8 | 52 |
| Hamatani et al. | 2018 | Japan | Retrospective cohort | 1792 | 860 | — | — | 318 | — | — | 614 | — | — |
| Guisado-Espartero et al. | 2018 | Spain | Prospective cohort | 2735 | 808 | 79 (72–84) | 62 | 281 | 80 (74–84) | 58 | 1664 | 81 (76–86) | 37 |
| Vedin et al. | 2017 | Sweden | Retrospective cohort | 42 789 | 23 805 | — | 70 | 9225 | — | 64 | 9957 | — | 45 |
| Shah et al. | 2017 | USA | Retrospective cohort | 39 982 | 18 398 | 79 (73–85) | 59 | 3285 | 81 (74–86) | 49 | 18 299 | 82 (75–87) | 33 |
| Rickenbacher et al. | 2017 | Switzerland | Retrospective cohort | 622 | 402 | 75.5 ± 7.5 | 67 | 108 | 79 ± 6.8 | 53 | 112 | 80.2 ± 7.1 | 35 |
| Pascual-Figal et al. | 2017 | Spain | Retrospective cohort | 3446 | 2351 | 64.4 ± 12.3 | 76.8 | 460 | 66.7 ± 12.1 | 73 | 635 | 72.1 ± 12.2 | 42.8 |
| Margolis et al. | 2017 | Israel | Prospective cohort | 2243 | 215 | 67 ± 15 | 78 | 858 | 62 ± 13 | 79 | 1013 | 60 ± 12 | 81 |
| Choi et al. | 2018 | Korea | Prospective cohort | 5625 | 3182 | — | — | 875 | — | — | 1357 | — | — |
| Koh et al. | 2017 | Sweden | Retrospective cohort | 42 061 | 23 402 | 72 ± 12 | 71 | 9019 | 74 ± 12 | 60 | 9640 | 77 ± 11 | 45 |
| Gomez-Otero et al. | 2017 | Spain | Retrospective cohort | 1420 | 583 | 68.2 ± 12.8 | 76.7 | 227 | 72.5 ± 11.1 | 67 | 610 | 75 ± 10.7 | 46.7 |
| Farré et al. | 2017 | Spain | Prospective cohort | 3580 | 2232 | 66.2 ± 12.5 | 75.7 | 504 | 68.1 ± 12.9 | 66.9 | 844 | 73.5 ± 11.4 | 44 |
| Delepaul et al. | 2017 | France | Prospective cohort | 482 | 258 | 66 ± 12 | 72 | 115 | 69 ± 13 | 72 | 109 | 71 ± 12 | 55 |
| Chioncel et al. | 2017 | 22 countries | Prospective cohort | 9134 | 5460 | 64 ± 12.6 | 78 | 2212 | 64.2 ± 14.2 | 68.5 | 1462 | 68.6 ± 13.7 | 52 |
| Bonsu et al. | 2017 | Ghana | Prospective cohort | 1488 | 354 | 58.9 ± 14.2 | 48.1 | 265 | 60.4 ± 12.7 | 50.2 | 878 | 60.8 ± 14.6 | 43.3 |
| Bhambhani et al. | 2017 | USA | Prospective cohort | 28 820 | 1084 | 70 ± 10 | 64 | 200 | 72 ± 8 | 52 | 811 | 71 ± 9 | 41 |
| Coles et al. | 2015 | USA | Retrospective cohort | 4025 | 940 | 71.4 | 60 | 364 | 74.4 | 45.1 | 1476 | 75.7 | 33 |
| Coles et al. | 2014 | USA | Retrospective cohort | 3604 | 1479 | 73.7 ± 12.8 | 56.5 | 346 | 76.1 ± 11.4 | 45.4 | 1779 | 76.5 ± 11.9 | 33.4 |
| Cheng et al. | 2014 | USA | Retrospective cohort | 40 239 | 15 716 | 79 (72–85) | 60 | 5626 | 81 (74–86) | 49.5 | 18 897 | 82 (75–87) | 32.7 |
| Tsuji et al. | 2017 | Japan | Retrospective cohort | 3480 | 730 | 66.9 ± 12.7 | 76.7 | 596 | 69.0 ± 11.6 | 71.8 | 2154 | 71.7 ± 10.9 | 60.8 |
| Steinberg et al. | 2012 | USA | Retrospective cohort | 110 621 | 55 083 | 70 (58–80) | 64 | 15 184 | 76 (65–84) | 53 | 40 453 | 78 (67–85) | 37 |
| Toma et al. | 2014 | 398 centres across the world | Retrospective cohort | 5687 | 4474 | 64 (54–73) | 71.4 | 674 | 73 (64–81) | 58.9 | 539 | 76 (66–82) | 41.6 |
| Kapoor et al. | 2016 | USA | Retrospective cohort | 99 825 | 48 950 | 69.6 ± 14.2 | 63.2 | 12 819 | 74.4 ± 13.3 | 51.1 | 38 056 | 75.9 ± 13.1 | 34.9 |
| Löfman et al. | 2017 | Sweden | Retrospective cohort | 40 230 | 12 607 | 67 (59–76) | 75 | 2087 | 71 (62–79) | 47.5 | 3908 | 75 (65–82) | 51 |
| Tsutsui et al. | 2001 | Japan | Prospective cohort | 172 | 61 | 67 ± 14 | 71 | 38 | 69 ± 9 | 61 | 73 | 69 ± 16 | 49 |
- Numbers are expressed as mean ± SD or median (inter-quartile range).
All-cause death
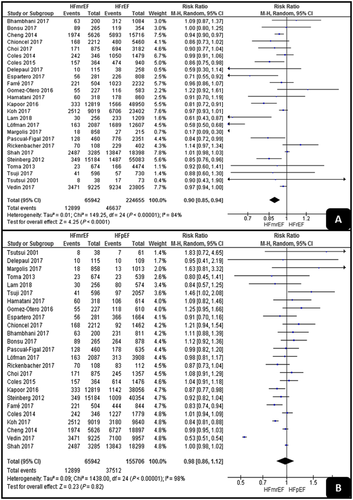
As shown in Figure 2, HFmrEF had a significantly lower all-cause death rate than had HFrEF (RR, 0.9; 95% CI, 0.85–0.94; P < 0.001). On the other hand, there was no significant difference between HFpEF and HFmrEF (RR, 0.98; 95% CI, 0.86–1.12; P = 0.82). Both analyses detected high levels of heterogeneity (I2 = 84% and I2 = 98%).
Cardiac and non-cardiac mortality rates
As shown in Figure 3, the pooled analyses of the cardiac mortality results showed no significant difference between HFrEF and HFmrEF (RR, 0.89; 95% CI, 0.69–1.15; P = 0.38), but HFpEF had a significantly higher cardiac mortality rate than had HFmrEF (RR, 1.09; 95% CI, 1.02–1.16; P = 0.001). The two pooled analyses detected low levels of heterogeneity (I2 = 0% and I2 = 46%).
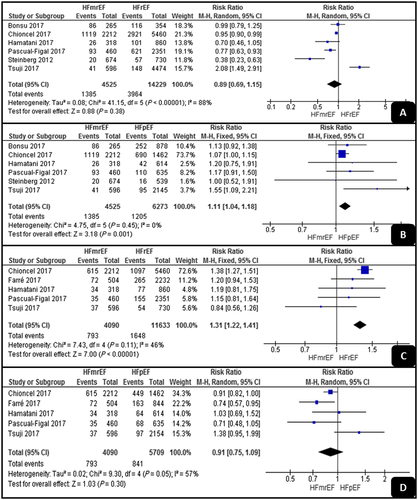
Regarding the non-cardiac mortality results, HFrEF had a significantly higher rate than had HFmrEF (RR, 1.31; 95% CI, 1.22–1.41; P < 0.001), while there was no significant difference between HFpEF and HFmrEF (RR, 0.91; 95% CI, 0.75–1.09; P = 0.3). The analyses showed low and high levels of heterogeneity (I2 = 46% and I2 = 57%).
All-cause and HF-related hospitalization
As shown in Figure 4, the pooled analyses of all-cause hospitalization showed no significant difference between HFrEF and HFmrEF or between HFpEF and HFmrEF (RR, 0.91; 95% CI, 0.18–4.59; P = 0.9; and RR, 0.95; 95% CI, 0.84–1.07; P = 0.38, respectively). Both analyses detected high levels of heterogeneity (I2 = 100% and I2 = 62%).
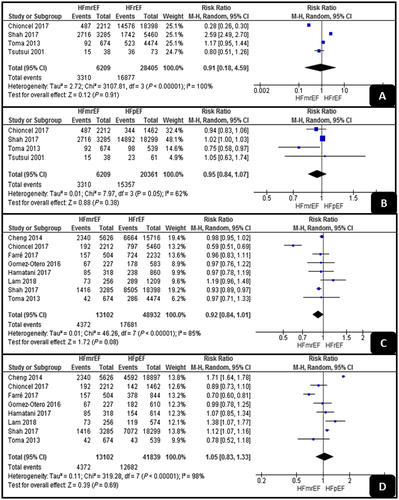
Regarding HF-related hospitalization, the pooled analyses showed also no significant differences between HFrEF and HFmrEF or between HFpEF and HFmrEF (RR, 0.92; 95% CI, 0.84–1.01; P = 0.08; and RR, 1.05; 95% CI, 0.83–1.33; P = 0.69, respectively). Both analyses had high levels of heterogeneity (I2 = 85% and I2 = 98%).
Discussion
For a decade now, it has been uncertain as to whether HFmrEF should be considered as a separate clinical entity of HF and subsequently having different prognosis and treatment from HFpEF and HFrEF or not; so, in our study, we measured the mortality rates and hospital re-admission rates in the different types as a measure of this difference.
Moher et al.9 and Gomez-Otero et al.12 considered HFmrEF as part of HFrEF owing to its high prevalence of ischaemic heart disease and its response to N terminal pro-brain natriuretic peptide-guided therapy. On the other hand, Margolis et al.13 and Coles et al.14 considered HFmrEF as a separate clinical entity with intermediate features between HFrEF and HFpEF.13, 14
Some studies suggested that HFmrEF represents a transitional status or an overlap zone between HFpEF and HFrEF, rather than an independent entity of HF, and another study showed that HFmrEF constitutes intermediate features between both HFpEF and HFrEF, with more similarities towards HFpEF than to HFrEF.35
Morbidity and mortality rates proved to be similar in HFpEF and HFrEF36; however, there are not enough studies to measure them in HFmrEF. On the other hand, there are many studies discussing all-cause mortality, HF-related mortality, all-cause hospital re-admission, and HF-related hospital re-admission, so we pooled these outcomes to better understand this new entity of HF.2
Our meta-analysis is the largest study meta-analysing the results of HFmrEF prognosis in the elderly population. Our study further supports the European Society of Cardiology guidelines by showing a significant difference between HFmrEF and HFrEF or HFpEF. This further supports the guidelines considering HFmrEF as a separate entity. Our meta-analysis detected a significant difference between HFrEF and HFmrEF regarding all-cause death and non-cardiac death, but there was no difference between the two arms regarding cardiac mortality, all-cause hospitalization, or HF-related hospitalization. On the other hand, we detected a significant difference between HFpEF and HFmrEF regarding cardiac mortality, but there was no significant difference between the two arms regarding all-cause death, non-cardiac mortality, all-cause hospitalization, or HF-related hospitalization.
These findings further support the statistical evidence making it a separate entity, but the clinical significance of HFmrEF separation must be reconsidered as only few of the outcomes significantly differed between the HF subtypes, and the measures of those outcomes did not show a high clinical significance.
Accordingly, we recommend developing other studies evaluating the cut-off points separating the HF subtypes. Future studies should consider the transition or the change of HF status over time as this may affect the outcomes. This could help prevent data overlap between the HF subtypes. Also, they should consider other factors affecting the outcomes such as distinguishing between acute and chronic HF and the data distribution inside each arm of HF.
Our study was limited by the marked level of heterogeneity across the studies, the different distribution of precipitating factors of HF possibly playing as confounders, the probably misleading values of RRs (which do not consider the different periods of follow-up), the type of HF (either acute or chronic), and the similarity in the outcome between the three HF subtypes, but this may be explained as the eligible patients in some of the included studies belonged to the same medical centre and were of the same race, which raises the suspicion that their similar lifestyle and co-morbidities are the reason why they have similar mortality rates rather than being influenced by the subtype of HF they have. Also, 20 studies were eligible. Not all of them discussed the four outcomes as primary endpoints, so the small number of the data points made the outcome analysis less informative.
Conclusions
In conclusion, significant differences of hospitalization and mortality were detected between HFmrEF and the other subtypes of HF, which supports classifying HFmrEF as a special subtype.
Conflict of interest
None declared.


