Parameters Influencing Seismic Resilience of Self-Centering Concrete Bridge Piers
ABSTRACT
This study evaluates the optimum combination of the parameters that affect the seismic behavior of self-centering concrete bridge piers. Finite element models of these bridge piers under cyclic loading are developed in this study and validated based on the available experimental data set in the literature. A factorial analysis is performed to understand the effects of various parameters on the strength loss of the low and high aspect ratio piers under monotonic lateral loading as demonstrated in past experimental program. The interaction among different parameters such as the pier aspect ratio, concrete strength, prestress force level, longitudinal steel ratio and thickness of the confining steel jacket was evaluated for 4% drift level and their contribution to the degradation of the pier strength has been determined. The results show that concrete strength, prestress force level, and steel jacket thickness affect seismic behavior for both low and high aspect ratio piers. Steel jacket thickness is found to be the most sensitive for strength loss of high aspect piers, and initial prestress force level is the most sensitive for low aspect piers. The longitudinal steel ratio of the piers does not have any effect on strength degradation. Based on factorial analysis, optimum design parameters and a set of regression equations are proposed for the strength degradation estimation. Optimum design parameters result in 3.68% strength reduction for high-aspect piers and no strength reduction for low-aspect piers. The proposed optimum pier design ensures minimum strength degradation and enhances seismic resilience in the self-centering concrete bridge piers.
1 Introduction
Self-centering bridge piers enhance the seismic resilience of the bridges by minimizing structural damage during an earthquake and offer immediate post-earthquake availability. Earthquake-induced damage reduction and collapse prevention are the core motivation of self-centering mechanisms. A self-centering bridge pier refers to a pier that can return to its original position after an earthquake. Its re-centering capability has made this system different from the conventional bridge piers and has made the bridges seismically resilient. The pier base is not fixed to the foundation. During an earthquake, the pier rotates and moves back to its original position after the lateral force is removed. The force required to restore the pier to its original position is generated by the combined action of the dead loads and pre-/post-tensions inhibited to the segmental blocks. The post-tensioning forces are introduced in the system with tendons that are anchored in the basement and the loading stub passing through the duct of the precast segments. Unlike the conventional system, self-centering systems reduce the residual deformation to zero [1]. This system undergoes minimal damage after an earthquake [2]. The damage concentrates only near the pier bottom. Moreover, this damage also can be minimized significantly if the pier bottom is jacketed with steel, which transforms the reinforced concrete (RC) section into a concrete-filled steel tube (CFST) section [2]. For all these reasons, the pier does not need significant repairing and is available for use after minor repair in case of a moderate seismic event [2]. Minimum damage, lower repairing costs, and rapid availability after earthquake significantly increase the seismic resilience of the bridges. Additionally, the construction procedure of this system is environment friendly too as it lowers the degree of the air, water and sound pollution in the construction site [3]. The quality of the construction work can be maintained irrespective of seasonal variations and the system is also safer for the workers [4].
Housner [5] first studied the self-centering column with a very simple configuration where only gravity force was utilized to explore the rocking behavior without any restoring of post-tensioning force. Many researchers [6-10] also studied rocking columns without using post-tensioning tendons. As the stiffness of the rocking columns without the post-tensioning force becomes negative for large lateral force or drift, the acceptable response of the column is fully governed by the geometry and the gravitational force of the columns [11]. On the other hand, post-tensioning force in the self-centering piers introduces high axial stress, increases stiffness and the delay in the rocking response of the column which makes it more stable against the lateral and seismic loadings.
Many analytical, experimental, and numerical studies [2, 12-17] have been conducted on the simple self-centering columns with post-tensioning tendons for different geometry, material and configuration. Constrained simple rocking columns were developed by Mander and Cheng [12]. Cheng [13] performed shake table tests on a bridge model with two simple rocking columns and showed that the designed bridge setup can sustain 5% of pier rotation, limiting damage and residual deformation. Larkin et al. [14] conducted experimental research on the self-centering pier by placing the unbonded tendons evenly around the center and anchoring the tendons to the side of the footings. The initial tendon stresses varied between 10% and 30% of the ultimate tendon stress and the behavior of the pier was found satisfactory with this configuration. Hewes and Priestley [2] developed an experimental database for the self-centering segmental bridge pier with steel jacketing at the bottom. The developed experimental data show that the piers did not experience a sudden loss of strength for a drift of 4% and 6%, depending on the thickness of the steel jacket. The study also suggests that the rocking columns have negative post-elastic stiffness and low ductility if the axial load ratio is higher than 20%. Dawood et al. [15, 16], Zhang and Alam [17] and Li et al. [18] developed finite element (FE) models for this experiment and showed reasonably good predictions. Li et al. [19] conducted experimental research on both self-centering and monolithic columns by doing a shake table test and concluded that self-centering columns are more ductile and have much lower residual deformations. Bu et al. [20] performed an experimental study on four scaled-down concrete bridge piers. Their findings also suggest that self-centering piers are better than conventional bridge piers in terms of lateral strength and residual displacements. Sideris et al. [21] performed experimental research on full-scale segmental bridge piers with slip-dominant (SD) joints and unbonded tendons. They found that the self-centering piers with the slip-dominant (SD) joints can overcome the limitations of the low energy dissipations while maintaining the required self-centering ability. Yang and Okumus [22] conducted a similar experiment by subjecting quasi-static cyclic loading to large-scale bridge piers constructed using ultra high-performance concrete (UHPC). They concluded that the use of UHPC confined the damage to a limit much lower than the seismic demands. Tazarv and Saiidi [23] used three different types of materials—UHPC, engineered cementitious composite (ECC), and shape memory alloy (SMA) to improve the behavior of the self-centering piers in their experimental study and found that piers with new types of materials are more damage resilient as they experienced only small amount of concrete spalling with 79% reduction in residual displacement than traditional monolithic piers. Wang et al. [24] performed experimental and numerical research on the self-centering columns with various design configurations for high seismic zones and showed that the inclusion of the prestressing force highly increases the self-centering capability. They also discussed that using high-strength rebars also increases the capacity of the column.
The seismic response of the self-centering piers with prestressing forces is good in terms of residual displacement and reparability. However, the limitations in energy dissipation make these piers only usable in low seismic regions [3, 15]. These limitations can be improved by the incorporation of energy-dissipating reinforcements in the column-footing joint area and by using a hybrid rocking column that has both the capability of self-centering and higher energy dissipation by the introduction of external or internal energy-dissipating (ED) devices. The prestressing tendons provide the necessary forces required for self-centered columns and the energy dissipation bars provide the capacity to dissipate the energy due to the lateral seismic loading. A number of research were conducted on self-centering concrete piers with energy dissipators [25-34]. In these studies, external energy dissipators are designed in such a way that they can be replaced after being damaged during an earthquake. Dawood et al. [16] developed FE model of self-centering concrete bridge piers and used mild steel rebars as internal energy dissipators. The results of this study [16] conclude that the rebars with lower reinforcement ratios have the ability of higher energy dissipation. Li et al. [18] used both mild steel and shape memory alloy rebars (SMA) for increasing energy dissipation capacity and found that the SMA bars cause higher energy dissipation while keeping the residual drift lower than the mild steel rebars. Concrete piers with both bonded and unbonded tendons are studied in this numerical study [18], and it is found that the piers with bonded tendons have higher lateral strength but lower hysteric energy dissipation capacity. These findings are also like the early experimental research performed by Wang et al. [35]. In this experimental research [35], it was also found that the self-centering piers with bonded tendons have a higher lateral capacity, more seismic energy dissipation and higher residual displacements than the unbonded bridge piers. Ou et al. [36] conducted experimental and numerical study on the bridge piers with bonded mild steel rebars as internal energy dissipators and recommended a 0.5% reinforcement ratio for energy-dissipating rebars. Wang et al. [25] also used mild steel reinforcement internal energy absorber and increased the bottom most segment height for better ductile behavior and hysteretic energy dissipation. Marriott et al. [26] conducted experimental research on the hybrid concrete bridge piers with external replaceable energy dissipators and compared the hysteric force-displacement relationship with conventional monolithic bridge piers and simple self-centering piers without an ED device. From the results of this study, the authors concluded that the hybrid piers demonstrate better performance in the protection of bridges during an earthquake. Chou and Hsu [27] conducted experimental studies of segmental columns with the ED device and double-steel tube confinement. The columns in these experiments attained a 6% drift with little residual displacement and strength deterioration [27]. Guo et al. [28] experimented with lateral cyclic loading on the self-centering piers using fiber-reinforced polymer (FRP) in the tendon and glass fiber-reinforced (GFRP) in the jacket with up to 4% lateral drift. They used FRP tendons in their research for the enhanced durability of the piers and showed that FRP prestressing tendons can be a promising alternative to steel tendons due to their corrosion-resistant properties. Additionally, they showed that GFRP jacketing is also effective in lowering the crushing of concrete in the piers due to lateral loading. Tazarv et al. [37] conducted experimental testing with replaceable tendons outside the bridge columns and recommended some design guidelines. He showed that the bridge columns with UHPC precast sections and replaceable tendons are also a better alternative to the monolithic concrete columns to achieve seismic resilience. Mashal and Palermo [38] performed quasi-static cyclic loading tests on the 50% scaled-down model of the bridge bent with self-centering piers. The findings from this experimental study [38] showed that even after several cycles of higher lateral drifts, there was no considerable damage or residual displacements in the bridge. Dangol and Pantelides [29] tested a hybrid bridge bent with a combination of unbonded self-centering piers and buckling restrained braces (BRB) as an external energy dissipator. They loaded the bridge system till the failure and fracturing of the BRB, converting it into a sacrificial energy dissipating member before the piers reached their failure drift. The research results show that the inclusion of the BRB in the system enhances the seismic energy dissipation of the system. Upadhyay and Pantelides [30] developed fragility curves for the self-centering piers with the BRB as an energy-dissipating member. These curves can be used for the preliminary seismic design of the self-centering bridges. Innovative research concepts have been applied to self-centering piers recently. Manzo and Vassiliou [39] updated the self-centering system to a base isolation system by incorporating the springs in the piers with the unbonded tendons. The tested piers could sustain the lateral drift of 15% with a very minimal amount of damage. Much experimental, analytical and numerical research has been done on the self-centering piers to date. Due to the potential of self-centering piers in cost saving, immediate reliability and availability, they have also started to be accepted in practice and seem to be effective even after an earthquake [38, 40]. The Wigram-Magdala Link Bridge in New Zealand, which was constructed following the self-centering mechanism, stayed undamaged after the Kaikoura earthquake in 2016 [38].
As the earlier studies did not focus on the strength loss of the pier due to lateral loading, this study evaluates its behavior for strength reduction. As the lateral capacity of the bridge piers is a key design parameter in the seismic design, it is important to verify that the pier has adequate base shear capacity and does not suddenly lose strength during the earthquake. Thus, the strength reduction and the contribution of the different design parameters in the reduction of strength are highly important in the design of the self-centering bridge piers. Hence, this study develops FE models of the bridge piers based on the experiments conducted by Hewes and Priestley [2], and the models are validated against their experimental results. Next, a parametric study is conducted, and the contribution of the design parameters is evaluated for the strength reduction of the pier based on the factorial analysis. The results obtained from the study will help the designer select the optimum configuration of the pier with minimum loss of lateral strength during an earthquake.
2 The Experimental Program Developed by Hewes and Priestley [2]
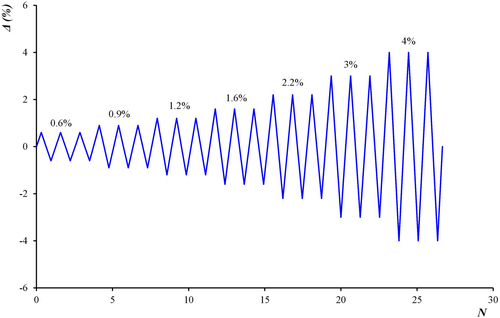
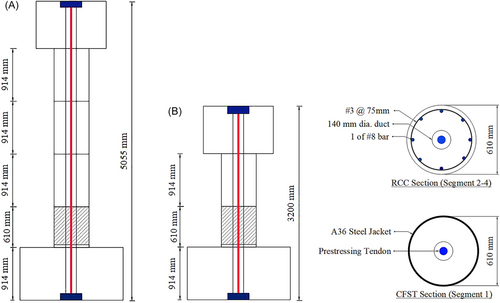
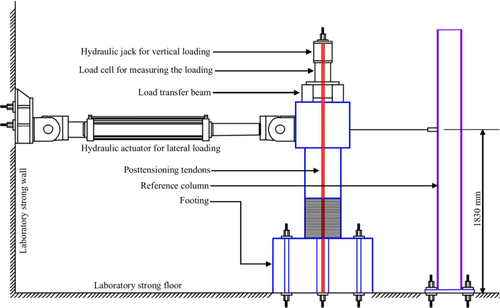
Hewes and Priestley [2] developed an experimental program to understand the behavior of four nos. of self-centering piers. Among them, two are high aspect ratio and two are low aspect ratio piers. All four piers, designated as JH1, JH2, JH3, and JH4, were subjected to incremental cyclic loading shown in Figure 1, where is the drift level , N represents cycle number. Among these piers, the JH1 and JH2 are of high aspect ratio (H/D = 6) with four precast cylindrical concrete segments, while the JH3 and JH4 are of low aspect ratio (H/D = 3) with only two precast concrete segments. All four pier samples (JH1, JH2, JH3, and JH4) had a steel jacket at the bottom-most concrete section to avoid any concrete spalling at extreme peak loads. A 25 mm clearance was maintained between the steel jacket and the top of the footing to prevent any contact between them during the lateral loading. The prestressing tendons passed through a pier duct with a diameter of 140 mm at the centerline of the pier. Dimensions of the high and low aspect piers are shown in Figure 2. The details of the experimental setup [2] used are shown in Figure 3. Geometric properties for the piers, concrete compressive strength and tensile strength of the steel used for jacket are summarized in Tables 1–3, respectively.
| Geometric properties of the pier | = 6 | = 3 | ||
|---|---|---|---|---|
| JH1 | JH2 | JH3 | JH4 | |
| Pier diameter | 610 mm | 610 mm | 610 mm | 610 mm |
| Height of reinforced segments | 900 mm | 900 mm | 900 mm | 900 mm |
| Height of jacketing segments | 610 mm | 610 mm | 610 mm | 610 mm |
| Thickness of jacketing steel | 6 mm | 3 mm | 3 mm | 6 mm |
| Longitudinal bar | #4 bar | #4 bar | #4 bar | #4 bar |
| Spiral of segment | #3@75 mm | #3@75 mm | #3@150 mm | #3@150 mm |
| Specimen | 28 Day | Day of test 1 | Day of test 2 |
|---|---|---|---|
| JH1 | 44 MPa | 48.7 MPa | 57.0 MPa |
| JH2 | 44 MPa | 50.8 MPa | 55.5 MPa |
| JH3 | 48.5 MPa | 57.3 MPa | 57.1 MPa |
| JH4 | 48.5 MPa | 58.1 MPa | 57.8 MPa |
| Footing | 49.5 MPa | 61.4 MPa | — |
| Specimen | Size | Yield strength, | Ultimate strength, |
|---|---|---|---|
| JH1 | 6.2 mm | 303 MPa | 464 MPa |
| JH2 | 2.9 mm | 283 MPa | 390 MPa |
| JH3 | 2.8 mm | 290 MPa | 364 MPa |
| JH4 | 6.0 mm | 317 MPa | 463 MPa |
The four sample piers (JH1, JH2, JH3, and JH4) were erected using the precast concrete sections stacking one over the other. The tendons were anchored at the top of the loading head and at the bottom of the footing with 27 nos. 12.7 mm dia. 7-wire low-relaxation Grade 270 prestressing strands. The cross-sectional area of the prestressing tendon was 2665 mm2. As the prestress induces high axial stresses in the two end sections and the loading head passes a constant compressive force, the loading head and the footing were designed with a higher reinforcement ratio for carrying a high axial load. The concrete strength at 28 days and on test days are summarized in Table 2 [2]. Two kinds of steel plate with nominal thickness, t = 3 mm (2.9 and 2.8 mm for JH2 and JH3, respectively [2]) and 6 mm (6.2 and 6.0 mm for JH1 and JH4, respectively [2]) were used as steel jackets. The mechanical properties of the steel plates are shown in Table 3.
The footing was connected to the strong floor with six 44.5 mm dia. post-tensioning tendons. The cyclic load was applied to the pier loading head by a servo-controlled 980 kN capacity hydraulic actuator. A constant axial load of 890 kN was applied to the pier head by a transfer beam and a pair of high-strength post-tensioning bars. The axial compressive load was applied to the pier head to simulate the dead load of the bridge superstructure and the self-weight of the pier. Each specimen's first test was subjected to a drift (3%–4%) with approximately 40% of ultimate prestress so that the damage was limited to a small number of cracks. Later, the cracks were repaired, and the specimens were subjected to higher drift (6%) at a higher level of prestress (approximately 60% of ultimate prestress).
3 FE Modeling
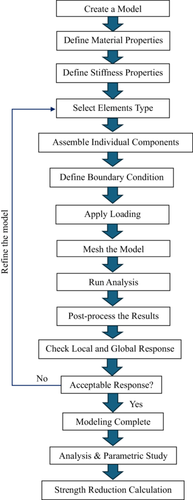
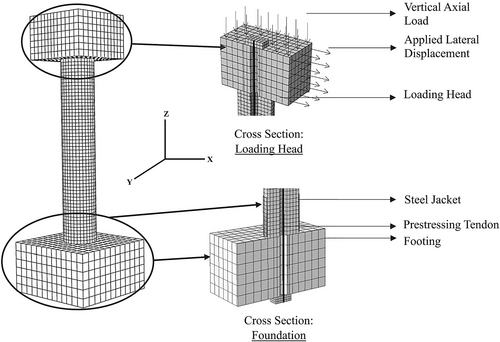
The developed FE models in earlier studies [15-18] are capable of capturing the general behavior of the self-centering piers. However, previous studies did not include a standard approach suitable for capturing the strength degradation of the pier. For this reason, a 3D FE model is developed in the present study and validated using the experimental results [2] for exploring the strength reduction behavior of piers. The developed 3D FE model considers both material and geometric nonlinearities. Eight-noded solid elements, two-noded truss, and four-noded shell elements, as enlisted in Table 4 are used for developing the model. A flowchart showing the steps involved in developing the FE model is shown in Figure 4. Loading, boundary condition, and geometry of the model are shown in Figure 5.
| Component | Material type | Element type |
|---|---|---|
| Circular member | Reinforced concrete | Continuum element |
| Circular CFST member | Concrete filled steel tube | Continuum element |
| Post-tensioning strand | Prestressing steel | Truss element |
| Footing | Reinforced concrete | Continuum element |
| Loading head | Reinforced concrete | Continuum element |
| Jacketing steel | ASTM A569, A36 steel | Shell element |
| Reinforcement | Mild steel | Truss element |
3.1 Material Modeling
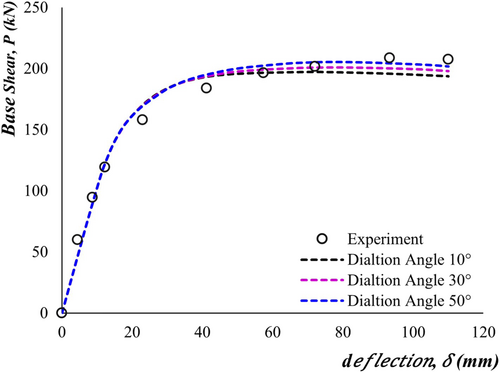
The bridge pier consists of precast RC segments, loading head, prestressing strands and RC footing connected to a strong floor. The concrete segment of the pier is simulated using concrete damage plasticity (CDP) model in FE software. The CDP model is primarily designed for simulating the behavior of the nonlinear plastic behavior of the RC. The model is based on isotropic damaged elasticity in combination with isotropic tensile and compressive plasticity. The model focuses on the two basic failure behavior of the concrete—approach until the cracking occurs. The tensile strength of concrete is taken as . After cracking in tensile loading and crushing in compressive loading. The CDP model uses the yield function developed by Lubliner et al. [41] and further modified by Lee and Fenves [42]. The evolution of the yield surface and the yield criteria in the damaged plasticity model are defined using the five parameters—(1) the dilation angle, (2) the flow potential eccentricity, (3) the ratio of initial equi-biaxial compressive yield stress to initial uniaxial compressive yield stress , (4) the ratio of the second stress invariant on the tensile meridian to that on the compressive meridian (K) and, (5) the viscosity parameter. A sensitivity analysis has been conducted to find the dilation angle, and it is found that the dilation angle of 50° provides a good agreement with the experimental result and ensures better convergence, as shown in Figure 6. The remaining four parameters are enlisted in Table 5.
| Eccentricity | K | Viscosity parameter | |
|---|---|---|---|
| 0.1 | 1.16 | 0.66 | 0.001 |
Due to the applied lateral cyclic loading, the pier develops high compressive stresses near the pier bottom. To minimize the damage in this region, steel jacketing is used to confine the spalled concrete near the column base [2]. For modeling the spiral confined concrete, constitutive model developed by Mander et al. [43] is used. Besides, for modeling the steel jacket confined concrete, the constitutive law of Han [44] is used. Han [44] model separately develops the constitutive laws for jacketing steel and core concrete and suggests the methodology to simulate the interaction between the concrete and steel jacket. Both types of concrete material model are used for simulating the concrete behavior using the CDP modeling. The tensile softening behavior of the concrete is modeled as following the linear elastic reaching the ultimate tensile strength, the stress-strain graph is followed by a horizontal plateau. This method is followed to have better numerical stability and convergence in the simulation [45].
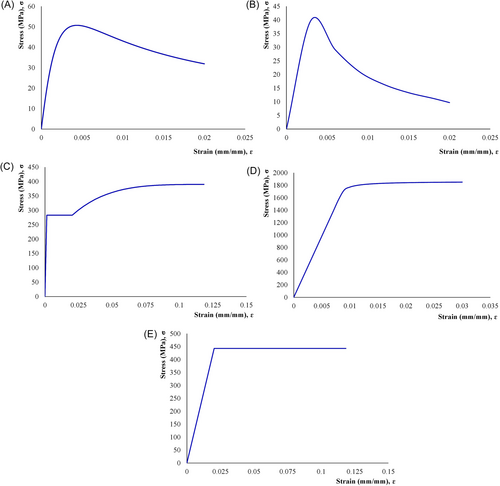
A classical metal plasticity model from Tao et al. [46] is used for simulating the jacketing steel, and elastic-perfectly plastic constitutive (EPP) is used for modeling the longitudinal and transverse reinforcements. Classical metal-plasticity constitutive relationship is followed for simulating the tendon. The stress-strain relationships of these models are shown in Figure 7.
3.2 Contact Modeling
The interfaces between concrete segments of the self-centering pier open up at higher drift ratios, which means the joint is allowed to rotate during the lateral loading. To model this phenomenon, hard contact between node to surface is used for the normal contact behavior. The tangential behavior of the contact surfaces is modeled using the penalty method. A small sliding formulation was chosen among all these contact behaviors because it is computationally less expensive than finite sliding as discussed in Zhang and Alam [17]. The friction coefficient considered for both concrete-concrete and steel-concrete interaction is 0.5 as suggested by Dawood et al. [15]. The friction coefficient is suggested based on the sensitivity analysis carried on in the earlier study by Dawood et al. [15]. In the present study, values of friction coefficient between concrete surfaces () and concrete and steel surfaces () used for sensitivity analysis are 0.1, 0.3, and 0.5, and the observation is also consistent with the past numerical investigation [15] and experimental results [2] as shown in Figure 8.
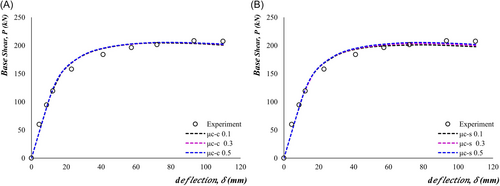
The prestressing tendon is simulated using a truss element which is connected to two external highly rigid steel plates. The connections between the rigid plate-footing, rigid plate-loading head and the connections of the rigid plate with the prestressing tendon are modeled using tie constraints. The longitudinal and transverse reinforcements are embedded using the embedded constraint into the precast concrete segments, which act as the host region. Perfect bonding between the steel reinforcements and the concrete is considered for modeling the rebars inside the pier segments. The transitional degrees of freedom of the embedded elements are constrained by the host elements. In other words, the slippage between the concrete and the reinforcements is not considered in the model.
3.3 Loading and Boundary Conditions
In the experiment [2], a constant axial load of 890 kN was applied to the pier head for modeling the vertical dead loads and the self-weight of the bridge superstructure and the pier. Additionally, the prestress force acted as an axial force and the lateral loading was applied using a hydraulic actuator. These loading sequences and the protocol of the experiment are followed in the FE model.
Both the axial dead load and the lateral cyclic load have been applied on the loading head of the pier using three steps. In the first step, the prestressing forces are applied without the dead and lateral loads. The initial prestressing forces are applied as stress through the truss elements on the pier. The constant axial dead load, including the self-weight of the bridge superstructure, is applied in the second step. In the third step, cyclic lateral loading has been applied on the loading head as a displacement-controlled method. In the FE model, the pier bottom is constrained in all directions and is not allowed to have any translations or rotations to simulate the laboratory's strong floor.
A mesh sensitivity analysis has been performed to determine the suitable mesh size that ensures convergence and less expensive computation. Based on the sensitivity analysis, a mesh size of 60 mm has been chosen for both the high aspect ratio and low aspect ratio piers.
3.4 Validation of the Bridge Pier Model
The FE models are validated with the experiments conducted by Hewes and Priestley [2]. The cyclic force-displacement simulation responses, in addition to the deflected shapes, maximum and ultimate base shear and residual displacements are compared with that of experiments. The pictorial presentation in Figures 9 and 10 shows the qualitative deflected shape and how the pier to footing connection opens up for both experiment and simulation. The damage observed in the experiments (shown in Figure 11a) is also comparable to the simulation as the equivalent strain shown in the strain contour plot (Figure 11b) crosses the threshold strain of 0.003 at the peak horizontal drift ( = 3%) of the pier JH1.
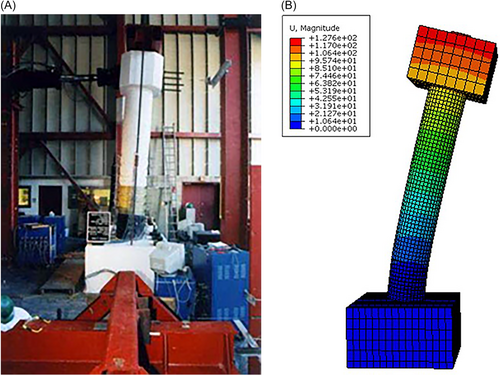
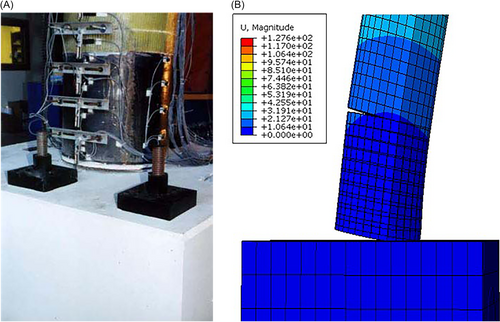
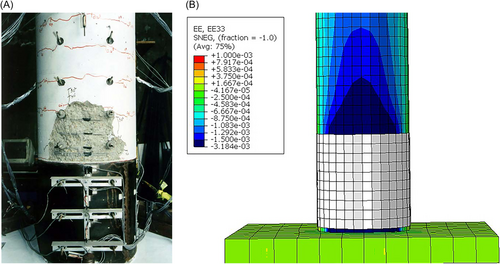
Cyclic force-displacement simulation responses, compared in Figure 12, show that simulation predictions of JH11, JH31, and JH41 shown Figure 12a,c,d are in well agreement with the experimental responses and JH21 in Figure 12b is not in well agreement for full pull and push loading. All simulation responses predict self-centering behavior with small residual drifts. It is to note that the validation efforts of the high aspect piers used the same load paths depicted in Figure 1. As the number of load cycles do not have much influence on the simulation results, the remaining simulation responses with single cycle for each drift range (0.6%, 0.9%, 1.2%, 1.6%, 2.2%, 2.4%, 3%, and 4%) are compared with the experimental results as shown in Figure 12c,d.
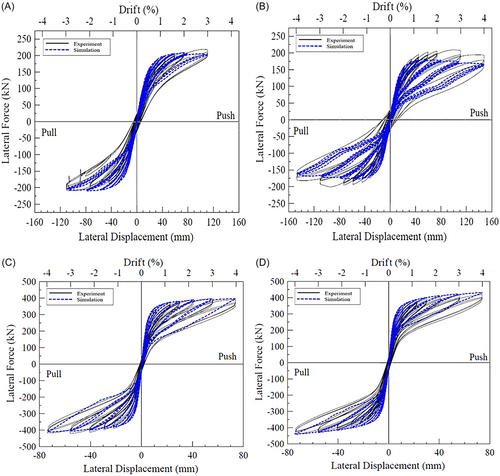
Responses of maximum and ultimate base shear for both Pull and Push loading are compared in Table 6 showing the percentage of errors of the simulation responses. The error is higher for the high aspect ratio piers. The highest error of 18.22% is found for JH2's maximum base shear during push loading. There is no loss in the capacity of the low aspect piers at 4% drifts. The JH2 pier lost 7% strength of the base shear at 4% imposed drift for the experimental loading. At this drift level in the experiment, a number of cracks developed and significant damage was concentrated near the pier bottom. These phenomena are difficult to incorporate accurately in the FE model, which resulted in higher errors for JH2. However, low aspect ratio piers did not develop major cracks or damage within the 4% drift range. Thus, the pier models JH3 and JH4 produce more accurate results. The results obtained from the FE analysis are consistent with the findings of previous numerical studies [15-18].
| Loading condition | Test specimen | Maximum base shear (kN) | Ultimate base shear (kN) | ||||
|---|---|---|---|---|---|---|---|
| Experiment | FEM | Error (%) | Experiment | FEM | Error (%) | ||
| Pull | JH11 | 206.30 | 207.94 | 0.79 | 206.30 | 200.95 | 2.59 |
| JH21 | 194.20 | 177.79 | 8.45 | 179.30 | 162.07 | 9.61 | |
| JH31 | 418.70 | 411.23 | 1.78 | 417.90 | 411.23 | 1.60 | |
| JH41 | 438.70 | 440.02 | 0.30 | 438.70 | 440.02 | 0.30 | |
| Push | JH11 | 217.00 | 206.82 | 4.69 | 217.00 | 200.87 | 7.43 |
| JH21 | 206.90 | 177.34 | 14.29 | 192.40 | 157.34 | 18.22 | |
| JH31 | 399.00 | 400.66 | 0.42 | 391.00 | 400.66 | 2.47 | |
| JH41 | 419.70 | 428.13 | 2.01 | 419.70 | 428.13 | 2.01 | |
4 Parametric Study and Results
The high aspect and the low aspect ratio piers having the same geometric configuration of Hewes and Priestley [2] are selected for the parametric analysis. Factorial analysis also has been carried out by varying their material properties, steel ratio of the pier, thickness of the steel jacket and prestress level. The parametric study is conducted to find how the material properties, steel ratio, confining steel, and different prestressing force levels are contributing to the strength degradation of the bridge pier. Finally, the results are analyzed, and regression equations are proposed to calculate the strength reduction of the pier at 4% lateral drift.
4.1 Two Factor Factorial Design
The introduction of the factorial analysis in the parametric study helps find the optimum solution, understand the interaction among the factors, find the weightage and importance of the different factors contributing to the response. Moreover, the method of addressing one component at a time typically ignores the interactions among the factors and factorial analysis sheds light on these interactions [48].
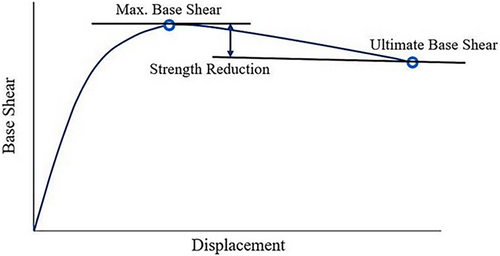
At first, a two-factor factorial analysis also known as 2k factorial design has been conducted on the high aspect ratio piers. In 2k factorial design the factors are considered at two levels - the high level and low level. As four factors are considered at two levels, the complete 2k factorial analysis requires 24 numbers of runs. The response for different factors is determined and plotted between these two levels. The high and low levels of the factors are selected carefully to see the response of the variable factors in the desired region. The considered factors for the 2k factorial design are concrete strength, prestress force level, longitudinal steel ratio and the thickness of the jacketing steel. Among these factors, concrete strength is itself a material property, the jacket thickness is a property that contributes to the strength of the CFST section. Prestress force level or prestress ratio is defined as the ratio of the applied prestress to the ultimate strength of the prestressing tendons. Prestress force level is not directly a material property, but it contributes to the strength of the pier. The ultimate strength of the prestressing tendons is considered as 1860 MPa, the same as the tendons used in the experimental program by Hewes and Priestley [2]. The longitudinal steel ratio is the ratio of the cross-sectional area of the longitudinal steel to the cross-sectional area of the gross concrete section of the piers. Each of the factors was considered at two levels for determining the response of the bridge pier. The range of the variable factors are chosen from the study of Wang et al. [49]. The bottom most steel jacket thickness and the prestress ratio are kept similar to the experimental study. The high and low levels for 2k factorial design are shown in Table 7. In Table 8, the results of the 2k factorial analysis are summarized as the test matrix. The factors in Table 8 are varied between the high and the low levels and the strength reduction is calculated for 4% lateral drift. The strength reduction of the piers for lateral loading is calculated using Equation (1) [47].
| Concrete strength (MPa) | Longitudinal steel ratio (mm2/mm2) | Prestress force level | Jacketing steel thickness (mm) |
|---|---|---|---|
| 30 | 0.003 | 0.3 | 3 |
| 50 | 0.009 | 0.6 | 6 |
| Concrete strength (MPa) | Longitudinal steel ratio (mm2/mm2) | Prestress force level | Jacketing steel thickness (mm) | Strength reduction (%) |
|---|---|---|---|---|
| 30 | 0.003 | 0.3 | 3 | 13.10 |
| 50 | 0.003 | 0.3 | 3 | 7.27 |
| 30 | 0.009 | 0.3 | 3 | 13.05 |
| 50 | 0.009 | 0.3 | 3 | 7.18 |
| 30 | 0.003 | 0.6 | 3 | 18.84 |
| 50 | 0.003 | 0.6 | 3 | 12.14 |
| 30 | 0.009 | 0.6 | 3 | 18.81 |
| 50 | 0.009 | 0.6 | 3 | 11.82 |
| 30 | 0.003 | 0.3 | 6 | 5.90 |
| 50 | 0.003 | 0.3 | 6 | 3.68 |
| 30 | 0.009 | 0.3 | 6 | 5.98 |
| 50 | 0.009 | 0.3 | 6 | 3.83 |
| 30 | 0.003 | 0.6 | 6 | 11.22 |
| 50 | 0.003 | 0.6 | 6 | 6.69 |
| 30 | 0.009 | 0.6 | 6 | 10.80 |
| 50 | 0.009 | 0.6 | 6 | 6.74 |
From the 2k factorial analysis, it is found that all the factors under investigation are sensitive for determining the strength degradation of the pier, except the longitudinal steel ratio. The longitudinal stress ratio is much less sensitive for strength degradation. The p-value analysis also shows that the longitudinal stress ratio yielded a p-value of 0.894 after the full 2k factorial analysis. For the other considered factors, the p-value was found to be p < 0.05, which means the other factors have a strong influence in the determination of the strength degradation of the bridge pier at 95% confidence level. Moreover, from Table 8, it can be observed that the variation of the strength loss with the variation of the longitudinal steel is insensitive. Apart from statistical evidence, it can be understood from basic structural mechanics. Longitudinal steel is one of the main contributors to the strength and capacity of the monolithic columns. However, in the self-centering columns, the column is constructed by joining multiple precast RC sections. The major difference here is that the longitudinal steels do not continue in between the precast sections or throughout the column. Hence, the longitudinal steel here does not contribute to the global behavior of the column, such as the base shear. Longitudinal steel mainly contributes to the axial capacity of the pier and the pier strength loss is calculated in terms of the base shear. As a result, the longitudinal steel is found to be insensitive in the calculation of the base shear as well as the lateral strength degradation of the self-centering piers.
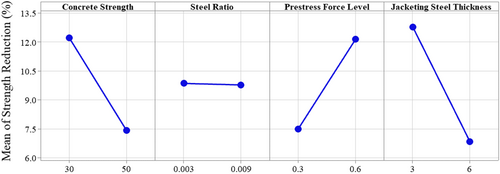
From Figure 14, it is also evident that the longitudinal steel ratio has almost no influence in the strength reduction. The main effect plot for the considered factors—concrete strength, longitudinal steel ratio, prestress force level, and the jacket thickness are shown in Figure 15 which shows that there are no significant changes in the strength reduction for increasing the steel ratio from 0.003 to 0.009.

Moreover, it was found from the preliminary analysis that the curvature in the response surface is not possible to capture with the two-factor factorial design. Hence, to overcome these limitations, a more comprehensive parametric study has been conducted using the more important three factors at three levels. The number of runs required for the new factorial analysis becomes 33 times for each type of bridge pier. A total of 54 numbers of runs have been done for the two types of the pier.
4.2 Three Factor Factorial Design for High Aspect Ratio Piers
As described in the previous section, it is found that the longitudinal steel ratio is found as the least significant factor in the two-factor factorial analysis and thus is excluded in the further analysis. A new test matrix has been formed for the high and low aspect ratio piers, considering the three significant factors at three levels for further detailed parametric study. The three factors are concrete strength, prestress force level and thickness of the jacketing steel. The factorial analysis thus requires 27 number of runs for each type of pier. The concrete strength is varied from 30 to 50 MPa, the prestress force level from 0.3 to 0.6 and the jacketing steel thickness from 3 to 6 mm as shown in Table 9. The test matrix for parametric study and the results are summarized in Table 10 and the base shear versus the displacement curves based on these factors are plotted in Figure 17. All the piers are subjected to a 4% drift and strength reduction is calculated from the force-displacement responses of the pier as discussed in Section 4.1.
| Concrete strength (MPa) | Prestress force level | Jacketing steel thickness (mm) |
|---|---|---|
| 30 | 0.30 | 3.0 |
| 40 | 0.45 | 4.5 |
| 50 | 0.60 | 6.0 |
| Run no | Concrete strength (MPa) | Prestress force level | Jacketing steel thickness (mm) | Strength reduction (kN) | Max base shear (kN) | Min base shear (kN) | Strength reduction (%) |
|---|---|---|---|---|---|---|---|
| 1 | 30 | 3 | 0.30 | 17.28 | 131.97 | 114.69 | 13.10 |
| 2 | 40 | 3 | 0.30 | 13.18 | 140.02 | 126.84 | 9.42 |
| 3 | 50 | 3 | 0.30 | 10.61 | 145.99 | 135.38 | 7.27 |
| 4 | 30 | 0.45 | 0.30 | 25.90 | 158.95 | 133.05 | 16.29 |
| 5 | 40 | 0.45 | 0.30 | 21.42 | 170.61 | 149.19 | 12.56 |
| 6 | 50 | 0.45 | 0.30 | 17.02 | 178.75 | 161.73 | 9.52 |
| 7 | 30 | 6 | 0.30 | 33.90 | 179.91 | 146.02 | 18.84 |
| 8 | 40 | 6 | 0.30 | 29.26 | 196.19 | 166.94 | 14.91 |
| 9 | 50 | 6 | 0.30 | 25.34 | 208.67 | 183.33 | 12.14 |
| 10 | 30 | 3 | 4.5 | 11.40 | 135.78 | 124.38 | 8.39 |
| 11 | 40 | 3 | 4.5 | 9.41 | 142.87 | 133.46 | 6.59 |
| 12 | 50 | 3 | 4.5 | 7.63 | 148.29 | 140.66 | 5.15 |
| 13 | 30 | 0.45 | 4.5 | 19.20 | 165.09 | 145.90 | 11.63 |
| 14 | 40 | 0.45 | 4.5 | 15.47 | 175.09 | 159.62 | 8.84 |
| 15 | 50 | 0.45 | 4.5 | 12.93 | 182.84 | 169.91 | 7.07 |
| 16 | 30 | 6 | 4.5 | 27.04 | 188.83 | 161.80 | 14.32 |
| 17 | 40 | 6 | 4.5 | 22.51 | 202.96 | 180.45 | 11.09 |
| 18 | 50 | 6 | 4.5 | 19.09 | 213.47 | 194.38 | 8.94 |
| 19 | 30 | 3 | 0.60 | 8.17 | 138.40 | 130.23 | 5.90 |
| 20 | 40 | 3 | 0.60 | 7.07 | 145.22 | 138.15 | 4.87 |
| 21 | 50 | 3 | 0.60 | 5.52 | 149.96 | 144.45 | 3.68 |
| 22 | 30 | 0.45 | 0.60 | 14.18 | 169.32 | 155.13 | 8.38 |
| 23 | 40 | 0.45 | 0.60 | 11.45 | 178.68 | 167.24 | 6.41 |
| 24 | 50 | 0.45 | 0.60 | 9.98 | 185.43 | 175.44 | 5.38 |
| 25 | 30 | 6 | 0.60 | 21.97 | 195.86 | 173.89 | 11.22 |
| 26 | 40 | 6 | 0.60 | 17.74 | 208.28 | 190.54 | 8.52 |
| 27 | 50 | 6 | 0.60 | 14.57 | 217.74 | 203.18 | 6.69 |
Here, R = Prestress force level of the pier.
= Effective initial prestress of the pier in MPa.
= Ultimate strength of the tendon material in MPa (1860 MPa).
It is observed from the test matrix (Table 10) that the percentage of the strength reduction is always higher for the low-strength concrete. This can also be seen from the graphs plotted in Figures 16 and 17. The low concrete strength piers have a lower yield value, and the strength reduction is also higher for these piers. On the other hand, the piers with higher strength of concrete have higher yield value for the base shear and the strength reduction is very low for these piers. The reason behind this is that high-strength concrete piers have more capacity in terms of base shear. The high-strength concrete enables the pier to sustain higher lateral drift without having significant damage or strength loss. Due to the lower amount of damage, the strength loss of these piers starts at a very high drift value. This observation also matches with the test matrix in Table 10 for the high aspect ratio piers, keeping the other factors at the same level and decreasing the concrete strength from 50 to 30 MPa increases the strength reduction of the pier for all the cases.

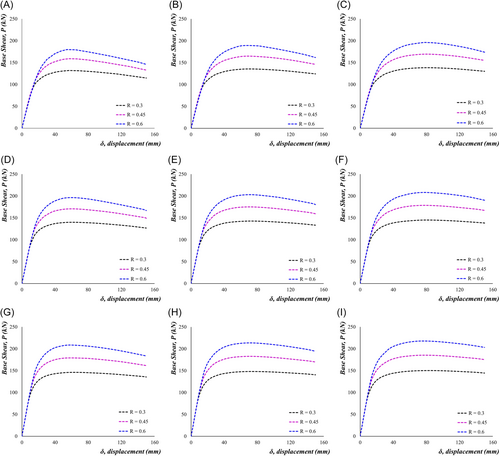
Again, from the results from Figures 16 and 17, it can also be said that the strength reduction is greater for the higher prestress loading. When the applied prestress level is higher, the strength reduction is also higher for the same strength of concrete, as higher PT forces introduce very high axial compressive stresses in the pier bottom. A higher PT force increases the axial stress in the bottom-most section of the pier and concrete stress in this section reaches the capacity.
From Table 10, increasing the prestress force level from 0.3 to 0.6 increases the strength reduction from 3.68% to 6.69% for the 50 MPa concrete and 6 mm steel jacket. Additionally, for a 6 mm jacket and 0.3 prestress force level, increasing the concrete strength from 30 to 50 MPa changes the strength reduction from 11.22% to 6.69%. The strength reduction almost doubles for increasing the prestress force level from 0.3 to 0.6 in this case. Hence, the description of the previous sections and the results of the test matrix suggest combining the higher strength concrete and lower prestress force level for minimum strength reduction.
Another important parameter of the self-centering pier is the steel jacket at the bottom segment. The bottom-most segment is the critical region of the self-centering pier due to two reasons. Firstly, this region faces very high compressive stresses due to the high compressive axial loading. Secondly, during the lateral cyclic loading, the plastic hinge forms in this region and most of the concrete damage is concentrated in this region [2]. Hence, the strength reduction and overall performance of the bridge pier depend on this segment significantly. The strength of the steel-confined section of the bottom most segment depends on the core concrete strength, the bonding between the steel and concrete and the hoop stresses developed by the steel jacket [2]. The hoop stresses developed by the steel jackets are again dependent on the jacketing steel's properties and the degree of bonding between the steel and the concrete surface. As a result, increasing the jacketing steel thickness increases the strength of the confined concrete. In the parametric analysis, the jacketing steel thickness is varied from 3 to 6 mm. It is observed from Figures 16 and 17 that the thicker jacketing steel ensures less strength reduction and increasing the jacket thickness from 3 to 6 mm pushes the later portions of the force-displacement curves in the upward direction, meaning that the base shear is increasing, and the strength loss is decreasing with the increase of the jacket thickness. For 30 MPa concrete strength and prestress force level R = 0.3, the test matrix of Table 10 shows that increasing the jacket thickness from 3 to 6 mm reduces the strength loss from 13.10% to 5.90%. The results conclude that the 6 mm jacket ensures the minimum amount of strength loss for the piers. This finding is also consistent with the experimental test result, where a 6 mm steel jacket enabled the piers to sustain lateral loading up to 6% drift level with a minimum strength loss.
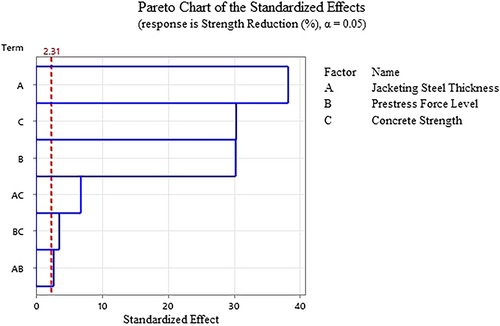
From the test matrix in Table 10, the highest strength loss is 18.84% for 30 MPa concrete, 0.3 prestress force level and 3 mm steel jacket and the lowest strength loss is 3.68% for the 50 MPa concrete and 6 mm jacket thickness at 0.3 prestress force level. From these observations and Figures 16 and 17, it can be concluded that high-strength concrete, a thicker steel jacket for the confinement and lower level of prestress ratio are needed to achieve the minimum level of strength reduction of the bridge pier. These conclusions can also be drawn from the surface plots (Figure 16) where the combined effects of the variables can be observed altogether. The effects of the various factors can also be quantified using the results of the regression analysis as described in the next section. Additionally, the importance of the design factors considered and their contribution to strength degradation can be understood by plotting a Pareto chart, shown in Figure 18. A Pareto chart can show the relative statistical significance of the considered design parameters. In the Pareto chart, the standardized effects of the considered variables are listed in descending order. There is a reference line marked with a red colored dash line in the chart. All the parameters and their interactions, which cross this reference line in the Pareto chart, are statistically significant in determining the desired response. In the present study, the strength degradation is determined from the independent variables—concrete strength, prestressing force and steel jacket properties. From the Pareto chart in Figure 18, it is evident that all the considered parameters as independent variables and the interactions among them are statistically significant at 95% confidence level. This is also obvious from the derived regression equation for the strength degradation of the pier, where all the parameters as well as their interactions, are considered for the calculation of the strength reduction. Again, the conclusion of the Pareto chart is similar to the results of the p-value analysis for the factors considered at 95% confidence level. In the p-value analysis, all the considered factors and their interactions have a value less than 0.05, signifying that all the considered parameters are statistically significant in determining the strength loss of the piers.
4.3 Three Factor Factorial Design for Low Aspect Ratio Pier
Like the high aspect ratio pier, a new test matrix has been formed for the low aspect ratio piers, considering the three significant factors at three levels. All the considered design parameters of low aspect piers are the same as the high aspect piers. The test matrix and the results for these piers are summarized the Table 11.
| Run no | Concrete strength (MPa) | Prestress force level | Jacketing steel thickness (mm) | Strength reduction (kN) | Max base shear (kN) | Min base shear (kN) | Strength reduction (%) |
|---|---|---|---|---|---|---|---|
| 1 | 30 | 3 | 0.30 | 2.70 | 301.507 | 298.810 | 0.89 |
| 2 | 40 | 3 | 0.30 | 0.00 | 327.030 | 327.030 | 0.00 |
| 3 | 50 | 3 | 0.30 | 0.00 | 347.110 | 347.116 | 0.00 |
| 4 | 30 | 0.45 | 0.30 | 13.27 | 352.447 | 339.173 | 3.77 |
| 5 | 40 | 0.45 | 0.30 | 6.33 | 378.496 | 372.165 | 1.67 |
| 6 | 50 | 0.45 | 0.30 | 2.37 | 402.219 | 399.845 | 0.59 |
| 7 | 30 | 6 | 0.30 | 25.64 | 396.764 | 371.122 | 6.46 |
| 8 | 40 | 6 | 0.30 | 17.36 | 431.250 | 413.887 | 4.03 |
| 9 | 50 | 6 | 0.30 | 11.33 | 457.339 | 446.007 | 2.48 |
| 10 | 30 | 3 | 4.5 | 0.00 | 321.603 | 321.603 | 0.00 |
| 11 | 40 | 3 | 4.5 | 0.00 | 343.172 | 343.172 | 0.00 |
| 12 | 50 | 3 | 4.5 | 0.00 | 360.940 | 360.940 | 0.00 |
| 13 | 30 | 0.45 | 4.5 | 5.32 | 372.216 | 366.901 | 1.43 |
| 14 | 40 | 0.45 | 4.5 | 1.59 | 397.410 | 395.824 | 0.40 |
| 15 | 50 | 0.45 | 4.5 | 0.00 | 417.975 | 417.975 | 0.00 |
| 16 | 30 | 6 | 4.5 | 16.37 | 423.431 | 407.057 | 3.87 |
| 17 | 40 | 6 | 4.5 | 9.32 | 451.096 | 441.775 | 2.07 |
| 18 | 50 | 6 | 4.5 | 4.85 | 474.199 | 469.351 | 1.02 |
| 19 | 30 | 3 | 0.60 | 0.00 | 337.260 | 337.260 | 0.00 |
| 20 | 40 | 3 | 0.60 | 0.00 | 355.705 | 355.705 | 0.00 |
| 21 | 50 | 3 | 0.60 | 0.00 | 370.499 | 370.499 | 0.00 |
| 22 | 30 | 0.45 | 0.60 | 1.38 | 389.540 | 388.161 | 0.35 |
| 23 | 40 | 0.45 | 0.60 | 0.00 | 412.926 | 412.926 | 0.00 |
| 24 | 50 | 0.45 | 0.60 | 0.00 | 418.401 | 418.401 | 0.00 |
| 25 | 30 | 6 | 0.60 | 8.82 | 443.259 | 434.442 | 1.99 |
| 26 | 40 | 6 | 0.60 | 4.60 | 468.011 | 463.415 | 0.98 |
| 27 | 50 | 6 | 0.60 | 1.14 | 489.710 | 488.574 | 0.23 |
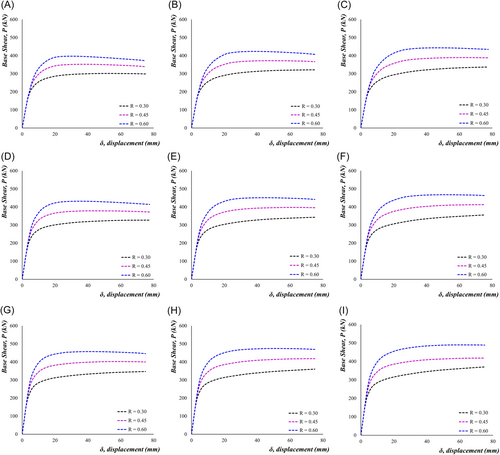
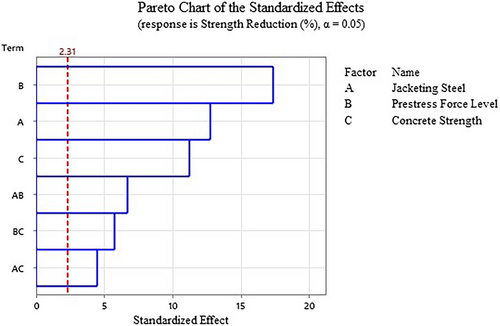
It is found from response surface plots (Figure 19) and the force-displacement curves (Figure 20) that the low aspect ratio piers have higher base shear than the high aspect ratio piers. The low H/D ratio of these piers introduces almost no slenderness effect on the bridge pier. As a result, the pier base shear has been found to be higher in these test specimens. Similar to the high aspect ratio columns, it is observed from Table 11 that the percentage of the strength reduction is always higher for the low-strength concrete. The low-strength concrete piers have a lower yield value for the base shear and the strength reduction is also higher for these piers and this is evident for both high and low aspect ratio piers. It is found from the analysis of the high aspect ratio pier that, the highest strength loss is 18.84% for 30 MPa concrete, 0.3 prestress force level and 3 mm steel jacket and the lowest strength loss is 3.68% for the 50 MPa concrete and 6 mm jacket thickness at 0.3 prestress force level. Similar results are obtained for the low aspect ratio pier. For the low aspect ratio piers, the highest strength loss is calculated as 6.46% for 30 MPa concrete, 0.3 prestress force level and 3 mm steel jacket. For 50 MPa concrete and 6 mm jacket thickness at 0.3 prestress force level, no strength loss is found in the low aspect ratio piers. The low aspect piers with high-strength concrete do not show any strength reduction at all. Additionally, no specimen of the low aspect ratio pier loses any strength at 0.3 prestress force level and with 6 mm jacket thickness, though the material strength is varied from 30 to 50 MPa. Hence, it can be concluded that for the low aspect ratio piers, with thicker steel jackets at the lower prestress ratio, the confinement itself is enough to provide good enough strength to the piers and prevent strength reductions. From these observations, it is clear that the low aspect ratio piers are less vulnerable to strength loss when the prestress force level is at a lower level. For minimizing the strength loss in the low aspect ratio piers, it is recommended to combine high strength concrete with a thicker steel jacket and lower prestress level, which is similar to the recommendation of high aspect piers. Moreover, to understand the importance of the considered design parameters in the low aspect bridge piers, a Pareto chart has been plotted following the similar approach of the high aspect ratios piers. Like the high aspect ratio piers, the Pareto chart shows that all the considered factors and their interaction are contributing to the lateral strength reduction of piers. The Pareto chart for the low aspect ratio piers is shown in Figure 21. The p-value analysis for the low aspect piers also concludes the same by showing that the p-values for all the considered parameters and their interactions are less than 0.05. It signifies that all the considered variables and their interactions in this study are statistically significant in determining the strength degradation of the low aspect self-centering bridge piers.

4.4 Regression Analysis
Using the results of the parametric study, a regression analysis has been conducted on the two types of piers. The main objective is to determine a regression equation for calculating the strength reduction of the piers with the considered variables of the factorial analysis at 4% drift level. Next, the regression analysis has been conducted to calculate the percentage contribution of the different variables in the strength reduction of the pier. Finally, an optimum configuration of the piers has been suggested using the analysis results to achieve the lowest strength reduction of the piers in the case of lateral loading. With the developed regression equations, design engineers can calculate the capacity loss due to lateral drift and select the best and optimized configuration.
4.4.1 Regression Analysis for the High Aspect Ratio Piers
Here, = steel jacket thickness in mm.
= prestress force level.
= concrete strength in MPa.
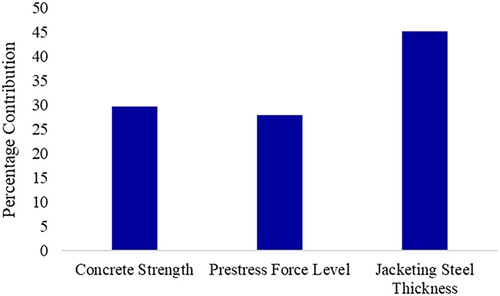
The calculated value of R2 is found to be 99.71% for the derived regression equation. The contribution of the different variables in the increase of the R2 shows the percentage contribution of the different independent variables in the strength reduction of the pier. The jacket thickness is the most contributing variable for determining the strength reduction of the high aspect ratio piers and has around 45% contribution in the pier strength degradation as shown in Figure 22. This result is also like the Pareto chart for high aspect ratio piers (Figure 18). In the Pareto chart, it is found that jacket thickness is the most contributing factor for the high aspect ratio piers and the other two design variables have similar importance in lateral strength loss.
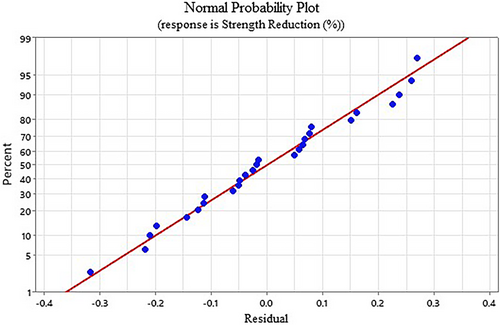
The R2 value of the derived equation suggests that the derived equation is a good fit for the analyzed data. Again, to understand the goodness of the fit of the derived regression equation for the high aspect ratio piers, the normal probability plot has been analyzed. The normal probability plot compares the residuals with their expected values, assuming a normal distribution of the variables. The normal probability plot in Figure 23 shows that the residuals of the analyzed data follow the normal distribution. From the graph (Figure 23), it can be seen that the residuals are normally distributed against the fitted value (shown by the red straight line). The normal probability plot proves the rationale of the found R2 value as well as the lower P-values of the considered independent variables in the parametric study.
4.4.2 Regression Analysis of Low Aspect Ratio Pier
Here, = steel jacket thickness in mm.
= prestress force level.
= concrete strength in MPa.
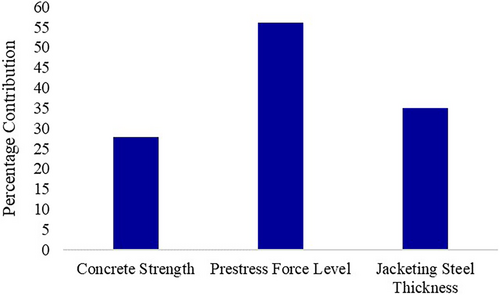
The calculated value of R2 is found as 98.72%. The contribution of the different variables in the increase of the R2 shows the percentage contribution of the different variables in the strength reduction of the pier. The prestress force level is found to be the most contributing variable for determining the strength reduction of the low aspect ratio piers and has around 56% contribution in the pier strength degradation as shown in Figure 24.
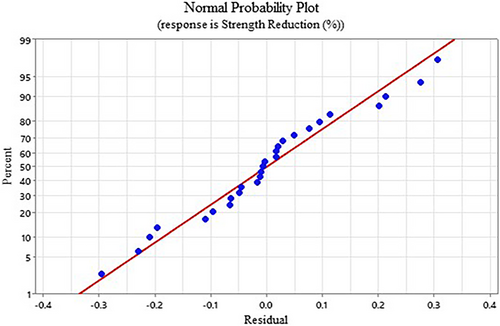
Like the high aspect piers, the R2 value of the low ratio piers is further verified by analyzing the normal probability plot. The normal probability plot helps to understand the goodness of fit of the regression equation. From Figure 25, it is clear that the residuals in the normal probability plot of the low aspect ratio piers also follow the normal distribution, like the high aspect ratio piers. It proves the acceptability of the regression equation and the found R2 value. Thus, it can be concluded that the derived regression equation for the low aspect ratio piers also reasonably fits well with the analyzed data.
4.5 Optimization of the Design Parameters to Minimize Strength Reduction
It is discussed in the previous sections that minimum strength loss is achieved when higher strength concrete is used in combination with the thicker jacket and lower prestress level for both types of piers. Considering these factors and using the developed regression equations, the optimum selection of the design parameters is found as 50 MPa concrete strength, 0.3 prestress level and 6 mm steel jacket for the high aspect ratio piers. Using these optimum design factors, the strength reduction from the FE model is found as 3.68%. For this particular configuration, the developed regression equations predict the strength reduction as 3.81%, which is similar to the FE based results. Thus, it can be concluded that the developed regression equations exhibit acceptable results with a little variation from the developed FE model. However, this summary is a little different for the low aspect ratio piers as achieving the lowest strength reduction is possible with its different configuration. The low aspect ratio piers do not lose any strength when the prestress force level is 0.3 and the confining jacket has 6 mm thickness. Hence, for the low aspect ratio piers, combining thicker steel jackets with the lower prestress force level, it is possible to achieve 0% loss for the lateral loading with different concrete strengths. In this case, the value of strength reduction is calculated for 0.3 prestress force level and 6 mm steel jacket with the concrete strength of 30, 40, and 50 MPa. The calculated strength loss in the FE model is the same as that found in the regression equation for low aspect piers, and it is found as 0% for all the cases. Hence, it is suggested that 30, 40, or 50 MPa strength of concrete, 0.3 prestress force level and 6 mm thickness of the confining steel optimizes strength loss for the low aspect ratio piers. The results obtained for the optimum configuration are summarized in Table 12.
| Test specimen | Strength reduction (%) | ||
|---|---|---|---|
| Predicted | FEM | Variation (%) | |
| High aspect ratio | 3.81 | 3.68 | 3.5 |
| Low aspect ratio | 0 | 0 | 0 |
It is found from the optimization study that the developed FE models provide good agreement with the results found from the regression analysis and are capable of calculating the strength reduction. Additionally, it is suggested to design the pier with minimum possible prestress level with the combination of high strength concrete for minimizing strength loss as well as damage of the piers due to seismic lateral loading.
5 Conclusions
- 1.
The strength reduction of the self-centering pier depends on the pier geometry. The low aspect ratio piers have negligible strength reduction compared to the high aspect ratio piers. The underlying reason is that the low aspect ratio piers do not have the slenderness effect on them during the lateral loading. As a result, they have higher base shear capacity and less capacity reduction in base shear due to the seismic lateral loading. The optimum configuration of the considered factors suggests that there is 3.68% strength loss in the high aspect ratio piers and no strength loss in the low aspect ratio piers.
- 2.
Though the optimum design parameters do not show any strength degradation of the low aspect ratio piers during an earthquake, however, it depends on other design parameters, design procedure and construction methodology. In reality, upon the completion of the construction and prestressing of the pier, there will be some loss of prestress with time due to relaxation. Additionally, during an earthquake, there will be some loss of prestress and some of the prestress will be dissipated by the rotation and the movement of the pier during the seismic loadings. Due to these reasons, there will be some loss in the base shear capacity of the self-centering piers even though all the design parameters are chosen at their optimum level. The design engineer should carefully consider all these matters while designing the self-centering pier. Additionally, self-centering capacity, overturning ratio and other significant properties of self-centering structures should also be considered.
- 3.
It is found that the longitudinal reinforcement has an insignificant effect on strength loss calculation. Concrete strength, prestress force, and jacket thickness are sensitive to strength reduction for both high and low aspect ratio self-centering piers. Longitudinal steel contributes less to the strength degradation of the piers due to the design and configuration of the self-centering piers. The longitudinal steels are not continued through precast segments of the self-centering piers. Consequently, they do not affect the global strength properties (such as base shear) of the self-centering pier much, like they affect the conventional monolithic piers.
- 4.
The minimized strength reduction is achieved in the combination of high strength concrete, lower prestress force level and thicker steel jacket. The minimum strength reduction for the high aspect ratio pier is 3.68% at 4% drift level, and it is achieved for 50 MPa concrete, 0.3 prestress force level, and 6 mm jacket thickness. For the low aspect ratio pier, there is no strength loss for the same material properties and prestressing force. Additionally, the low aspect ratio piers do not lose any strength when the prestress is 0.3 and the jacket thickness is 6 mm, while the concrete strength is varied from 30 to 50 MPa. The reason behind this is that the high-strength concrete becomes more strengthened by the additional hoop stresses provided by the thicker confining steel. When the prestress is low, the lateral loading does not make the pier segment reach its ultimate stress level as the concrete has higher capacity in the bottom section by the introduction of both high-strength concrete and more strengthened jacketed section.
- 5.
For the high aspect ratio piers, jacket thickness is found to be the most contributing factor in the pier strength loss from the factorial analysis and has around 45% contribution when the interaction among the factors is considered. For the low aspect ratio piers, the prestressing force level is found to be the most important factor in the strength degradation of the pier and has a contribution of 56%, considering the interactions among the factors. However, the prestress force level, concrete strength, and jacket thickness are found to be significant design parameters for both high and low aspect ratio self-centering piers in lateral strength degradation calculation. To achieve the seismic resilience of self-centering concrete bridges, the appropriate and optimum selection of these design variables is crucial as they significantly influence the lateral strength degradation of the bridge piers during a seismic event.
Nomenclature
-
-
- horizontal drift level
-
-
- horizontal deflection
-
-
- height of the pier
-
-
- diameter of the pier
-
-
- nominal thickness of jacketing steel
-
-
- compressive strength of concrete
-
-
- ultimate strength of steel
-
-
- yield strength of steel
-
-
- initial equi-biaxial compressive yield stress
-
-
- initial uniaxial compressive yield stress
-
-
- effective initial prestress of the pier in MPa
-
-
- ultimate strength of the tendon material in MPa
-
-
- coefficient of friction between concrete surfaces
-
-
- coefficient of friction between concrete and steel surfaces
-
-
- number of cycles
-
-
- ratio of effective initial prestress and ultimate strength of the tendon
-
-
- steel jacket thickness in mm
-
-
- prestress force level
-
-
- concrete strength in MPa
Author Contributions
Devabrata Dutta developed the methodology, analyzed the data, and prepared the original manuscript. Nazrul Islam supervised the research, provided guidance and recommendations. In addition, Nazrul Islam reviewed and corrected the paper.
Acknowledgments
This study has been carried out in the Department of Civil Engineering, Bangladesh University of Engineering and Technology (BUET), Dhaka. The authors gratefully acknowledge the support and facilities provided by BUET.
Conflicts of Interest
The authors declare no conflicts of interest.
Open Research
Data Availability Statement
The data that support the findings of this study are available on request from the corresponding author. The data are not publicly available due to privacy or ethical restrictions.


