Investigation of nonproportional damping characteristics of structure with energy dissipation system
Abstract
The spatial and traveling wave effects on a structure with an energy dissipation system can be conveniently considered using the random vibration method. In this study, the pseudo-excitation method is introduced to perform random spatial seismic response analysis of such a structure considering different damper arrangements. The analysis results show the effects of nonproportional damping characteristics due to these arrangements, and the nonproportional damping characteristic index can estimate the strength of these characteristics. Moreover, the virtual excitation method can be used to determine the weak parts of the structure. The effect of the traveling wave on the energy dissipation system and damping structure is relatively low. The response results of the structure in the case of multipoint consistent excitation obtained by the complex vibration decomposition reaction spectrum method are compared. The method accounts for the effects of nonproportional damping and vibration velocity. Accurate time history results can be obtained by complex vibration decomposition time history analysis.
1 INTRODUCTION
The traditional antivibration method applied to buildings and bridges can typically resist the damage caused by natural disasters, such as those caused by earthquakes, wind, snow, and tsunami. This resistance is developed by enhancing the antivibration performance of the structure in terms of strength, stiffness, and ductility. However, due to factors, such as frequency of natural disasters and uncertainty of their intensities, buildings and bridge structures designed according to the traditional earthquake resistance (vibration) methods cannot adjust and restore their original states after a disaster. This results in significant economic loss and severe harm. The energy dissipation and vibration damping technology has been successfully developed and is widely used in engineering. It uses damping characteristics to decelerate vibration and the principle of kinetic energy consumption to install “airbags” on engineering structures, considerably improving the structure's safety. When earthquakes or other external forces act, the installed viscous energy dissipation dampers can absorb and consume the impact energy on the engineering structure to a certain extent, thus reducing damage.
The principle of energy dissipation and vibration damping technology involves arranging specific additional energy dissipation damping elements in the structure. The energy input from ground vibration to the structure is directed to the energy dissipating damping element to absorb part of the energy and thus reduce the degree of damage. Energy dissipation devices have various forms; among these, energy dissipation support combined with dampers is an effective method for damping structural vibrations in high-rise buildings. Viscous dampers may have different structural arrangements depending on their response to earthquake action. In general, the principle involved in damper arrangement is to allow floors to sustain relatively large displacements. For structures that sustain torsional effects, anti-torsion dampers must be installed asymmetrically according to the torsional action on the structure.
Viscous dampers are considerably effective devices for passively controlling earthquake resistance. Under the action of wind and small earthquakes, these devices can increase structural damping and reduce the lateral displacement of the structure. Under a large earthquake, the dampers can increase damping and reduce the horizontal seismic action on the structure. A considerable amount of seismic energy inputted into the structure is also consumed. This greatly attenuates the seismic response of the engineering structure, thus ensuring its safety.
Many local and international scholars have performed numerous related theoretical analyses and studies on the damped characteristics of nonproportionally damped structural systems. In previous research, many scholars suggested using the decoupling transformation of free and forced motions for nonproportionally damped systems.1, 2 Within a certain range, this transformation can satisfy the requirements of engineering structure design. Subsequently, a pseudo-force method suitable for the dynamic time history analysis of nonproportionally damped structural systems was proposed.3 However, this method is only effective for structural systems with a few energy dissipating and damping devices. Moreover, the damping of the structural system depends on the interaction between the damper and damped structure.4 When the damper fully interacts with the entire structure, the total damping ratio of the first-order model (intrinsic plus supplementary) is approximately 20%, and the system response is optimal.5 Numerous studies have been implemented on nonproportionally damped structural systems. Based on the improved matrix perturbation method for solving the complex modal eigenvalues and eigenvectors of nonproportional damping structural systems,6-8 meaningful complex structures have been derived.9 The mode shapes and phases and the eigenvalues and eigenvectors of the nonproportionally damped linear elastic structure10, 11 have been studied and compared with the approximate error range of the forced decoupling method.12 The nonproportionally damped system is divided into energy dissipation and conversion parts, and the pseudo-force method is used for structural analysis. Two indices, coupling and convergence, are given.13, 14 This special nonproportionally damped structural system is investigated,15, 16 and the real mode decomposition method and Laplace transformation are combined. Furthermore, some simplifications are introduced to establish a system suitable for any structure with multiple degrees of freedom (DOF). In the study of the time-domain dynamic response of nonproportionally damped structural systems, a numerical analysis algorithm is developed to calculate the time-domain dynamic response of these structural systems with any DOF. By establishing the relationship between damped and undamped frequencies in modal analysis,17 the calculation of damped frequency is transformed into solving the problem of damping ratio and undamped frequency. It is combined with the random vibration theory and response spectrum complete square junction. The complete quadratic combination (CQC) method proposes the complex CQC (CCQC)18-24 and complex partial quadratic combination formulas25 in real form. The combination is also extended to complex multidimensional seismic inputs. The CCQC formula,26 which avoids using complex expressions, is suitable for engineering practice. Different energy dissipation and vibration damping devices are set up in the hybrid and X-shaped structures.27, 28 Further, the required nonlinear damping characteristics are designed through an optimal control of the damper29 to reduce the seismic response and improve the damping characteristics of the structure30 on shock effect. When excited by ground motions dominated by high frequencies, the rate-independent model produces lower damping forces than the linear viscous damped model.31 Moreover, the nonlinear function of equivalent damping is high in the resonance region but extremely low in other frequency ranges.
The foregoing studies have investigated the theory of nonproportionally damped systems and the use of energy dissipation and vibration damping devices. Applying the traditional mode decomposition response spectrum method (i.e., CQC) to damped structures ignores the forced decoupling of nondiagonal elements of the modal damping matrix in the dynamic analysis. Consequently, considerable errors affecting the safety of the structure are generated. Furthermore, the method is inconvenient for engineering applications. The three-dimensional structural system was simplified to a two-dimensional multi-DOF structural system. Then, the CCQC theory was applied to the analysis of the seismic action of the two-dimensional structure; however, the influence of the torsional coupling of the structure was not considered. The comprehensive examination of the three-dimensional spatial effect on the structure and the influence of the traveling seismic wave on the time history analysis were not considered. In this study, the nonproportional damping of a three-dimensional multi-DOF structure with energy dissipation systems is investigated, and the CCQC response spectrum method is applied to a nonproportionally damped structural system. The spatial effect on the three-dimensional structure and the influence of traveling seismic wave on the time history analysis are considered. Subsequently, direct integration is implemented. By comparing the methods, the error generated by force decoupling using the CQC response spectrum method is resolved.
2 COMPLEX MODE ANALYSIS METHOD FOR DAMPED STRUCTURES
2.1 Compound mode superposition method
The damping matrix of the energy dissipating damping system can be expressed as . In the foregoing, is the damping matrix of the main structure, and is the equivalent damping matrix of the additional energy dissipating devices.
In the foregoing, and represent the eigenvector matrix and generalized coordinate vector, respectively.
In the foregoing expression, and represent the mode shape mass participation coefficients. The orthogonality of matrix determines the eigenvectors, and (specifically, and ).
2.2 Mass participation coefficient of complex mode in modal analysis
These equations reflect the contribution of the mode shape to the total response of the structure derived directly from state and mode shape spaces, which are fundamentally the same.
However, the effective mass of the complex vibration type, which relates to the complex vibration type, , can be positive or negative. This indicates that the cumulative effective mass of the complex vibration type eventually tends to the total mass of the structure.
Generally, the mass participation coefficient, , of the structural mode shape can be considered as 90% or more. Because the cumulative sum of the mass participation coefficient, , of the structure is not monotonic, the recommended m value satisfies Equation (21). The cumulative sum must be stable according to the required number of mode shapes.
2.3 Fundamental equation of motion of CCQC mode superposition method
3 CCQC MODE SHAPE COMBINATIONS
When the structure only considers the contribution of the first n-order mode shapes, the CCQC mode combination method in which the nonclassically damped system includes the influence of high-order mode shapes degenerates into the traditional seismic analysis response CCQC method. Compared with the classical mode shape decomposition response spectrum CQC method, damping is nonproportional using the CCQC mode combination method. Moreover, the method contains displacement and velocity terms. These two mode-shape combination methods are based on the assumption that the ground motion is a stationary Gaussian random process.
4 MECHANICAL PROPERTIES OF FLUID DAMPERS
Fluid viscous dampers operate according to the principle of flow of viscous fluid through an orifice. Originally, these devices were developed for military use. Subsequently, they were employed for various applications, such as energy-absorbing buffers in steel mills, canal lock buffers, offshore oil suspension, and in-shock and vibration isolation. For some of these applications, inputs are severe, with peak velocity and acceleration reaching 5 m/s and 200 g (with an extremely short rise time in the order of a few milliseconds), respectively. Some notable examples of military applications are launch gantry dampers for the U.S. Navy with a force output of up to 8900 kN and a travel distance of 5 m; seismic dampers in nuclear power plants with a force output of 1335–4450 kN; payload dampers for space shuttle; wind dampers for the Atlas and Saturn-V rockets; and dampers for most tactical and strategic missiles of the U.S. Armed Forces.
Recently, these devices have been utilized in numerous buildings as elements of a seismic isolation system or as wind or seismic energy-absorbing elements throughout the height of the building.
The damping force is generated by the pressure differential across the piston head. The assumption is that the piston moves toward the right; this causes fluid to flow from chamber 2 to chamber 1, creating a pressure differential between the two chambers. However, another phenomenon also occurs: a volume equal to the product of the piston rod area and piston movement is forced into the cylinder. Because the fluid is compressible, the decrease in volume is the same as the foregoing; consequently, a restoring (stiffness) force develops. This phenomenon can be prevented by using an accumulator or implementing a run-through rod design strategy for the dampers. In the tested dampers, an accumulator was used to prevent the occurrence of fluid compression. For low-frequency motions (i.e., below a certain cut-off frequency specified in the accumulator design), the accumulator valve can effectively operate and prevent fluid compression. However, for high-frequency motions (above the cut-off frequency), the accumulator valve cannot function properly, and the dampers develop a restoring force.
The existence of this restoring force for frequencies higher than the cut-off frequency seems desirable. The dampers can provide further viscous damping to the fundamental mode of the structure (typically with a frequency lower than the cut-off frequency). Furthermore, they can provide additional damping and stiffness to the higher modes. This typically results in the suppression of the contribution of higher modes to the structural response.

5 ARRANGEMENT AND PARAMETER OPTIMIZATION OF DAMPERS FOR NONPROPORTIONALLY DAMPED SYSTEMS
5.1 Nonproportional damping characteristic index
For nonproportionally damped linear structural systems, the real vibration superposition method is commonly used for approximation in practical projects because of its advantages, such as its ease of use in calculations. However, the generalized damping matrix in nonproportionally damped linear systems does not satisfy the diagonal matrix condition. The real vibration superposition method ignores all nonzero nondiagonal elements () in its generalized damping matrix. Consequently, is replaced by the diagonal matrix, inevitably introducing computational errors. For a system with strong nonproportional damping characteristics, considerable errors are caused by calculations using the real vibration superposition method.
5.2 Traveling wave effect
5.3 Complex modal analysis of nonproportionally damped structural systems
By referring to ABAQUS finite element data,37-39 a three-dimensional shear frame vibration-damping finite element model (Figure 2) is established. The base period for structural design is 50 years; the structural seismic fortification category is key fortification (B); the degree of seismic fortification intensity in this area is 8 (0.20 g); and the site classification is Category II. The seismic design is grouped into the first group; the structural key (i.e., the safety level of components including vertical components) is Class II; the characteristic period is 0.35 s; the damping ratio is 0.18; the ground roughness is Class C; and the basic wind pressure is 0.5 kN/m2. The structure has 13 floors with a total height of 39.6 m, dead load of 5.0 kN/m2, and live load of 2.5 kN/m2. The dimensions of frame and secondary beams are 400 × 800 mm and 250 × 600 mm, respectively. The frame columns are 1350 × 1450 mm, 1250 × 1300 mm, and 800 × 1000 mm; the floor thickness is 120 mm. The damper parameters are summarized in Table 1.
| Damper design damping force (kN) | Design displacement (mm) | Damping factor (kN)(s/mm)α | Damping index | ||
|---|---|---|---|---|---|
| Lower limit | Upper limit | Lower limit | Upper limit | 400 | 0.30 |
| 1200 | 1500 | 30 | 60 | ||
- α The speed index, which is designed and selected according to engineering requirements, and generally takes a value between 0.01 and 1. When = 1, it is linear damping.
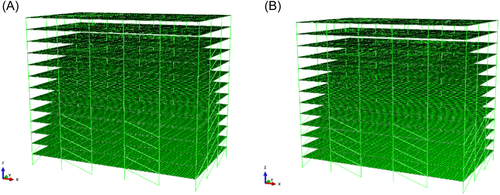
In the V program, the dampers are arranged symmetrically in 2–4 spans in 1–4 floors in the X direction of the structure, the dampers are arranged symmetrically in 1–2 floors in the Y direction, and the dampers are arranged symmetrically in 2 spans in the 3–11 floors. In the P program, the dampers are arranged symmetrically in 2–4 spans in the 1-4 floors in the X direction of the structure, and the dampers are arranged symmetrically in the 1–4 floors in the Y direction (Table 2).
| Damper arrangement method | Number of dampers | Layout floor | ||
|---|---|---|---|---|
| X | Y | X | Y | |
| Planar symmetrical arrangement, P-X | 20 | 1–5 floors; 2-span and 4-span arrangements | – | |
| Planar symmetrical arrangement, P-Y | – | 20 | – | Full-span arrangement; 1–5 floors |
| Vertical symmetrical arrangement, V-X | 20 | – | 1–5 floors; 2-span and 4-span arrangements | – |
| Vertical symmetrical arrangement, V-Y | – | 20 | – | 1–2 full-span arrangement; 3–9 floors with mid-span arrangement |
Through calculation and analysis, the vibration modes of the structure are found to be X-direction translation, Y-direction translation, and Z torsion (Figures 3-8).
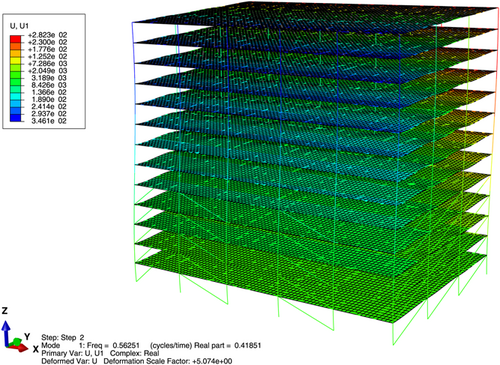
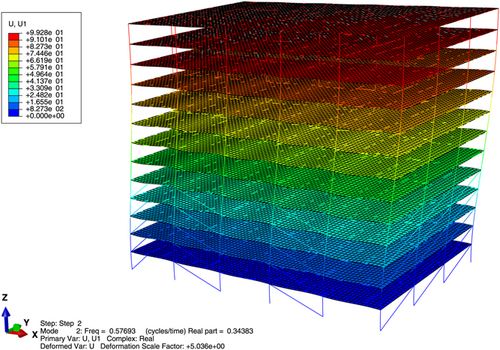
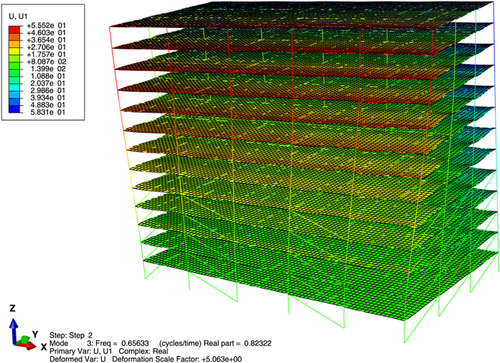
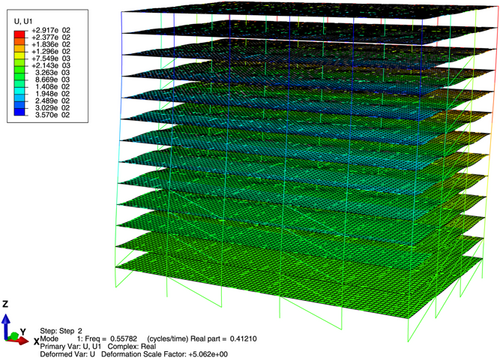
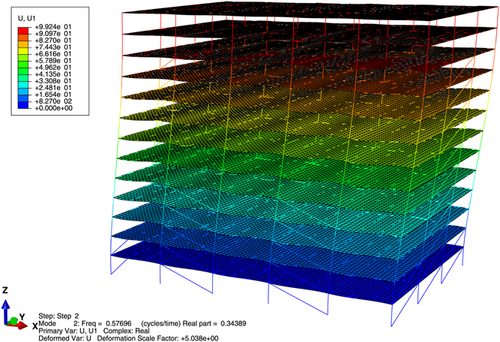
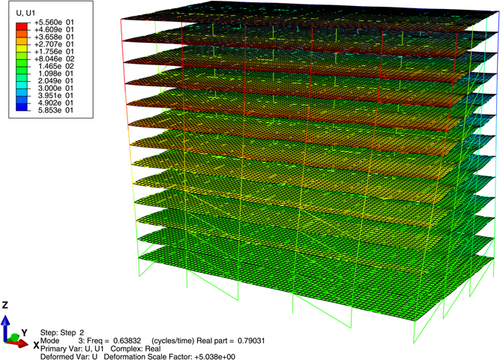
The complex mode shapes of the nonclassically damped elastoplastic shear frame are plotted in Figures 3-5. The shapes indicate the effect of structural nonlinearity considering design earthquakes and when strength reduction is insufficient to force the structure into the nonlinear range of the earthquake. The real part of the nonproportionally damped system represents the effect of energy dissipation, and the imaginary component represents the influence of energy conversion. In the case of a yielding system, softly and heavily damped equivalent modal oscillations are identified. High values of the real part of the eigenvalue lead to high frequencies due to nonlinear and hysteretic behavior, reflecting the improvement in the energy dissipation mechanism. The comparison shows that the damped trend of modal vibration has been amplified, and the value is higher than the corresponding pre-yield value (Table 3).
| Mode shape | Eigenvalues | Circular frequency (rad/s) | Frequency (Hz) | Damping ratio |
|---|---|---|---|---|
| Undamped linear elastic structure | ||||
| 1st mode | 3.16i | 3.16 | 0.50 | 0 |
| 2nd mode | 3.29i | 3.29 | 0.52 | 0 |
| 3rd mode | 3.77i | 3.77 | 0.60 | 0 |
| Nonclassically damped pre-yield structure (linear range) | ||||
| 1st mode | −0.25 + 3.52i | 3.53 | 0.56 | 0.14 |
| 2nd mode | −0.18 + 3.64i | 3.64 | 0.58 | 0.10 |
| 3rd mode | −0.62 + 4.04i | 4.09 | 0.65 | 0.31 |
| Nonclassically damped yield structure (nonlinear range) | ||||
| 1st mode | −0.41 + 3.50i | 3.50 | 0.56 | 0.23 |
| 2nd mode | −0.34 + 3.63i | 3.63 | 0.58 | 0.19 |
| 3rd mode | −0.79 + 4.01i | 4.01 | 0.64 | 0.39 |
In the special case of an undamped linear system, all eigenvalues appear in complete imaginary complex pairs (Table 3), whereas the associated eigenvectors are real values, that is, = 0 and . In this study, the eigenvectors are normalized such that the real part of the displacement of a layer is uniform, and the corresponding imaginary number is zero. The study further proves that regardless of whether the damping method is classical or nonclassical, the natural frequency of the highest-order mode shape of the damped system is consistently less than or equal to the corresponding undamped frequency. For linear elastic multi-DOF structural systems, the pseudo-undamped natural frequency of the lowest mode may be equal to or even higher than the corresponding undamped natural frequency.
Note that the quasi-undamped natural frequency has an increasing order. Accordingly, forced vibration modal properties can be used with properly defined linear response spectrum () ordinate readings.
5.4 Comparison of response spectra and time history analysis
Seven seismic waves were calculated using the Chinese seismic design code for time course analysis. Two artificial waves and five natural waves (Figure 9) are used to analyze the elastic time history of a multi-DOF vibration damping structure. Subsequently, the analysis results are compared with those of the CCQC and CQC.
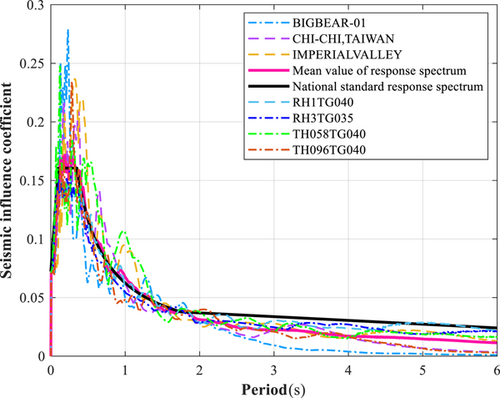
The dynamic elastic time history analysis of the structure is implemented. The ground acceleration time history curve of ground motion is selected from the actual recorded time history curve of the seismic wave database (Tg = 0.35–0.45 s according to the seismic code of China for Class II sites). At the time history point, the difference does not exceed 20%. Note that the calculated shear force at the bottom of the structure, as indicated by the time history curve, must not be less than 65% and not more than 135% of the result calculated by the CQC method. The average value of the shear force at the bottom of the structure given by multiple time history curves must not be less than 80% and not more than 120% of the calculation results of the CQC method.40, 41 The calculation results show that two artificial and five natural waves have been selected. Moreover, dynamic elastic–plastic analyses of the three-way seismic wave input and three-way input peak value are implemented. To analyze the structure, the ratios must be X:Y:Z = 1:0.85:0.65 and Y:X:Z = 0.85:1:0.65. The main direction wave peak value is 220 Gal, and the wave duration is 40 s.
In the following tables, GM1, GM2, GM3, GM4, GM5, GM6, and GM7 denote CHI-CHI (TAIWAN), BIGBEAR-01, RH1TG040, RH3TG035, TH096TG040, TH058TG040, and IMPERIAL VALLEY seismic waves, respectively.
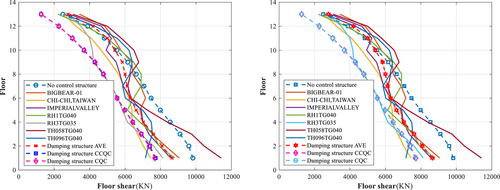
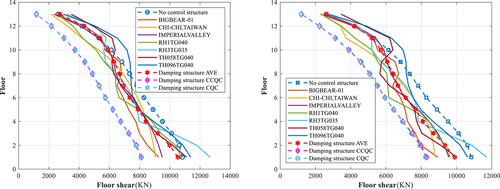
When the dampers (P-X, Y) are arranged in a plane, the spectral analysis of the structure shows the following (Figures 10, 11). The ratios of the base shear force in the X direction obtained by the uncontrolled structure CQC, controlled structure time history, and controlled structure CQC methods to the base shear force obtained by the controlled structure CCQC method are 1.27, 1.12, and 0.99, respectively; the ratios in the Y direction are 1.34, 1.30, and 1.00, respectively. When the dampers are arranged vertically, the ratios of the base shear force in the X direction obtained by the uncontrolled structure CQC, controlled structure time history, and controlled structure CQC methods to the base shear force obtained by the controlled structure CCQC method are 1.27, 1.12, and 0.99, respectively; the ratios in the Y direction are 1.30, 1.19, and 0.99, respectively (Table 4).
| Direction | Analysis of working conditions | Base shear | ||||||||||
|---|---|---|---|---|---|---|---|---|---|---|---|---|
| No. of control structure CQC | GM1 | GM2 | GM3 | GM4 | GM5 | GM6 | GM7 | AVE | CCQC | CQC | ||
| P-X | Ratio of spectral analysis results to CCQC | 9825 | 9056 | 7440 | 8578 | 8791 | 8128 | 11 420 | 7151 | 8652 | 7720 | 7675 |
| 1.27 | 1.17 | 0.96 | 1.11 | 1.14 | 1.05 | 1.48 | 0.93 | 1.12 | 1.00 | 0.99 | ||
| V-X | Ratio of spectral analysis results to CCQC | 9825 | 9058 | 7440 | 8576 | 8794 | 8130 | 11 419 | 7151 | 8653 | 7720 | 7675 |
| 1.27 | 1.17 | 0.96 | 1.11 | 1.14 | 1.05 | 1.48 | 0.93 | 1.12 | 1.00 | 0.99 | ||
| P-Y | Ratio of spectral analysis results to CCQC | 10 838 | 9263 | 9060 | 9505 | 10 770 | 12 663 | 11 106 | 11 381 | 10 536 | 8117 | 8076 |
| 1.34 | 1.14 | 1.12 | 1.17 | 1.33 | 1.56 | 1.37 | 1.40 | 1.30 | 1.00 | 1.00 | ||
| V-Y | Ratio of spectral analysis results to CCQC | 10 838 | 8939 | 8787 | 9568 | 9638 | 11 713 | 10 002 | 10 629 | 9896 | 8307 | 8241 |
| 1.30 | 1.08 | 1.06 | 1.15 | 1.16 | 1.41 | 1.20 | 1.28 | 1.19 | 1.00 | 0.99 | ||
- Note: The values in bold are the mechanical indexes calculated by the average value of time history analysis method (GM1-GM7) of uncontrolled structure and controlled structure, CCQC method and CQC method, in order to highlight the numerical comparison.
- Abbreviations: AVE, average value of mechanical indexes of GM1-GM7; CQC, complete quadratic combination; CCQC, complex CQC.
The spectral analysis of the structure shows that when the dampers (P-X, Y) are arranged in a plane, the ratios of the basement overturning moment in the X direction obtained by the uncontrolled structure CQC, controlled structure time history, and controlled structure CQC methods to the basement overturning (Figures 12 and 13) bending moment obtained by the controlled structure CCQC method are 1.33, 1.08, and 1.00, respectively; the ratios in the Y direction are 1.21, 1.00, and 1.00, respectively. When the damper is arranged vertically, the ratios of the basement overturning moment in the X direction obtained by the uncontrolled structure CQC, controlled structure time history, and controlled structure CQC methods to the basement overturning bending moment of the controlled structure CCQC method are 1.33, 1.08, and 1.00, respectively; the ratios in the Y direction are 1.14, 1.00, and 1.00, respectively (Table 5).
| Direction | Analysis of working conditions | Base bending moment | ||||||||||
|---|---|---|---|---|---|---|---|---|---|---|---|---|
| No of control structure CQC | GM1 | GM2 | GM3 | GM4 | GM5 | GM6 | GM7 | AVE | CCQC | CQC | ||
| P-X | Ratio of spectral analysis results to CCQC | 258 081 | 215 249 | 214 219 | 2r13 478 | 218 885 | 185 075 | 204 922 | 209 571 | 208 771 | 193 654 | 193 578 |
| 1.33 | 1.11 | 1.11 | 1.10 | 1.13 | 0.96 | 1.06 | 1.08 | 1.08 | 1.00 | 1.00 | ||
| V-X | Ratio of spectral analysis results to CCQC | 258 081 | 215 261 | 214 235 | 213 528 | 218 864 | 185 129 | 204 917 | 209 572 | 208 787 | 193 658 | 193 582 |
| 1.33 | 1.11 | 1.11 | 1.10 | 1.13 | 0.96 | 1.06 | 1.08 | 1.08 | 1.00 | 1.00 | ||
| P-Y | Ratio of spectral analysis results to CCQC | 288 166 | 229 996 | 274 728 | 256 972 | 224 294 | 249 285 | 208 551 | 254 795 | 242 660 | 201 321 | 201 253 |
| 1.43 | 1.14 | 1.36 | 1.28 | 1.11 | 1.24 | 1.04 | 1.27 | 1.21 | 1.00 | 1.00 | ||
| V-Y | Ratio of spectral analysis results to CCQC | 288 166 | 222 103 | 260 364 | 253 184 | 212 866 | 248 331 | 205 091 | 263 779 | 237 960 | 208 800 | 208 630 |
| 1.43 | 1.06 | 1.25 | 1.21 | 1.02 | 1.19 | 0.98 | 1.26 | 1.14 | 1.00 | 1.00 | ||
- Note: The values in bold are the mechanical indexes calculated by the average value of time history analysis method (GM1-GM7) of uncontrolled structure and controlled structure, CCQC method and CQC method, in order to highlight the numerical comparison.
- Abbreviations: AVE, average value of mechanical indexes of GM1-GM7; CQC, complete quadratic combination; CCQC, complex CQC.
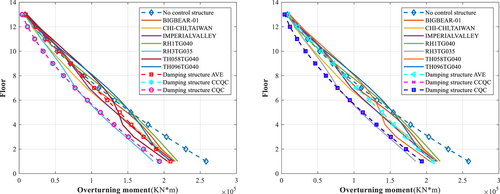
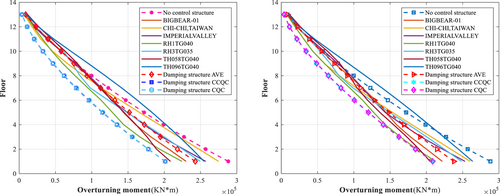
Comparing the seismic responses of the controlled and uncontrolled structures indicates that the arrangement of dampers can effectively reduce the seismic response. The base shear force and overturning bending moment of a regular multilayer energy-dissipating and shock-absorbing frame structure calculated by the CCQC and CQC methods are highly consistent. The results show that the forced decoupling method has an insignificant influence on the mechanical performance index obtained by the CQC response spectrum method to analyze the seismic performance of weakly damped structures. The time history analysis and response spectrum methods yield considerable errors. When the response spectrum method is applied to actual engineering design, time history analysis must be implemented. Moreover, by modifying the position of the damper in the Y direction, the energy dissipation and vibration damping of the vertically arranged dampers (V-X, Y) are better than those of the dampers arranged in a plane (P-X, Y).
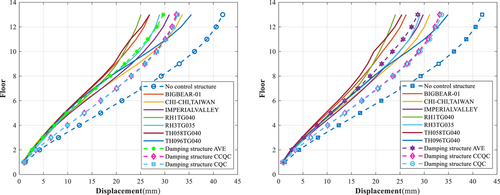
The analysis results show that when the dampers are arranged in a plane, the maximum displacements (Figures 14 and 15) in the X direction of the structure obtained by the uncontrolled structure CQC, controlled structure time history, controlled structure CCQC, and controlled structure CQC methods are 45.960, 34.153, 41.650, and 41.980 mm, respectively; in the Y direction, the maximum displacements are 41.930, 29.677, 32.380, and 32.640 mm, respectively. When the dampers are arranged vertically, the maximum displacements in the X direction of the structure obtained by the uncontrolled structure CQC, controlled structure time history, controlled structure CCQC, and controlled structure CQC methods are 45.960, 29.677, 32.380, and 32.640 mm, respectively; in the Y direction, the maximum displacements are 41.930, 28.667, 33.180, and 33.560 mm, respectively (Table 6).
| Direction | Structural floor displacement | ||||||||||
|---|---|---|---|---|---|---|---|---|---|---|---|
| No of control structure CQC | GM1 | GM2 | GM3 | GM4 | GM5 | GM6 | GM7 | AVE | CCQC | CQC | |
| P-X | 45.960 | 35.800 | 33.860 | 34.830 | 37.710 | 28.860 | 31.580 | 36.430 | 34.153 | 41.650 | 41.980 |
| V-X | 45.960 | 35.830 | 33.970 | 34.460 | 37.730 | 28.810 | 31.590 | 36.330 | 34.103 | 41.650 | 41.980 |
| P-Y | 41.930 | 26.840 | 33.620 | 30.920 | 25.090 | 28.930 | 26.880 | 35.460 | 29.677 | 32.380 | 32.640 |
| V-Y | 41.930 | 26.280 | 31.130 | 29.790 | 24.060 | 29.120 | 25.390 | 34.900 | 28.667 | 33.180 | 33.560 |
- Note: The values in bold are the mechanical indexes calculated by the average value of time history analysis method (GM1-GM7) of uncontrolled structure and controlled structure, CCQC method and CQC method, in order to highlight the numerical comparison.
- Abbreviations: AVE, average value of mechanical indexes of GM1-GM7; CQC, complete quadratic combination; CCQC, complex CQC.

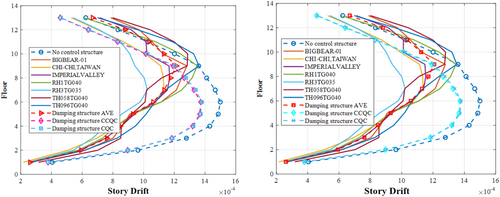
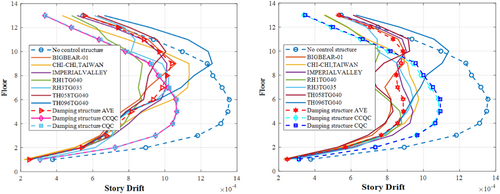
The analysis results show that when the dampers are arranged in a plane, the maximum drifts (Figures 16 and 17) of the structure in the X direction obtained by the uncontrolled structure CQ, controlled structure time history, controlled structure CCQC, and controlled structure CQC methods are 1/667, 1/824, 1/729, and 1/725, respectively; in the Y direction, the maximum drifts are 1/737, 1/963, 1/939, and 1/935, respectively. When the dampers are arranged vertically, the maximum drifts in the X direction of the structure obtained by the uncontrolled structure CQC, controlled structure time history, controlled structure CCQC, and controlled structure CQC methods are 1/667, 1/828, 1/729, and 1/725, respectively; in the Y direction, the maximum drifts are 1/737, 1/1124, 1/921, and 1/914, respectively (Table 7). The dampers absorb seismic energy, constrain the displacement and deformation of the structure, and reduce the structure's seismic response.
| Direction | Structural floor drift | ||||||||||
|---|---|---|---|---|---|---|---|---|---|---|---|
| No of control structure CQC | GM1 | GM2 | GM3 | GM4 | GM5 | GM6 | GM7 | AVE | CCQC | CQC | |
| P-X | 1/667 | 1/780 | 1/883 | 1/855 | 1/741 | 1/976 | 1/777 | 1/735 | 1/824 | 1/729 | 1/725 |
| V-X | 667 | 1/782 | 1/880 | 1/867 | 1/743 | 1/979 | 1/781 | 1/740 | 1/828 | 1/729 | 1/725 |
| P-Y | 1/737 | 1/942 | 1/881 | 1/989 | 1/1143 | 1/978 | 1/995 | 1/792 | 1/963 | 1/939 | 1/935 |
| V-Y | 1/737 | 1/1119 | 1/1027 | 1/1062 | 1/1136 | 1/1060 | 1/1082 | 1/877 | 1/1124 | 1/921 | 1/914 |
- Note: The values in bold are the mechanical indexes calculated by the average value of time history analysis method (GM1-GM7) of uncontrolled structure and controlled structure, CCQC method and CQC method, in order to highlight the numerical comparison.
- Abbreviations: AVE, average value of mechanical indexes of GM1-GM7; CQC, complete quadratic combination; CCQC, complex CQC.
The nonproportional damping characteristics of the structure are described by the nonproportional damping characteristic index. For the P and V programs, the nonproportional damping characteristic index () values are 0.3915 and 0.3316, respectively. This indicates that the energy dissipation and damping of the structure are nonproportional with respect to the arrangement of dampers in the P and V programs.
For the energy dissipation and vibration damping structure system, the base shear force and displacement of the structure calculated by the CCQC and CQC response spectrum methods are the same. The errors caused by ignoring the nondiagonal elements in the damped matrix using the traditional CQC response spectrum forced decoupling method are found to have an inconsequential effect on the structure. The results of the elastic time history supplementary analysis method exceed those of the CCQC and CQC response spectrum methods. The response spectrum method does not ignore the irregularity of the structure (irregular load distribution and structure layout) and traveling wave effect. The time history analysis method compensates for the deficiency of the static response spectrum method, further verifying that the elastic time history supplementary calculation is required for the structure. As an approximation technique, the forced decoupling method is valuable because it only involves a small amount of decoupling calculation. Moreover, a sufficiently accurate solution can be obtained when the degree of nonproportional damping is low.
The list in Table 8 indicates that the vibration response and additional damping ratio of the structure improve; the range of improvement is 4.17%–26.83% with an average of 12.83%.
| iWave | iDir | P-ΣWcj | P-WS | V-ΣWcj | V-WS | V-ζa (%) | P-ζa (%) | Δζ/P-ζa (%) |
|---|---|---|---|---|---|---|---|---|
| 1 | 1 | 63,598 | 127,385 | 68,425 | 127,408 | 4.3 | 4 | 7.50 |
| 1 | 2 | 43,161 | 101,481 | 51,550 | 94,752 | 4.3 | 3.4 | 26.47 |
| 2 | 1 | 104,517 | 95,098 | 115,542 | 95,572 | 9.6 | 8.7 | 10.34 |
| 2 | 2 | 110,791 | 109,738 | 118,140 | 101,630 | 9.3 | 8 | 16.25 |
| 3 | 1 | 63,836 | 110,138 | 66,985 | 110,471 | 4.8 | 4.6 | 4.35 |
| 3 | 2 | 73,417 | 109,715 | 79,879 | 109,861 | 5.8 | 5.3 | 9.43 |
| 4 | 1 | 74,078 | 121,478 | 81,484 | 121,460 | 5.3 | 4.9 | 8.16 |
| 4 | 2 | 63,517 | 95,652 | 66,730 | 88,835 | 6 | 5.3 | 13.21 |
| 5 | 1 | 123,217 | 80,227 | 134,245 | 80,386 | 13.3 | 12.2 | 9.02 |
| 5 | 2 | 134,013 | 116,083 | 144,594 | 108,846 | 10.6 | 9.2 | 15.22 |
| 6 | 1 | 42,018 | 138,252 | 43,216 | 138,170 | 2.5 | 2.4 | 4.17 |
| 6 | 2 | 34,659 | 110,522 | 38,438 | 98,352 | 3.1 | 2.5 | 24.00 |
| 7 | 1 | 66,512 | 123,950 | 70,364 | 123,956 | 4.5 | 4.3 | 4.65 |
| 7 | 2 | 68,760 | 134,641 | 84,425 | 129,022 | 5.2 | 4.1 | 26.83 |
When dampers are arranged in the structure, the velocity-type energy dissipator can play an improved role in energy dissipation and vibration damping in the location with a fast velocity response.
When the same number of velocity energy dissipators are arranged in the same structure, the hysteresis curve corresponding to the vertical arrangement of dampers is full (Figures 18 and 19); the output force and stroke of the dampers are considerable, and the hysteretic energy consumption is sufficient.
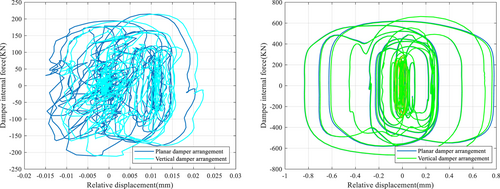
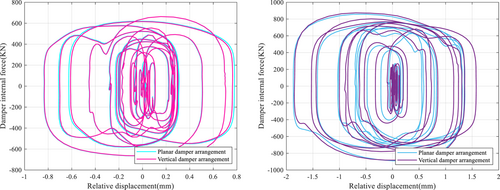
To achieve improved energy dissipation and vibration damping, uniform, symmetrical, and vertical arrangements of velocity energy dissipators in the structure are preferred.
6 CONCLUSIONS
Using structural multidimensional seismic and flat-torsion coupled seismic response analyses with virtual excitation method determines the weak positions of the middle and upper parts of the structure. Moreover, energy dissipation and seismic reduction are affected by the traveling wave effect to a relatively low degree.
The nonproportional damping characteristics of the system can be determined by the nonproportional damping characteristic index based on the different arrangement of dampers. The nonproportional damping characteristic index () values are 0.3915 and 0.3316 for the P and V programs, respectively; both are weakly nonproportionally damped systems. Through analysis and comparison, the calculation accuracy of the complex vibration type superposition method (CCQC) for nonproportionally damped structures is higher than that of the actual vibration type decomposition response spectrum method (CQC). When the energy-dissipating components are evenly distributed in the structure, and the damping ratio does not exceed 0.20, the effective damping ratio introduced by these components to the structure can also be determined by the forced decoupling method. The forced decoupling method ignores the damping term of the off-diagonal matrix. Most errors between the forced decoupling and exact solution can be limited within 5%, which can satisfy engineering design requirements.
Through the spectrum and time history analysis of the uncontrolled structure and the controlled structure, the bottom shear force, bottom bending moment, displacement and drift indexes of the uncontrolled structure and the controlled structure are compared. After the damper is installed, the deformation and force of the uncontrolled structure are effectively controlled. The arrangement of the dampers in the X direction of the V Program and the P Program is the same, and the analysis results of the structural system are consistent. However, compared with the P Program, the bottom shear force of the structure in the Y direction is reduced by 8.46%, the bottom bending moment is reduced by 5.79%, the displacement is reduced by 3.4%, and the drift is reduced by 16.72%.
Depending on the arrangements of dampers in the structure, velocity-type energy dissipators can play an improved role in energy dissipation and vibration damping when the velocity response is considerable. The vibration response of the structure and additional damping ratio of the structure improve. The improvement range is 4.17%–26.83%, with a mean of 12.83%.
ACKNOWLEDGMENTS
This research is funded by the National Key Research and Development Program of China (Grant No. 2021YFC3100701), the National Natural Science Foundation of China (Grant No. 51978185).
CONFLICTS OF INTEREST STATEMENT
The authors declare no conflicts of interest.


