Graphene Nanoribbons Enhancing the Electronic Conductivity and Ionic Diffusion of Graphene Electrodes for High-Performance Microsupercapacitors
Abstract
The electrochemical performance of microsupercapacitors with graphene electrodes is reduced by the issue of graphene sheets aggregation, which limits electrolyte ions penetration into electrode. Increasing the space between graphene sheets in electrodes facilitates the electrolyte ions penetration, but sacrifices its electronic conductivity which also influences the charge storage ability. The challenging task is to improve the electrodes' electronic conductivity and ionic diffusion simultaneously, boosting the device's electrochemical performance. Herein, we experimentally realize the enhancement of both electronic conductivity and ionic diffusion from 2D graphene nanoribbons assisted graphene electrode with porous layer-upon-layer structure, which is tailored by graphene nanoribbons and self-sacrificial templates ethyl cellulose. The designed electrode-based device delivers a high areal capacitance of 71 mF cm−2 and areal energy density of 9.83 μWh cm−2, promising rate performance, outstanding cycling stability with 97% capacitance retention after 20 000 cycles, and good mechanical properties. The strategy paves the way for fabricating high-performance graphene-based MSCs.
1 Introduction
The demand for microelectronics has been increased due to the emergence of artificial intelligence, such as wearable microelectronics industry and Internet of Things (IoT)-based industry.[1-4] The high-performance micropower devices, an indispensable component of miniatured electronic devices, are fabricated to satisfy their practical applications.[5, 6] Microsupercapacitors (MSCs) with in-plane interdigitated structures have been considered as competitive micropower devices because of their higher power density, long lifespan, environmental friendly, and safety.[7-10] The electrode materials play a key role in determining the electrochemical performance of MSCs. Among various electrode materials, graphene has emerged as the most appealing material for MSCs' applications due to its high specific surface area, excellent carrier mobility, good electrochemical stability, and high mechanical properties.[11-13] However, the aggregation of graphene sheets caused by van der Waals forces suppresses ions transport into and out of the electrode, resulting in the poor energy storage performance.[14, 15] Solving this issue becomes the core task to boost the electrochemical performance of graphene-based MSCs.
Great efforts have been devoted to solving the graphene sheets aggregation issue. Constructing porous structure of graphene electrodes is an effective way to alleviate the aggregation of graphene sheets.[16] Porous-structured graphene electrodes were fabricated by numerous technologies, such as laser scribing graphene precursors to form porous graphene,[17-20] chemical vapor deposition,[21-23] and Cu-reduced graphene oxide under an acidic environment.[24] The as-prepared porous-structured graphene electrode of MSCs delivered improved electrochemical performance thanks to the reduced barrier for lateral ion diffusion. Adding spacers between graphene sheets is another common strategy to mitigate their aggregation issue,[9] such as 0D materials of carbon quantum dots,[25] 1D materials of carbon nanotube,[12, 26] and other 2D materials such as Mxene.[27-29] The combination of graphene and spacers increase the electrolyte accessible surface area in electrode and facilitate the electrolyte ion penetration into electrodes, thus enhancing the charge storage ability of MSCs. In addition, the spacers can also work as active materials to store charge, increasing the energy density of MSCs. Although the above two strategies have achieved remarkable progress in alleviating the stacking of graphene sheets and accelerating the electrolyte ion migration in electrodes, they may sacrifice the electrical conductivity of the electrode while fabricating the porous structure. The electrical conductivity of electrodes plays a critical role in the performance of MSCs, especially the rate performance.[30, 31] The ionic and electronic transport work together to influence the electrochemical performance of MSCs.[32] Simultaneous improving the electrical conductivity of the graphene electrode while alleviating their aggregation is the key to realize high-performance graphene-based MSCs.
In this work, we design and experimentally realize both improved electronic conductivity and ionic diffusion graphene electrodes of MSCs with the assistance of 2D graphene nanoribbons (GNRs) and self-sacrificial templates ethyl cellulose (EC), boosting the electrochemical performance of MSCs. In the structure of graphene and GNRs electrodes (G-GNRs), GNRs, unzipped carbon nanotubes featured with 2D materials advantages beyond high electrical conductivity, prop up graphene sheets to prevent their stacking by forming porous layer upon layer structure, which is beneficial to enlarge electrolyte ion accessible surface area of electrodes.[33, 34] The 2D GNRs and 2D graphene increase their physical contact with the electrode, which enhances its electrical conductivity. Tailoring the content of self-sacrificial templates EC in G-GNRs electrodes can also turn the porosity of the electrode. Benefiting from the synergetic effects among self-sacrificial templates EC, GNRs, and graphene, the G-GNRs electrode possessed both high electronic conductivity and ionic diffusion properties. The electrodes are 3D printed based on G-GNRs inks and are used to build MSCs, which deliver high areal specific capacitance of 71 mF cm−2 and areal energy density of 9.83 μWh cm−2, and excellent long cycle performance with 97% capacitance retention after 20 000 cycle. This work provides new way for fabrication of high-performance graphene-based MSCs aiming to satisfy the practical application in micro energy storage.
2 Results and Discussion
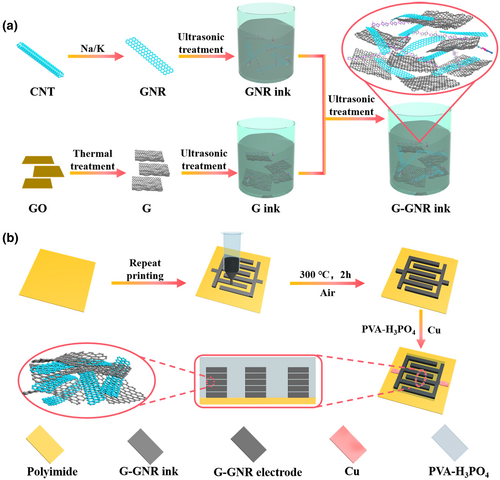
Scheme 1 shows the preparation processes of G-GNR-X-Y ink and MSCs. The preparation process of GNRs is illustrated in Figure S1a, Supporting Information. The GNRs were obtained by the reductive splitting method.[35] The Na/K alloy acts as a reducing agent to unzip CNTs. The original CNTs has smooth surface (Figure S1b, Supporting Information). After unzipping reaction, the longitudinal crack was present and the jagged edge could be seen, confirming the tube was successfully unzipped (Figure S1c, Supporting Information). G was prepared by thermal reduction of graphene oxide. They were dispersed in ethanol and terpineol mixed solution with assistance of EC by ultrasonication to form uniform ink, respectively. Then, their inks were mixed together to form G-GNR-X-Y ink after removing the ethanol, in which X represents the GNR mass ratio between G and GNRs, and Y represents the EC mass ratio in the active materials (Scheme 1a).
The suitable rheological behaviors of the inks are the key to ensure 3D printing reliability. Therefore, the rheological properties of G-GNR-X-Y ink were investigated. The GNRs effect on the rheological properties of G-GNR-X-Y ink is first studied when EC mass ratio in the active materials was set at 50. As shown in Figure S2a, Supporting Information, G-GNR-X-50 inks exhibit a typical shear-thinning property with increasing shear rate, which facilitates continuous extrusion of the ink during printing processes.[36] With the increase of GNR content, the viscosity of inks decreased. The storage modulus (G′) and loss modulus (G″) were also characterized, aiming to further investigate their rheological properties (Figure S2b–f, Supporting Information). The G′ is higher than G″ before reaching the yield point, implying the typical elastic-like status. When the oscillation strain exceeds the yield point, the G′ decreases sharply and is surpassed by G″, showing the liquid-like behavior.[37] This allows the ink to be extruded at high oscillation strain during the printing process and maintain the patterns' structure at static status after printing. The results indicate that all G-GNR-X-50 inks are suitable for 3D printing. The EC effect on the rheological properties of G-GNR-X-Y ink is then studied when the GNR mass ratio in the active materials was set at 10. The inks show the shear-thinning behaviors with features of non-Newtonian fluids (Figure S3a, Supporting Information). With the increase of EC contents, the apparent viscosity is increasing at the same shear rate, conforming that EC can tune the viscosity of the inks. The G′ of all G-GNR-10-Y is much higher than G″ before the yield point, exhibiting a typical behavior of solid. Their G′ is surpassed by G″ after the yield point, showing a typical behavior of liquid. The G′ of all inks with wide range from 103–104 Pa will ensure the printed patterns' structure stability (Figure S3b–d, Supporting Information). The rheological properties of all G-GNR-X-Y inks make them suitable for 3D printing.
The ink was loaded into syringe and squeezed out by air pressure on the polyimide substrate to print interdigitated patterns layer by layer. After thermal annealing to remove EC, the G-GNR-X-Y electrodes with porous layer-upon-layer structure were obtained. PVA-H3PO4 electrolyte was coated on the surface of the electrode to prepare the MSCs. The as-prepared MSCs were named as G-GNR-X-Y-Z, in which X stands for the GNR mass ratio between G and GNRs, Y stands for the EC mass ratio in active materials, and Z stands for the printing layers (Scheme 1b).
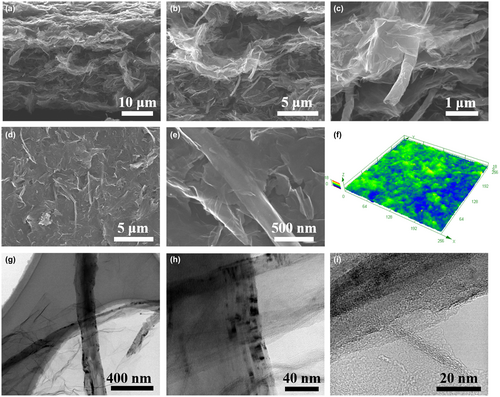
The morphologies and microstructure of G-GNR-X-Y electrodes were characterized by scanning electron microscopy (SEM) and transmission electron microscopy (TEM). Figure 1a–c shows the cross-sectional SEM images of G-GNR-10-40 electrodes. The GNRs are sandwiched between G sheets throughout the electrodes, resulting in the formation of the porous microstructure. The thickness of the G-GNR-X-Y-1 electrode shows slight difference due to the composition of the ink (Figure S4, Supporting Information). Figure 1d,e shows top view SEM images of G-GNR-10-40 electrode at different magnifications. The GNRs are dispersed on the surface of G or between G sheets, preventing G stacking. All G-GNR-X-Y electrodes show the similar morphologies (Figures S5 and S6, Supporting Information). The surface roughness of the electrodes was evaluated by confocal laser scanning microscopy (Figures S7 and S8, Supporting Information). The G-GNR-10-40 electrode shows the smallest surface roughness value of 1.09 μm except for GNR electrodes, demonstrating G-GNR-10-40 electrode has the smooth and uniform surface, consistent with the SEM images (Figure 1f).[38] Figure 1g–i shows the TEM images of G-GNR-10-40 electrode, exhibiting the unzipped CNT or GNRs were dispersed among G sheets.
The G-GNR-X-Y electrodes were also analyzed by X-ray diffraction (XRD), Raman spectroscopy and X-ray photoelectron spectroscopy (XPS) to confirm the structure and the chemical composites. Figure S9a, Supporting Information, shows the XRD patterns of GO and G-GNR-X-50 electrodes. The GO shows the prominent peak at ~10°. The characteristic peak at ~25° corresponding to the plane of 002 appears after thermal reduction treatment.[39] The GO and GNR-X-50 electrodes show the typical D and G peaks at 1350 and 1580 cm−1, respectively (Figure S9b, Supporting Information). The GNR electrode shows the 2D peak at 2700 cm−1, corresponding to the stacking of carbon atom.[35] The ratio of ID/IG of G is increased slightly compared to GO through reduction due to the defects arising from the edge effects. The GNR electrode shows the low ratio of D to G peak, suggesting the low density of defects. It consistent with the sharp XRD peak. The XPS survey of GO and G-GNR-X-Y electrodes shows that only C1s peak and O1s peak appear (Figure S9c, Supporting Information). The content of O1s decrease sharply after GO was reduced to G. The C/O ratio of GO and G-GNR-X-50 electrodes were 2.46, 26.17, 27.09, 28.15, 28.90, and 29.50, respectively (Figure S10, Supporting Information).The C1s peak is deconvoluted into four peaks including C–C/C=C, C–O, C=O, and O–C=O at 284.8, 285.8, 287.1, and 288.9 eV, respectively (Figure S11 and Table S1, Supporting Information).[17] All these results confirm that G-GNR-X-Y electrodes were successfully prepared.
The electrochemical performance of graphene-based MSCs mainly depends on the microstructure and electrical conductivity of G-GNR-X-Y electrodes. The effects of GNRs and EC on microstructure of G-GNR-X-Y electrodes were first studied. The N2 adsorption/desorption isothermal curves and pore size distribution of G-GNR-X-50 electrodes were shown in Figure S12, Supporting Information. The specific surface area of G-GNR-X-50 (X = 0, 5, 10, 20, 100) electrodes is 296, 327, 394, 338, and 40 m2/g, respectively. The specific surface area was slightly enhanced after adding GNRs, demonstrating GNRs can prevent the aggregation of G sheets. The similar pore size distribution of G-GNR-X-50 electrodes indicate the introduction of GNRs did not affect the pore size distribution. However, the electrodes also contain the pores in micro-scale, which cannot be evaluated by BET. The true density and the actual density of electrodes can exhibit their structure porosity to some degree. The true density of graphitic materials is 2.1 g cm−3.[40] The GNRs influence on actual density of G-GNR-X-50 electrodes was first studied. The G-GNR-X-50 electrodes' actual density decreases from 0.46 to 0.37 g cm−3 with the increase of GNRs mass content from 0 to 20 wt% (Figure 2a). When the mass ration between G and GNRs is 10 wt%, the G-GNR-10-Y electrodes' actual density increases from 0.35 to 0.65 g cm−3 with the decrease of EC from 60 to 30 wt% (Figure 2b).
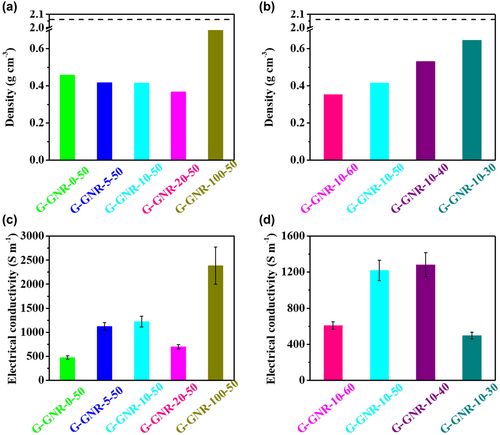
The electrical conductivity of G-GNR-X-Y electrodes was also measured by four-point probe to evaluate GNRs and EC effects (Table S2, Supporting Information). We first investigated the influence of GNRs mass content on the electrical conductivity of G-GNR-X-50 electrodes when the EC mass content of 50 wt% is stable. As shown in Figure 2c, the electrical conductivity of G-GNR-X-50 electrodes firstly increases with the increase of GNRs mass content, reaches the maximum of 1219 S m−1 from 475 S m−1 when the GNRs mass content increases from 0 to 10 wt% and then decreases with GNRs increase. The G (G-GNR-0-50) electrodes show a lower electrical conductivity of 475 S m−1 because of their defeats, while the GNR (G-GNR-100–50) electrodes show higher electrical conductivity of 2389 S m−1 due to its better crystallinity and fewer defects (Figures S9b,c and S11, Supporting Information).[35] So the electrical conductivity of G-GNR-X-50 increases with the increase of GNRs mass content. However, the addition of GNRs in the G-GNR-X-50 electrodes increase its porosity, resulting in the poor contact between graphene (Figure 2a). It decreases the electrical conductivity of G-GNR-X-50 electrodes. When GNRs content is 10 wt% in G-GNR-X-50, the electrical conductivity of G-GNR-10-50 electrodes reaches the maximum. When the GNRs mass content of 10 wt% is stable, the electrical conductivity of G-GNR-10-Y electrodes have the similar variation with the decrease of EC mass content. The porosity of G-GNR-10-Y electrodes decreases with the decrease of EC mass content. It is beneficial for graphene contact. Therefore the electrical conductivity of G-GNR-10-Y electrodes increases with the decrease of EC mass content. However, the addition of less EC during ink process might lead to poor dispersion of graphene, deteriorating the electrical conductivity of electrodes. Therefore, there is an optimized EC mass content for the electrical conductivity of G-GNR-10-Y electrodes. G-GNR-10-40 electrode has the highest electrical conductivity of 1283 S m−1 (Figure 2d). These results indicate that both GNRs and EC in G-GNR-X-Y electrodes can tailor electrodes' structure porosity and electrical conductivity via their mass content variation.
The electrochemical performance of G-GNR-X-Y based MSCs of G-GNR-X-Y-Z was evaluated by CV and GCD experiments at the voltage window of 0–1 V. The GNRs influence on the electrochemical performance of MSCs was first studied in G-GNR-X-50-1. Figure S13, Supporting Information, shows the CV curves of G-GNR-X-50-1 at scan rates ranging from 5 to 100 mV s−1. Their rectangular shapes of CV curves along with the excellent linearity between the current and scan rate demonstrate the good capacitive behaviors (Figure S14, Supporting Information).[41] The largest area of CV curves of G-GNR-10-50-1 at 10 mV s−1 among G-GNR-X-50-1 suggests the highest areal capacitance, consistent with the GCD curves results (Figure 3a,b). The areal capacitance of G-GNR-X-50-1 based on GCD curves is obtained (Figure 3c, Figure S15, Supporting Information). The areal capacitance of G-GNR-X-50-1 increases with the increase of GNRs mass contents, achieves the maximum when it reached 10 wt%, and then decreases as it increases. G-GNR-10-50-1 displays the largest capacitance of 11 mF cm−2 (0.05 mA cm−2) and the highest rate performance with 82% capacitance retention when the current density changes to 0.40 from 0.05 mA cm−2 (Figure S16, Supporting Information). G-GNR-10-50-1 also shows the largest volumetric capacitance (3.65 F cm−3 at 0.05 mA cm−2) (Figure S17, Supporting Information). G-GNR-10-50-1 delivers an energy density of 1.52 μWh cm−2 and the power density of 0.025 mW cm−2 at 0.05 mA cm−2 (Figure S18a, Supporting Information). The volumetric energy density of G-GNR-10-50-1 can reach to 0.51 mWh cm−3 (Figure S18b, Supporting Information). These results indicate that 10 wt% GNRs in G-GNR-X-50-1 is preferred to improve its electrochemical performance.
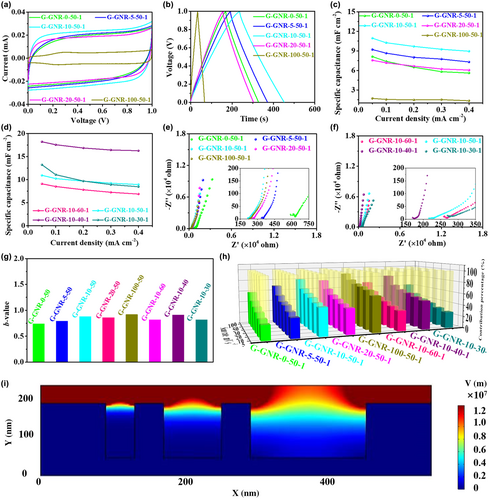
The EC influence on the electrochemical performance of MSCs was also evaluated in G-GNR-10-Y-1, in which 10 wt% GNRs was selected thanks to its improved electrochemical performance. The nearly rectangular CV curves, stronger linear relationship between current and scan rates, and almost triangular GCD curves illustrate the ideal capacitive behaviors (Figures S19–S21, Supporting Information). The areal capacitance of G-GNR-10-Y-1 increases with the decrease of EC mass content, reaches the maximum value when EC is 40 wt%, and then decreases with the decrease of EC mass content. G-GNR-10-40-1 displays the highest areal capacitance of 18.23 mF cm−2 at 0.05 mA cm−2 and excellent rate performance of 90% capacitance retention when the current density increases from 0.05 to 0.40 mA cm−2 (Figure 3d). Because of the slight difference of electrodes thickness, the volumetric specific capacitance of the devices can directly reflect their change in electrochemical performance. G-GNR-10-40-1 shows the highest volumetric capacitance of 5.36 F cm−3 and areal energy density of 2.53 μWh cm−2 among G-GNR-10-Y-1 (Figures S22 and S23, Supporting Information). These results show that G-GNR-10-40-1 has the best electrochemical performance among all G-GNR-X-Y-1, proving 10 wt% GNRs and 40 wt% EC are the optimized condition to boost the electrochemical performance of G-GNR-X-Y-1.
The drive force of the best electrochemical performance of G-GNR-10-40-1 in all G-GNR-X-Y-1 was studied. Electrochemical impedance spectroscopy (EIS) experiments of G-GNR-X-Y-1 was carried out in the frequency range from 100 000 to 0.01 Hz applying 5 mV AC amplitude. The EIS results and an equivalent circuit were shown in Figure 3e,f and Figure S24, Supporting Information. All devices exhibit nearly vertical tails at low frequency, suggesting the ideal capacitive behaviors. The slope of the line at low frequencies represents the Warburg resistance, which is a result of the frequency dependence of ion diffusion/transport in the electrolyte to the electrode. The G-GNR-10-40-1 shows the smallest Warburg resistance of 103 Ω, also demonstrating the fast ion diffusion. The G-GNR-10-40-1 also has the smallest equivalent series resistance (169 Ω) obtained from the real axis intercept at high frequency, attributed to the higher electrical conductivity of G-GNR-10-40 electrode (Table S3, Supporting Information and Figure 3e,f).[42]
For a deep analysis of EIS measurements, the characteristic frequency (f0) at 45° and its relaxation time constant (τ0 = 1/f0) of G-GNR-X-Y-1 were characterized (Figure S25, Supporting Information). The τ0 refers to the minimum time needed to discharge all the energy of the device with an efficiency of more than 50%.[43] The G-GNR-10-40-1 displays the smallest time constant of 2.58 s. The small τ0 reveals the fast ion diffusion behavior and the good power response. The kinetics of G-GNR-X-Y-1 was analyzed according to the power law: i = avb, in which i stands for the current, v stands for the scan rate, a and b stands for adjustable paraments. The b-value is 0.5 suggesting a diffusion control charge storage mechanism, while the b-value is 1 implying the mechanism is mainly dominated by capacitive behavior.[44] The b-value of G-GNR-X-Y-1 is between 0.5 and 1, indicating that both the diffusion and capacitive processes are involved during the charge storage process. The G-GNR-10-40-1 shows the larger b-value compared to the others, confirming the improved capacitive kinetics (Figure 3g, Figure S26, Supporting Information).
The charge storage process includes diffusion-controlled process and capacitive-controlled process. The contribution ratio of them can be calculated from the following equation: i = k1v + k2v1/2, where k1v and k2v1/2 represent capacitive-controlled process and diffusion-controlled process, respectively.[45] The capacitive contribution of G-GNR-X-Y-1 at various scan rates are shown in Figure 3h. With the increase of the scan rate, the proportion of capacitive is increased, while the diffusion process is decreased. The capacitive contribution in G-GNR-10-40-1 at each scan rate is higher than other devices, suggesting a fast and efficient electrolyte ion transport within the electrode of G-GNR-10-40-1. This was further proved by the results of wettability between the electrodes of G-GNR-X-Y-1 and electrolyte (water). As shown in Figures S27 and S28, Supporting Information, the electrode of G-GNR-10-40-1 has the smallest value of the contact angle, revealing that the porous electrode is beneficial to electrolyte absorption. These results indicate that adding GNRs and EC can tailor the porosity of electrodes, promoting electrolyte infiltration and ion transport.
COMSOL simulations of electric field intensity distributions in the electrode with different porosity were performed to investigate the porosity influence on ion transport. The simplified simulations model was shown in Figure 3i. It can be clearly observed that the electric field strengths display obvious enhancement near the small pore, which is beneficial to facilitate more charge accumulation and more ion adsorption.[46] The simulation indicates that tailoring the porosity of the electrode can affect the field intensity distributions, leading to higher charge storage ability.
Based on the above analysis, the excellent electrochemical performance of G-GNR-10-40-1 can be attributed to the following two factors: i) GNRs between the graphene sheets alleviates the aggregation of graphene sheets and enhance the electrical conductivity of electrodes, ensuring the electrode with abundant accessible active surface; ii) Tailoring GNRs and EC mass content endows the electrode with higher conductivity and reasonable porosity, improving electron transport and electrolyte ion diffusion. The above two factors synergistically endow G-GNR-10-40 electrode with fast kinetics, resulting in the prepared MSCs with promising capacitance and rate performance (Figure S29, Supporting Information).
In order to further improve the areal energy density of MSCs, multi-layers printing was conducted to increase the mass loading of active materials on devices in the limited area. The G-GNR-10-40 electrode was chosen for multi-layers printing due to its best electrochemical performance among all samples. The CV curves of G-GNR-10-40-Z with different printing layers from 1 to 5 are shown in Figure S30, Supporting Information. All their CV curves display a nearly rectangular shapes, demonstrating an ideal capacitive behavior. Figure 4a shows the CV curves of G-GNR-10-40-Z at the same scan rate of 10 mV s−1. Their CV curves area increases with the increase of printing layers, illustrating the increased charge storage ability. Figure 4b shows the GCD curves of G-GNR-10-40-Z at 0.10 mA cm−2. Their discharge time increases with the increase of the printing layers, demonstrating the capacitance can be enlarged through the increased printing layers. It is consistent with the CV curves results.
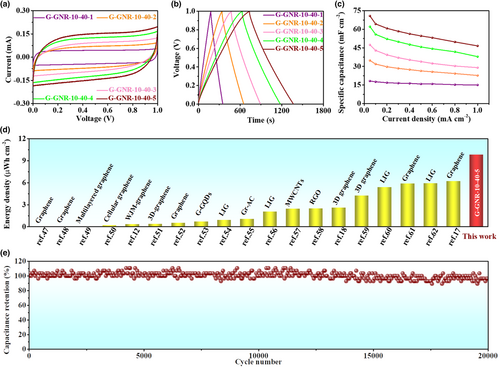
The areal capacitance of G-GNR-10-40-Z based on GCD curves was calculated (Figure 4c, Figure S31, Supporting Information). At 0.05 mA cm−2, the areal capacitance of G-GNR-10-40-Z with the printing layer from 1 to 5 is 18, 35, 47, 62, and 71 mF cm−2, respectively. The areal capacitance of G-GNR-10-40-5 is superior to state-of-the-art graphene-based MSCs (Figure S32, Supporting Information). The volumetric capacitance of G-GNR-10-40-Z with the printing layer from 1 to 5 is 5.36, 5.12, 4.65, 4.57, and 4.16 F cm−3, respectively (Figures S33 and S34, Supporting Information). The volumetric capacitance of G-GNR-10-40-Z is decreasing with the increase of printing layers because of the elongated ion and electron transport path way and lower efficient transport. This also results in the poor rate performance of the G-GNR-10-40-Z with the increase of the printing layer. The G-GNR-10-40-5 without current collectors can deliver an ultrahigh areal energy density of 9.83 μWh cm−2 at the power density of 0.025 mW cm−2, outperforming the reported graphene-based MSCs (Figure 4d, Figure S35a, Supporting Information).[12, 17, 18, 47-62] The volumetric energy density of G-GNR-10-40-Z is decreasing with the increase of printing layers from 1 to 5. The G-GNR-10-40-1 deliver the largest volumetric energy density of 0.74 mWh cm−3 at the power density of 7.44 mW cm−3 (Figure S35b and Table S4, Supporting Information). The G-GNR-10-40-5 achieve high capacitance retention of 97% after 20 000 cycle charge–discharge processes at 0.80 mA cm−2, demonstrating its excellent stability (Figure 4e).
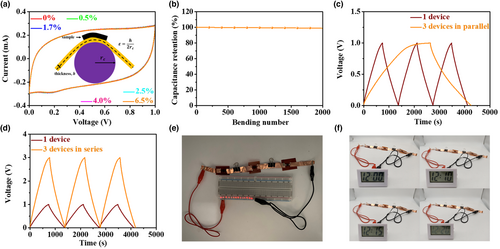
To verify the mechanical property of G-GNR-10-40-5, it is bent with different strain from 0 to 6.50%. Its CV curves show nearly rectangular shapes and almost overlapped compared with initial state at different bending states and 20 mV s−1 (Figure 5a). Meanwhile, it maintains about 100% of its initial capacitance after repeated 2000 times bent under 6.50% strain (Figure 5b). These results illustrate that G-GNR-10-40-5 possess excellent flexibility and stable cycling. To fulfill the requirements of MSCs in practical applications, G-GNR-10-40-5 can be connected in parallel or series to achieve a higher output current or voltage, respectively. Figure 5c shows GCD curves of three single devices in parallel. The discharge time of the connected devices is enlarged three times as expected, indicating the charge stored is increased three times. Figure 5d shows GCD curves of three single devices in series. The voltage window of the three connected G-GNR-10-40-5 can enlarge a factor of three compared with a single device. In addition, the devices in series can light on a series of 14 LED bulbs and power a timer for ~20 min (Figure 5e,f, Video S1, Supporting Information). The above results confirm that G-GNR-10-40-5 possesses remarkable potential application in the energy storage fields.
3 Conclusion
In summary, we have developed a facile method to fabricated ultrahigh areal energy density graphene-based MSCs. The as-prepared electrodes exhibit both excellent ionic diffusion and electronic transportation by tuning GNRs and self-sacrificing template EC. Due to the synergistic effects from the good conductivity and high reaction kinetics, the 3D printed G-GNR-10-40-5 show the exciting electrochemical performance with high areal capacitance (71 mF cm−2), high areal energy density (9.83 μWh cm−2) and power density (0.56 mW cm−2), promising rate performance and cycle stability. The device also exhibits good flexibility and promising application in energy storage fields. The strategy of designing high ionic and electronic transportation of graphene-based electrode opens up a new way for the fabrication of the high areal energy density MSCs.
4 Experimental Section
Materials
Ethyl Cellulose (M70, CAS: 9004-57-3), ethanol (≥99.7%, CAS: 64-17-5), methanol (≥99.5%, CAS: 67-56-1) and acetone (≥99.7%, CAS: 67-64-1) were acquired from Sinopharm Chemical Reagent Co., Ltd. Terpineol (AR, CAS: 98-55-5) was purchased from Guangzhou Jinhuada Chemical Reagent Co., Ltd. Carbon nanotube with an average diameter of 70–80 nm and 8% residual iron was purchased from NanoTechLabs, Inc. Na and K were purchased from Aladdin. 1,2-Dimethoxyethane (99.5%, CAS: 110-71-4) was purchase from Macklin.
Preparation of GNRs
The GNRs were prepared by reductive method.[35] In detail, 200 mg of CNT without purity were added into 250 mL round-bottomed flask in Ar-filled glovebox. Then, 70 mL of 1,2-dimethoxyethane and 1 mL of Na/K alloy were added. The flask was sealed before transferred out of the glovebox. The mixture was treated by 5 min sonication and then stirred for 3 days at room temperature. Methanol (20 mL) was added into the mixture to quench unreacted alloy. The GNRs were collected by vacuum filtration, washed with water, ethanol and acetone for several times, and dried under vacuum for 20 h.
Preparation of G-GNRs ink
Graphene (G) was prepared by thermal reduction of graphene oxide.[39] G ink was prepared as follow procedures. EC (150 mg) was dissolved into ethanol (60 mL) and then G (150 mg) was added. The mixture solution was ultrasonicated for 30 min at 150 W power in ice and water bath. G ink was obtained after the addition of terpineol (2 mL) followed by another 30 min ultrasonication treatment at the same condition. The GNRs ink was prepared in the same method as G ink. The G-GNRs ink was obtained by mixing G ink and GNRs ink with the ultrasonication treatment for 30 min, followed by evaporating ethanol. The composite ink was named as G-GNR-X-Y ink, in which X represents the GNRs mass ratio between G and GNRs, and Y represents the EC mass ratio in the active materials.
Fabrication of 3D printed all-solid-state MSCs
The G-GNR-X-Y ink was loaded into a syringe to prepare 5 mm × 5 mm interdigitated patterns layer-by-layer using a benchtop robot (Fisnar F4200n) on polyimide substrate, following drying in vacuum oven at 80 °C for 12 h. Then the patterns were heated at 300 °C for 2 h under air atmosphere to remove EC. The polyvinyl alcohol and H3PO4 gel electrolyte (PVA/H3PO4) was prepared by stirring 10 mL of deionized water, 1 g of PVA, and 1 g of H3PO4 at 90 °C for 3 h. The MSCs were obtained by coating PVA/H3PO4 onto the surface of the printed patterns, followed by drying overnight. MSCs were named as G-GNR-X-Y-Z, where X represents the GNR mass ratio between G and GNRs, Y represents the EC mass ratio in the active materials, and Z represents the printing layers.
Characterizations
The morphology of the electrode was characterized by SEM (Zeiss GeminiSEM 500) and TEM (JEOL JEM-F200). The structure and chemical composite of the electrode were studied by XRD (Bruker D8 ADVANCE), Raman (EuroVector EA3000), and XPS (Thermo Fisher ESCALABXi+). Contact angle was tested on an INNUO CA-100C system. The electrolyte used to test the contact angle was prepared by stirring 10 mL of deionized water, 0.1 g of PVA and 1 g of H3PO4 at 90 °C for 3 h. The surface roughness of the electrode was measured on a confocal laser scanning microscope (OLS4000).
The rheological behaviors of the ink were characterized by a rheometer (TA rheometer DHR-2).
Electrochemical measurements
Electrochemical performance of MSCs was measured by an PARSTAT MC electrochemical workstation (PMC-CHS08A) for cyclic voltammetry (CV) and galvanostatic charge–discharge (GCD) at the voltage window of 0–1 V. The electrochemical impedance spectroscopy (EIS) measurement was tested with a voltage amplitude of 5 mV during the frequency range from 105 to 10−2 Hz.
COMSOL simulations
Acknowledgements
This work was financially supported by National Natural Science Foundation of China (No. 52072297), Key R&D Plan of Shaanxi Province (No. 2021GXLH-Z-068) and Young Talent Support Plan of Xi'an Jiaotong University. The authors also thank Instrument Analysis Center of Xi'an Jiaotong University for their help in materials characterizations.
Conflict of interest
The authors declare no conflict of interest.


