Understory evapotranspiration rates in a coast redwood forest
Funding information: National Science Foundation, Grant/Award Number: NSF-EAR-1807165; U.S. Forest Service; USDA Forest Service Pacific Southwest Research Station; California Department of Forestry and Fire Protection
Abstract
In forests where the overstorey canopy has been disturbed by timber harvest or other means, evapotranspiration (ET) by the understorey may be the main flux of water back to the atmosphere. However, little research has been apportioned to directly measuring understorey water use, and the technology to do so is thus limited. Here, we used a portable chamber to quickly and directly measure understorey ET by measuring the water flux from the soil and vegetation enclosed by the chamber. This method was used in a third-growth coast redwood forest to measure ET rates from individuals of five species commonly found in the understorey: Sequoia sempervirens (coast redwood) sprouts, Notholithocarpus densiflorus (tanoak) sprouts, Vaccinium ovatum (evergreen huckleberry) sprouts, Polystichum munitum (sword fern) and Struthiopteris spicant (deer fern). Measurements were conducted in four small watersheds which were harvested to varying intensities ranging from 0% to 75% targeted reduction in preharvest overstory basal area. Mean understorey ET rate was highest in the watershed with the lowest residual basal area (x̅ = 0.036 ± 0.024 mm/h) and lowest in the unharvested control watershed (x̅ = 0.013 ± 0.0078 mm/h). Multiple regression modelling on resprouting species indicated that the difference in ET rate between watersheds was related to soil and light resources. These results imply that understorey water use can be significant, particularly in harvested watersheds, and should be quantified at the landscape scale.
1 INTRODUCTION
A significant proportion of precipitation falling on forested watersheds is returned to the atmosphere via plant transpiration and evaporation from the soil and leaf surfaces (Jasechko et al., 2013). These processes, collectively known as evapotranspiration (ET), mediate the seasonal and annual water balances in an ecosystem. Across the globe, climate change is causing perturbations to these ecosystem water balances—rising global temperatures and more variable precipitation regimes are generally increasing ET, with cascading declines in ecosystem water storage (Nemani et al., 2003; Vicente-Serrano et al., 2012). The feedback between vegetation water use and ecosystem water storage has the potential to drastically change local landscapes, as tree mortality in some locations will increase due to higher moisture stress (Jung et al., 2010; Klein & Hartmann, 2018). This is especially concerning in Mediterranean climates, where plant water use is out of phase with precipitation inputs to the ecosystem (e.g. Hahm et al., 2019) and the presence and duration of droughts has increased (Eamus et al., 2013; Goulden & Bales, 2019; Yuan et al., 2019). In such systems, indirect moisture storage (i.e. soil and bedrock storage that is disconnected from streamflow) can sustain transpiration during dry periods (Dralle et al., 2018; Hahm et al., 2019; Rempe & Dietrich, 2018) and protect vegetation from drought-induced mortality.
Despite its control on the cycling of water within and across watersheds, ecosystem water loss via ET is still hard to quantify. While numerous studies have quantified ET for different species and ecosystems (e.g. Ford et al., 2007; Pataki et al., 2000; Poyatos et al., 2016; Tang et al., 2006), the measurements cannot always be transferred to other ecosystems and species assemblages. This can pose problems when modelling hydrological dynamics (or other resources dependent upon water availability, such as carbon or nitrogen cycling) across larger scales, as small uncertainties in ET estimates become compounded (Ershadi et al., 2014). Some water budget models estimate ET simply by temperature (e.g. Hamon, 1963; Thornthwaite & Mather, 1955) or other climate metrics such as vapour pressure and net radiation (e.g. Penman, 1948). These general equations have high ease of use yet estimate only reference (ET0) or potential evapotranspiration (PET) instead of the more complex actual evapotranspiration (AET). Thus, water or energy budget approaches can greatly over- or underestimate the contributions of ET based on landscape and vegetative characteristics or disturbance regimes (e.g. Beven, 1979; Tie et al., 2018). Newer approaches use remote sensing products to estimate ET across landscapes (e.g. Mu et al., 2007; Nagler et al., 2005; Nouri et al., 2015; Vinukollu et al., 2011), yet these techniques often use sparsely available empirical data to calibrate their models, which may increase uncertainty.
While ET measurements are lacking for overstorey vegetation, they are almost non-existent for understorey species. ET by the understorey may comprise a significant component of the hydrologic budget, especially in forests where the overstorey canopy has been disturbed (Delzon & Loustau, 2005; Greenwood et al., 1985; Kelliher et al., 1990; Köstner, 2001). The ability to estimate water use by understorey plants is therefore vital for a complete ecosystem water budget. Several studies indicate that the understorey contributes substantially to total forest ET in both disturbed and undisturbed forests. For instance, in an undisturbed Pinus taeda (L.) forest, under- and midstorey transpiration constituted about one-third of total stand ET as determined by mass balance, eddy flux and sap flux (Oren et al., 1998). In a paired watershed study in the southern Appalachians of North Carolina, USA, the removal of dense understorey increased streamflow by an average of 51 mm (4%) for the first 6 years after treatment (Johnson & Kovner, 1956). Similarly, overstorey ET rates in a Douglas-fir forest increased following plot-scale removal of the salal-dominated understorey (Kelliher et al., 1986). This increase was greatest in plots where the salal had been most dense prior to removal.
Despite evidence that the forest understorey may be an important water flux in various ecosystems, ET is rarely quantified from subcanopy vegetation. Furthermore, since little research has been apportioned to directly measuring understorey water use, the technology to do so is limited. Though there are not widely used or accepted methods for quantifying understorey ET rates, portable chambers have been used in previous work as a simple and affordable method of measurement. Portable ET chambers have been most commonly used to measure crop transpiration (Luo et al., 2018; Reicosky et al., 1983; Reicosky & Peters, 1977), chaparral vegetation (Grieve & Went, 1962), prairie grasses (Luo et al., 2018) and desert shrubs (Garcia et al., 2008; Stannard & Weltz, 2006). These ET chambers have been validated against other methods in the field. A method comparison study which measured alfalfa ET rates found that that weighing lysimeter and portable chamber approaches yielded similar results (Reicosky et al., 1983). Similarly, a 2018 study, which measured ET rates in plots of soybeans, corn and reconstructed prairie, found that ET rates measured with a portable chamber were within 5% and 10% of those calculated using eddy covariance and watershed balance, respectively (Luo et al., 2018).
The portable chamber method has been applied less frequently in forests. Such chambers have been used to estimate ET from the understorey of a Jarrah forest in Australia (Greenwood et al., 1985). Similarly, Vincke et al. (2005) used a short-term chamber to measure ET from the forest floor of a Quercus robur (L.) stand in Belgium. Although the instantaneous measurements taken in these studies do not capture long-term or seasonal trends in ET, measurements can be repeated across time. For example, a rapid portable chamber was also used by the US Geological Survey (USGS) to make ET measurements of desert shrubs in Nevada (Garcia et al., 2008), and ET measurements were taken hourly for several plant species to quantify diurnal variation. They measured shrub ET rates ranging from about 1 to 20 mm per day. These studies show that chambers remain a practical and accessible way to make direct measurements of ET in situ.
As mentioned above, Mediterranean climates experience a lack of synchronicity between the timing of rainfall occurrence and subsequent water use by plants (Hahm et al., 2019), and vegetation in these ecosystems is dependent upon short- and long-term weather fluctuations. Growing season streamflow in Mediterranean regions is thus highly mediated by vegetation water use. In the Mediterranean climate of northern coastal California, USA, coast redwood (Sequoia sempervirens (D. Don) Endl.) is also actively managed as a timber product, further complicating plant-water-use dynamics in the region. In the light-limited coast redwood ecosystem (Olson et al., 1990), the process of removing the overstorey canopy via harvesting may drastically influence understorey ET, as plants no longer need to compete for both light and belowground resources. Timber harvesting has been proposed in other parts of California as a means for increasing summertime streamflow during droughts, which have increased across the state in recent years (Diffenbaugh et al., 2015; Williams et al., 2015). However, the decreased overstorey ET from harvesting may still result in low summertime streamflow due to increased ET from rapidly growing understorey vegetation. Given the unique, yet understudied, interconnection between overstorey and understorey plant water use, our overarching goals of this research were to (1) quantify the ET rate of common woody understorey species native to coast redwood forests and to (2) compare the understorey ET rates across a range of environmental conditions due to timber harvesting. We used an existing timber harvesting experiment at the Caspar Creek Experimental Watersheds in northern California to explore these relationships.
2 SITE DESCRIPTION
Caspar Creek drains 2167 ha of Mendocino County in northwestern California into the Pacific Ocean (Figure 1), and 90% of the watershed is within the Jackson Demonstration State Forest (JDSF). The Caspar Creek Experimental Watersheds encompass the North Fork Caspar Creek (424 ha) and South Fork Caspar Creek (473 ha) and are managed by a partnership between the USDA Forest Service Pacific Southwest Research Station and the California Department of Forestry and Fire Protection. The climate at Caspar Creek is Mediterranean, with wet, mild winters and dry summers, which bring coastal fog. Mean annual precipitation from 1989 to 2018 was 1168 mm, while the mean monthly temperature during this period was 6.1°C in December and 13.7°C in August. Ninety-three per cent of the yearly precipitation falls between October and April, almost entirely as rain. Using the Thornthwaite approach and temperature data recorded on-site from 2009 to 2017, PET at Caspar Creek reaches a maximum in the summertime months of June and July (PET = 0.10 and 0.11 mm/h, respectively). Soils consist of mainly well-drained clay loam Ultisols and Alfisols with underlying Franciscan sedimentary bedrock. Slopes in Caspar Creek can reach above 50% and elevation ranges from 46 to 323 m (Henry, 1998).
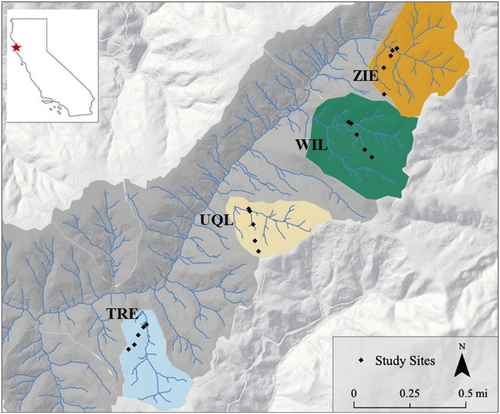
Canopy vegetation across the watersheds is predominantly second- and third-growth coast redwood, with smaller proportions of Pseudotsuga menziesii (Mirbel) Franco (Douglas fir), Abies grandis (Dougl. ex D. Don) Lindl. (grand fir) and Tsuga heterophylla (Raf.) Sarg. (western hemlock) (Henry, 1998). The upper understorey layer consists primarily of mature Rhododendron macrophyllum Don ex G. Don (Pacific rhododendron), Notholithocarpus densiflorus (Hook. & Arn.) Manos, Cannon & S. Oh (tanoak), and Vaccinium ovatum Pursh (evergreen huckleberry). Ferns and other low-lying herbs comprise the lower understorey. Polystichum munitum (Kaulf.) C. Presl (sword fern), Struthiopteris spicant (L.) F. W. Weiss (deer fern), Trillium ovatum Pursh (Pacific trillium) and Gaultheria shallon Pursh (salal) are common in this lower understorey, along with sprouts of redwood, tanoak and evergreen huckleberry. Ground cover is sparse in disturbed areas, which are heavy with duff, but is predominately Oxalis oregana Nutt. (redwood sorrel) and Viola sempervirens Greene (redwood violet).
The South Fork Caspar Creek has experienced three rounds of forest harvesting. At the turn of the 20th century, the entire watershed was clear-cut with handsaws and skid steers. From 1971 to 1973, 60%–70% of stand volume was removed via selection cutting and tractor yarding for the first Caspar Creek paired watershed experiment (Rice et al., 1979). From 2017 to 2019, the South Fork watershed was again harvested, this time in accordance with the updated California Forest Practice Rules (FPRs) for a third Caspar Creek experiment (Dymond, Richardson, et al., 2021). As part of the larger third experiment, plots were established in four sub-watersheds in the South Fork: Williams (WIL), Treat (TRE), Uqlidisi (UQL) and Ziemer (ZIE). These watersheds were harvested in 2018, which resulted in a range of residual overstorey basal areas across the study plots (Tables 1 and S1).
| Watershed name/ID | Area (ha) | Topographic position | Slope (%) | Aspect (°) | Elevation (m) | Post-harvest overstorey basal area (m2) |
|---|---|---|---|---|---|---|
| Williams (WIL) | 26 | Riparian | 46 | 300 | 166.4 | 2.8 |
| Toeslope | 50 | 320 | 173.1 | 0.7 | ||
| Sideslope | 80 | 350 | 203.9 | 0.8 | ||
| Shoulder | 55 | 357 | 251.5 | 1.6 | ||
| Ridge | 25 | 288 | 274.0 | 1.0 | ||
| Treat (TRE) | 14 | Riparian | 50 | 320 | 173.1 | 1.5 |
| Toeslope | 80 | 350 | 203.9 | 0.9 | ||
| Sideslope | 55 | 357 | 251.5 | 0.3 | ||
| Shoulder | 25 | 288 | 274.0 | 0.3 | ||
| Ridge | 36 | 91 | 165.1 | 0.4 | ||
| Uqlidisi (UQL) | 13 | Riparian | 19 | 305 | 135.4 | 2.0 |
| Toeslope | 53 | 355 | 142.2 | 0.04 | ||
| Sideslope | 57 | 357 | 179.8 | 0.2 | ||
| Shoulder | 32 | 21 | 217.1 | 0.4 | ||
| Ridge | 8 | 3 | 233.0 | 0.5 | ||
| Ziemer (ZIE) | 25 | Riparian | 15 | 10 | 196.2 | 4.6 |
| Toeslope | 55 | 0 | 201.9 | 0.1 | ||
| Sideslope | 85 | 18 | 224.1 | 0.4 | ||
| Shoulder | 28 | 351 | 248.0 | 0.1 | ||
| Ridge | 19 | 294 | 270.4 | 0.3 |
3 METHODS
3.1 Vegetation surveys
Within each of the four study watersheds, a transect was established along a topographic gradient with a 1/20th ha circular study plot at each of five positions: riparian, toeslope, sideslope, shoulder and ridge (Table 1 and Figure 2a). Overstorey tree characteristics and vegetation density were measured post-harvesting in each plot in 2019 (Dymond, Richardson, et al., 2021). The soil texture across each plot is generally sandy loam—soil texture does not differ significantly across the plots or with depth (Dymond, Wagenbrenner, et al., 2021). Overstorey tree characteristics included the number of trees by species, diameter at 1.37 m, distance and azimuth from plot centre, tree height and live crown height.
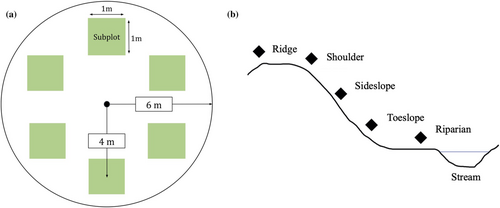
In summer 2019, subcanopy vegetation of each study plot was surveyed using six 1 m × 1 m subplots (Figure 2b). The subplot centres were positioned at a horizontal distance of 4 m from the plot centre at azimuths of 0°, 60°, 120°, 180°, 240° and 300°. Within each subplot, the number of understorey stems and sprouts by woody species was recorded. Since several woody species possess the capability to sprout from lignotubers and were difficult to determine as distinct individuals, individual stems were counted for all species. Stem samples were collected in the field to estimate leaf area of the study species. Ten redwood stems, five tanoak stems, and five evergreen huckleberry stems were collected from random sprouts at the ridge plots of WIL and ZIE. The sprouts were cut at the soil surface and placed in bags for later analysis.
Leaf area of the collected redwood sprouts was found by scanning the sprouts and using the ‘Analyze Particles’ tool in Fiji (Schindelin et al., 2012). Stem length was also measured in Fiji and verified using a ruler to ensure that the image scale was accurate. Stems were excluded from the leaf area by erasing them from the image before measurement. A linear regression of leaf area as a function of stem length was then conducted using R statistical software Version 1.1.456. The leaf area of each ET study plant (see below) was calculated from the regression equation using the number of stems in the plant as recorded in the field. For evergreen huckleberry and tanoak, an average leaf size was found using ‘Analyze Particles’ in Fiji on scans of leaves from the collected stems. The number of leaves per stem was then counted and divided by the length of the stem to find leaf density. This density was multiplied by the average leaf size to determine average leaf area per unit length of stem for the two species. This average leaf area per unit length of stem was then multiplied by each sample plant's stem length and number of stems to calculate a total leaf area per sample plant.
3.2 Understorey ET and soil moisture measurements
Understorey plant species were selected for ET measurements based on their frequency across sites and included evergreen huckleberry, coast redwood, tanoak, deer fern and western sword fern. Within each plot, two plants of each target understorey species were selected for ET measurements, although not every species was present in every plot. Height at the time of each measurement was also recorded.
Snapshot measurements of understorey ET were conducted using a portable rapid ET chamber which was modelled after the chamber described by Stannard (1988). The chamber consisted of a PVC frame approximating the shape of a rectangular frustum surrounded by a sheet of 4 mil clear polyethylene (Figure 3). The chamber measured approximately 34 × 34 cm at the top and 81 × 81 cm at the bottom, for a total volume of 3200 cm3 and a vertical height of 91 cm. Two 10 cm × 10 cm brushless fans were used to mix the air within the chamber. These fans were attached to stakes at heights of 28 and 48 cm above the ground and mounted in opposite corners facing the centre of the chamber. A HOBO Pro v2 Temperature/Relative Humidity data logger (Onset Computer Corporation, Bourne, MA, USA) was suspended in approximately the middle of the chamber and set to record temperature and relative humidity (RH) every 10 s. Additionally, a HOBO Pendant Temperature/Light sensor (Onset Computer Corporation, Bourne, MA, USA) was suspended from the top of the frame to record light intensity within the chamber every 30 s.
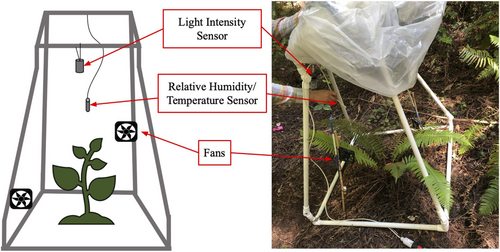
The chamber without the plastic film in place was assembled around a single plant, which was centred in the chamber as much as feasible given the terrain and asymmetry of the vegetation, with one fan pointing at the base and one pointing at the crown. After the fans and sensors were positioned and turned on, the chamber was quickly sealed by securing the plastic to the ground surface. Once the chamber was sealed, the vapour concentration within the chamber was measured at a 10-s interval until the RH stabilized. Periods of measurement ranged from 30 s to 10 min, and RH usually stabilized around 2 min after the start of the measurement. Temperature and RH were used later to calculate ET.
ET measurements were conducted during active daylight hours (typically 0730–1630 Pacific Daylight Savings Time) with similar insolation and weather conditions to reduce environmental variability across the measurements. Each watershed was sampled in approximately the same sequence so that each topographic position was measured at about the same time of day. Measurements were conducted twice during the dry season (early June and late July). The chamber plastic film was replaced after the measurements in June.
Volumetric water content (VWC) in the upper 20 cm of soil was measured using a HydroSense soil moisture probe (Campbell Scientific, Inc., Logan, UT, USA). At the time of ET measurements, VWC was measured within 15 cm upslope, along the contour, and downslope of each plant except for stump sprouts, where VWC was measured in the same directions within 15 cm of the stump. VWC was not measured for plants growing from trunks that were no longer rooted.
4 HYPOTHESIS TESTING
All calculations and statistical analyses were conducted using R Version 1.1.456 (R Core Team, 2017), with a significance threshold of α = 0.05. ‘ET rate’ refers to the mean group rate across sampling periods and species, unless otherwise specified. A log10 transformation was applied to several variables, including the response variable, to normalize their distribution for analysis of variance (ANOVA) testing and regression modelling.
4.1 Understorey species diversity across watersheds
We first investigated how understorey species metrics changed across the four study watersheds. The ‘tapply’ function in R (R Core Team, 2017) was used to calculate the mean and standard deviation of species richness, Shannon's diversity index and Shannon's evenness as averaged across the four study watersheds. One-way ANOVA testing was used to compare the mean of each variable across each watershed (H0: x̅WIL = x̅TRE = x̅UQL = x̅ZIE). Tukey HSD tests (Tukey, 1949) were then used to determine significant pairwise differences after ANOVA testing.
4.2 ET rates across watersheds
We looked at watershed-level ET rates across our June and July sample periods, as well as the average between the 2 months. One-way ANOVA testing was used to test the null hypothesis that ET rates did not vary significantly across watersheds (μWIL = μTRE = μUQL = μZIE) using R package lme4 (Bates et al., 2015). Post hoc pairwise comparison tests between the watersheds were conducted using R package lsmeans (Lenth, 2016). Understorey ET rates were compared to residual overstorey basal area using linear regression and Pearson's correlation test.
4.3 ET rates across environmental conditions
A linear model approach was used to investigate the relationship between ET rate and environmental conditions in the study watersheds using the linear model function in R (R Core Team, 2017). These analyses were conducted on ET rate data collected from the three sprout species (evergreen huckleberry, coast redwood and tanoak). Correlation matrices were visually analysed to assess multicollinearity of variables. Additionally, variance inflation factors (VIFs) were calculated for each predictor variable. Any variables that were correlated to another variable were removed from the model. Residuals plots and added-variable plots were used to assess residual normality and linearity of each model, respectively.
A full model was developed correlating ET rate to all possible predictor variables across watersheds, as well as for each watershed individually. Variables considered in the model included light intensity (lux), temperature (°C), soil VWC (%), elevation (m), basal area (m2), estimated leaf area (cm2) and species. Second-order interactions between VWC, light intensity and temperature were considered in the model selection process. The predictor variables were scaled to the same range, so the different models could be directly compared. Sums of squares-based effect size indices were calculated for each variable using ‘modelEffectSizes’ from the lmSupport package in R (Curtin, 2018).
‘StepAIC’ from the ‘MASS’ package (Venables & Ripley, 2002) was used to select models that were most effective at predicting ET rate within watersheds and species groups. The stepwise AIC method was used on the full model to select the best-fit model for predicting ET rate across watersheds. The best-fit model that was found for all samples was also applied to watersheds individually. Thus, the effects of the most influential variables could be directly compared at the watershed scale by analysing effect size indices. Finally, stepAIC was used to find best-approximating models within each watershed.
Marginal mean predictions were generated for the response variable from each model term using the function ‘ggpredict’ from the ggeffects package (Lüdecke, 2018). Predictions were made from the variables included in the overall best-fit model, but subset for each watershed.
5 RESULTS
5.1 Understorey species metrics
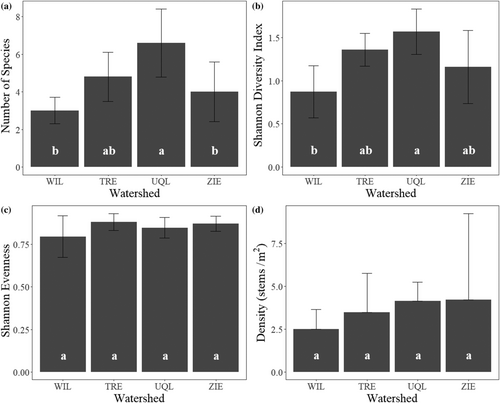
When averaged across subplots and topographic positions, the untreated WIL watershed had the lowest density, species richness, diversity and evenness (x̅ = 2.5 ± 1.1 stems/m2, 3.0 ± 0.7, 0.87 ± 0.30 and 0.80 ± 0.12, respectively) (Figure 4). The moderately harvested UQL watershed had significantly greater species richness and diversity than the untreated watershed (x̅ = 6.6 ± 1.8 and 1.6 ± 0.26, respectively). Density (x̅ = 4.2 ± 5.0 stems/m2), species richness (x̅ = 4.0 ± 1.6) and diversity (x̅ = 1.2 ± 0.42) in the highly harvested ZIE watershed were not significantly different from the unharvested site. There were no significant differences in evenness or density of understorey vegetation between any of the watersheds (Figure 4), and there were no significant differences between standing overstorey basal area (Table 1) and any of the understorey plant metrics (p > 0.05 for all regressions). While the harvested watersheds generally lacked vertical heterogeneity, the untreated WIL watershed had a more developed midstorey of mature V. ovatum, N. densiflorus and R. macrophyllum. Understorey densities and species distributions are summarized in Table S2
5.2 Understorey ET rates across watersheds
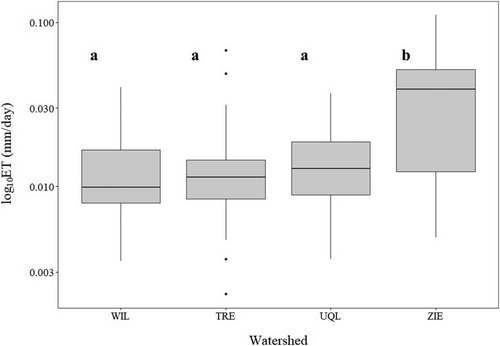
Instantaneous understorey plant ET rates ranged from 0.0022 (deer fern, July) to 0.11 mm/h (evergreen huckleberry, July) (Table 2). When averaged across species and sampling period, there were significant differences in log10ET rate by watershed (F = 30.91; p < 2e-16; Figure 5). The highly harvested ZIE watershed had the highest average ET rate (μ = 0.036 ± 0.024 mm/h), which was significantly higher than ET rates in the other watersheds. The untreated WIL watershed had the lowest ET rates (μ = 0.013 ± 0.0078 mm/h), and differences between the WIL, TRE and UQL watersheds were not statistically significant.
| Watershed | June | July | Mean |
|---|---|---|---|
| WIL | 0.016 (0.0092) | 0.0091 (0.003) | 0.013 (0.0078) |
| TRE | 0.013 (0.005) | 0.013 (0.014) | 0.013 (0.01) |
| UQL | 0.016 (0.0081) | 0.013 (0.0064) | 0.014 (0.0074) |
| ZIE | 0.04 (0.02) | 0.032 (0.027) | 0.036 (0.024) |
| All | 0.022 (0.017) | 0.017 (0.018) | 0.02 (0.018) |
- Note: Standard deviations are shown in parentheses after the means.
ET rates decreased from June to July across all watersheds (Table 2). Collectively, the mean understorey ET rate decreased from an average of 0.022 mm/h in June to 0.017 mm/h in July (p = 0.00024). The biggest difference in mean ET rate from June to July was observed in WIL, which decreased from 0.016 mm/h in June to 0.0091 mm/h in July (p = 0.0015).
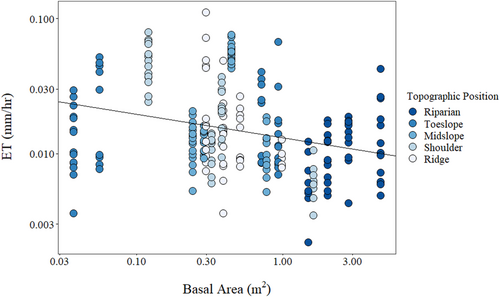
Understorey ET rate and post-harvest overstorey basal area demonstrated a slight inverse relationship that was weak but statistically significant (R2 = 0.081, t = −4.7, p = 5.2e-06) (Figure 6).
5.3 Environmental controls of understorey ET
| Watershed | Best-approximating model | Adj. R2 | p-value |
|---|---|---|---|
| All | 0.755 | < 2.2e-16 | |
| WIL | 0.704 | 4.5e-09 | |
| TRE | 0.682 | 5.1e-07 | |
| UQL | 0.556 | 3.5e-07 | |
| ZIE | 0.651 | 1.5e-10 |
- Notes: Bold type indicates a statistically significant variable. In models that included the species variable as a factor, the intercept was allowed to vary to account for differences between species. Species-dependent intercepts are given in Table S3.
- Abbreviations: BA, basal area (m2); EL, elevation (m); j, species; LA, leaf area (cm2); LI, light intensity (lux); T, temperature (°C); VWC, volumetric water content (%); ε, random error.
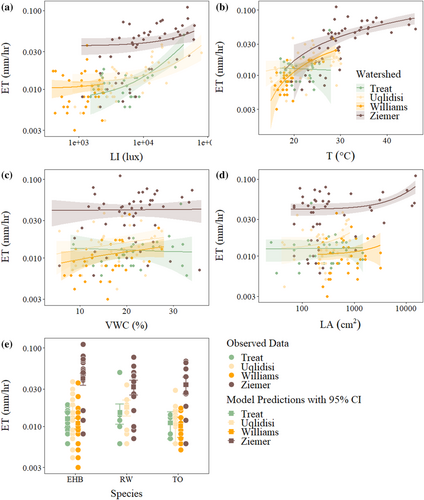
All terms in Equation 5 were statistically significant aside from species (Table 3). Temperature had the largest influence on sprout ET rate. Despite that this model was not watershed specific, the fit was quite high (R2 = 0.76). Because of its high predictive power, this model was also used on ET data when subset by watershed. This directly compared the effects of the most influential variables (VWC, LI, LA and T) on sprout ET rate within each watershed (Figure 7).
The full model was also applied to each watershed individually and used to find watershed-specific best-approximating models. At the WIL watershed, variation in ET rate was best described by temperature, followed by basal area. These two variables explained 70% of the variation in ET rate at WIL, and both terms were statistically significant (Table 3). At the lightly harvested watershed TRE, the best model was based on LI, elevation and BA (Table 3) and described 68% of the variation in ET rate. BA, however, was not statistically significant. At UQL, the best-approximating model included LI and elevation, but the adjusted R-squared was very low. Applying a log10 transformation to LI provided a much better fit, since LI displayed a wide range of values at UQL. However, the adjusted R2 was still much lower for UQL than for other watersheds (Table 3). Furthermore, elevation was not statistically significant. At the intensely harvested watershed ZIE, ET rate was best described by temperature, LI and LA. All three terms were statistically significant and explained 65% of the variation in ET rate at ZIE (Table 3).
Marginal effect predictions suggest that ET rate responded to environmental variables differently across watersheds. While VWC had little effect on ET rate in the intensely harvested watershed (ZIE) and the lightly harvested watershed (TRE), it greatly influenced ET rate in the control watershed (WIL) and the moderately harvested watershed (UQL; Figure 7). Species, LI and LA had little effect on ET rate in WIL compared to temperature and VWC (Figure 7). However, LI had a large effect on ET rate in TRE and UQL, while LA was important in ZIE (Figure 7). Temperature, which was the most important variable in predicting ET rate across watersheds (Table 3), had a strong effect on ET rate in WIL and ZIE (Figure 7). However, ET and temperature display a slightly negative trend at TRE. Light intensity displayed the most consistent positive correlation with sprout ET rate.
6 DISCUSSION
6.1 Understorey vegetation differs across watersheds
Understorey diversity was greatest in the TRE (x̅ = 1.4 ± 0.19) and UQL (x̅ = 1.6 ± 0.26) watersheds, which were thinned to a light or moderate degree. The ZIE understorey (the highly harvested watershed) consisted mainly of V. ovatum, S. sempervirens and L. densiflorus, which are all woody-stemmed species with a high propensity to sprout from stumps. By contrast, UQL and TRE were rich in herbs and ferns and similarly had the greatest number of species. Light and soil water resources were less limiting in the heavily harvested plots (see Section 5.2), likely enhancing growth of understorey vegetation, particularly stump-sprouting species, and increasing stem density in the highly harvested ZIE watershed (Table S2). At UQL, understorey density was potentially high due to new colonizing plants, as well as the preservation of preharvest vegetation that was not as heavily disturbed by harvesting operations. The heterogeneity in microhabitats caused by the harvesting operations also likely led to the higher species richness in TRE and UQL—leaving some canopy intact maintained favourable environments for already established shade tolerant species, while increased resource availability promoted the growth of overstorey tree sprouts and early successional species.
Our results are consistent with the intermediate disturbance hypothesis, which proposes that species diversity is enhanced by non-equilibrium of an environment and is greatest following a moderate disturbance (Huston, 1979). This has been demonstrated by the understorey in forest stands following beetle kill (Stone & Wolfe, 1996; Yeager & Riordan, 1953), forest fires (Grandpré et al., 1993; Hart & Chen, 2008) and harvesting (Atauri et al., 2004; Hart & Chen, 2008). However, a recent review of the effects of timber management on understorey diversity found inconsistencies in this understorey response and concluded that more studies are necessary to tease out the relationship between overstorey density and understorey diversity (Duguid & Ashton, 2013). While our data show slightly higher understorey diversity in moderately harvested areas, it is important to take these results with the caveat that preharvest data are not available for comparison. Thus, differences in understorey density, diversity, evenness and richness cannot be confidently attributed to harvesting intensity alone. Factors such as local topography, water and light availability, aspect and others may also impact community composition, independent of harvesting effects.
Redwood sprouts must also compete with recovering understorey vegetation for resources following disturbance. Studies have observed higher sprout density in stands with the lowest residual canopy density following harvesting in deciduous forests (Yanai et al., 1998), as well as in coast redwood forests (O'Hara et al., 2007). Coast redwood is known for its ability to sprout from stumps and lignotubers, giving it a competitive advantage over other conifers (del Tredici, 1998). Following disturbance, coast redwoods sprout prolifically (O'Hara et al., 2017; Olson et al., 1990). Thus, redwood stands that are managed for timber resources are often thinned to promote sprouting and growth of larger diameter trees (Boe, 1974; O'Hara et al., 2007, 2015, 2017). Within established understorey sampling plots, we observed a higher number of redwood sprouts in thinned plots as opposed to highly harvested plots. Redwoods are more likely to reproduce by stump sprouting from a ‘mother tree’ rather than via sexual reproduction (O'Hara et al., 2017). Thus, it is possible that increased access to water and light, in addition to ample redwood biomass for vegetative sprouting, promoted sprout development in the more moderately harvested watersheds in the South Fork Caspar Creek.
It is possible, however, that ecological succession could affect this regeneration pattern. Redwoods tend to aggressively close small canopy gaps, which can slow regeneration of other species in thinned or selectively logged forest stands (O'Hara et al., 2017). With time, mature trees may shade out seedlings at TRE and UQL, while seedlings at ZIE are able to grow into members of the new canopy. More work is needed to understand the relationship between harvesting intensity and redwood sprout development, as this study was not specifically designed to address the question of redwood regeneration, and preharvest data were not available.
6.2 Understorey ET rates across watersheds
In the South Fork Caspar Creek, understorey ET rates were significantly higher in intensely harvested plots than in the control plots and less intensively harvested plots. This is a causal relationship and, without pretreatment data, is does not necessarily demonstrate that the higher understorey ET rates are due to harvesting. The mean understorey ET rate was highest in the ZIE watershed (x̅ = 0.036 ± 0.024 mm/h), which had the highest soil and light resources (as measured by VWC and LI, respectively). In contrast, the control watershed WIL and lightly harvested TRE watershed had the lowest mean understorey ET rates (0.013 ± 0.0078 and 0.013 ± 0.010 mm/h, respectively). These two watersheds likewise had the lowest water and light availabilities. At WIL, the closed canopy likely reduced incoming light, lowering both vapour pressure deficit and ET rates. Although WIL and ZIE were adjacent and received similar rainfall, the soil during sampling was consistently drier at WIL compared to the harvested ZIE watershed.
Mean understorey ET rate was similar at UQL, TRE and WIL (Figure 5). Without pretreatment ET measurements, it is hard to discern actual harvesting effects on understorey ET rates. Using post-harvest basal area as a metric for treatment effect also yielded only marginal relationships with plot ET rates (Figure 6). ET is a highly complex process, and vegetation can respond quickly to changes in environmental conditions. Given that our sampling technique provided snapshot data, it is not surprising that simple differences along a basal area gradient were difficult to tease apart. Additionally, our data could not disentangle the impacts of competition among different types of vegetation. For instance, ET rates in understorey plants at the control watershed (WIL) could have been limited by competition with canopy trees, while at lightly harvested watersheds (TRE and UQL), understorey plant ET may have been limited by competition with other understorey vegetation.
6.3 Environmental and climatic controls on ET
Multiple regression modelling suggests that differences in understorey ET rates among our sites was likely due to differences in environmental conditions. In WIL, where BA was higher due to lack of recent disturbance, ET was likely limited by VWC during the dry summer months. Since the canopy cover was higher in WIL, understorey vegetation had to compete for soil water with mature overstorey and midstorey trees. Water was thus in higher demand, which was evidenced by the low soil moisture values in WIL compared to the other watersheds. In ZIE, soil moisture was more abundant possibly due to the loss of overstorey trees as a flux of water back to the atmosphere. Thus, water was not limited in the understorey, and understorey ET rates remained high despite varying VWC at the time of ET measurements. Although ZIE sprout ET rate was positively correlated with LI, the slope was small, indicating that light was also not a limiting factor in the heavily harvested watershed.
Multiple regression modelling also suggests that environmental variables, particularly light, soil moisture and temperature, vary in their impact on understorey sprout ET rates across watersheds. For example, an increase in VWC at the control watershed WIL and the moderately harvested watershed UQL accompanied an increase in sprout ET rate (Figure 7). However, an increase in VWC at the lightly harvested TRE and the intensely harvested ZIE had little effect on ET rate. This indicates that soil water was not limiting sprout ET at TRE and ZIE, but it was at UQL and WIL. In the WIL watershed, VWC decreased by 39% from June to July, compared to an average decrease of 21% across the four watersheds. Similarly, the ET rate in WIL decreased by 43% from June (x̅ = 0.016 ± 0.0092 mm/h) to July (x̅ = 0.0091 ± 0.0030 mm/h), whereas the mean decrease across all watersheds was only 23%. The change in ET rate was not as large in UQL as it was in WIL, but ET rate in UQL did decrease proportionally to VWC between sampling periods. In comparison, TRE displayed the smallest decrease in ET rate from June to July, which corresponded to the smallest decrease in VWC between June and July.
Interestingly, LI increased by 334% from June to July at ZIE yet decreased by 26% at UQL. LI increased in both TRE and WIL from June to July, albeit to a lesser degree than in the ZIE watershed. However, even though ET rate and LI at ZIE were positively correlated, mean plant ET rate at ZIE decreased by 20%. Sprout ET rate at ZIE was most strongly correlated with temperature as opposed to LI. Light intensity is positively correlated with photosynthesis and thus with transpiration. However, at high light intensity, photosynthesis reaches a maximum, called the light saturation point. At this point, increasing light intensity no longer increases photosynthesis rate. Furthermore, under high light conditions, excess energy that cannot be converted into energy via photochemistry may damage plants by producing harmful reactive oxygen compounds (Demmig-Adams & Adams, 1992). Thus, photosynthesis is less efficient at high light and may lead to decreased ET rates if stomatal closure occurs (Yang et al., 2020). This could partially explain the decrease in ET rate in ZIE from June to July.
Temperature may have also influenced the decrease in ET rates by ZIE plants from June (x̅ = 0.040 ± 0.020 mm/h) to July (x̅ = 0.032 ± 0.027 mm/h). ET increases in proportion to temperature as the kinetic energy of water is higher in warm temperatures. This relationship is apparent in both WIL and ZIE, where temperature had a strong positive overall effect on sprout ET rate (Figure 7). At ZIE, this was likely a result of the contrast in temperature between the shaded riparian plot and the sunny higher elevation plots. At WIL, where the understorey was shaded, temperature could be a limiting factor, and warm weather could increase ET if there is ample available soil water.
Multiple studies have demonstrated an increase in ET rates of Mediterranean plants during autumn wet-up and spring warm-up, while drought in the summer and cool temperatures in the winter limit photosynthesis (and thus ET seasonally) (Flexas et al., 2014). Though VWC in South Fork Caspar Creek watershed does not generally reach its minimum until fall (Dymond, Wagenbrenner, et al., 2021), understorey ET rate had already begun to decrease in late July. A decrease in transpiration and photosynthesis between early and late summer has also been demonstrated by several Mediterranean tree and shrub species in Cordoba, Spain (Quero et al., 2011). This was associated with a decrease in stomatal aperture due to increased water stress. Another study conducted in Mendocino County, California, found that peak transpiration of several tree species occurred in June and July and then steadily decreased as soils dried (Link et al., 2014). More research is needed to determine the timing of peak understorey transpiration in relation to canopy transpiration. VWC may be the primary factor controlling understorey biomass production, and thus ET, in a seasonally dry climate (Riegel et al., 1992). However, this may not be the case if the overstorey is removed or disturbed, which reduces the competition between understorey and overstorey for belowground water.
6.4 Importance of understorey ET at Caspar Creek
Using the Thornthwaite equation (Thornthwaite & Mather, 1955) and temperature data recorded at the Caspar Creek met station, PET at Caspar Creek is estimated to be approximately 0.10 mm/h in June and 0.11 mm/h in July. Water balance methods suggest that annual ET across the four study watersheds in between 2001 and 2017 ranged from 500 to 700 mm. Sap-flow data from the region indicate that transpiration rates for common overstory species (Douglas fir, Pacific madrone, live oak and tanoak) range from 140 to 182 mm/h (Link et al., 2014). While our chamber methods for estimating understorey ET cannot be directly compared to the methods used above, they can help put our understorey ET data into context and suggest that understorey species at Caspar Creek may, at times, use a large proportion of water across the landscape. As our understorey ET rates across all watersheds ranged from 0.0022 to 0.11 mm/h, scaling these values across the entire watershed may be impactful at the landscape scale. However, a more thorough sampling campaign is needed to fully quantify total understorey ET from each watershed, particularly to determine if the effect of harvesting on ET rates is real and persistent across time.
7 CONCLUSIONS
In the South Fork Caspar Creek, understorey ET was higher in logged sites than in undisturbed sites. The highest mean understorey ET rate was observed in the most intensely harvested watershed, which had been reduced in basal area by about 75% compared to the control watershed. Multiple regression modelling and marginal effect predictions indicated that ET was primarily related to VWC, temperature and light, although harvesting rate could confound the magnitude of these factors. VWC had a large impact on ET rates in the undisturbed watershed but was less of an important predictor of ET rates in the harvested watersheds. In the most intensely harvested watershed, where soil water and light were not limiting, temperature had the largest effect on ET rates. Our data causally support the general theory that soil water limits summer ET of understorey vegetation in an undisturbed forest stand, but not in a heavily harvested forest stand.
Across all watersheds, observed understorey ET rate ranged from 0.0022 to 0.11 mm/h and increased with harvesting intensity. While these values are smaller than overstorey transpiration rates in the region, our results have important implications for water management in disturbed watersheds. For instance, higher ET rates by regrowing vegetation in heavily disturbed watersheds may offset increases to streamflow typically seen after clear-cutting. As understorey vegetation may represent a significant component of the hydrologic cycle, particularly in intensively harvested forest stands, understorey water use merits greater attention in both scientific studies and in forest management decisions. Quantifying understorey and overstorey ET at the landscape scale would provide better insight into how timber harvest impacts soil water apportionment.
ACKNOWLEDGEMENTS
We thank Julia Petreshen and the Caspar Creek Watershed Experiment field team for field and technical assistance. Funding and support for this research was provided by the California Department of Forestry and Fire Protection, the USDA Forest Service Pacific Southwest Research Station and NSF-EAR-1807165.
Open Research
DATA AVAILABILITY STATEMENT
The data that support the findings of this study are openly available in the Data Repository for U of M at https://doi.org/10.13020/11c7-vc76 (Hammerschmidt & Dymond, 2020).


