Intra-annual variability and environmental controls over transpiration in a 58-year-old even-aged stand of invasive woody Juniperus virginiana L. in the Nebraska Sandhills, USA
ABSTRACT
We investigated the intra-annual variability and environmental controls over transpiration (E) in a planted, even-aged (58 years; 537 trees ha−1), experimental forest of invasive native Juniperus virginiana in the Nebraska Sandhills, with three canopy classes (dominant, co-dominant, and suppressed) by using sap flux techniques, in a year where drought was absent (2008, 34% above average precipitation). Daily E was closely linked to growing-season length and variability in the environment. Minimum and average daily air temperatures, photosynthetically active radiation, and precipitation explained the majority of the intra-annual daily variability in E. Vapour pressure deficit was a significant factor in spring and summer, shallow volumetric soil water content (VSWC 0·2 m) was important during summer particularly June, and deep VSWC (0·6 m) was a significant factor in January and August. E was highest in the dominant trees and contributed to the majority (~77%) of stand transpiration (Ec) on site because of their larger canopy size, greater tree density, more leaf area, and accessibility to water resources compared with the co-dominant and suppressed tree canopies, which contributed to 16% and 7%, respectively. Ec averaged ~413 mm year−1, corresponding to ~24% of potential evapotranspiration. Soils were significantly drier in the J. virginiana stand than in adjacent C4-dominated grasslands, which could be due to the longer growing season over which physiological activity extends in J. virginiana compared with C4-dominated grasslands in the region and precipitation interception by the canopy and forest floor, which evaporates before reaching the soil. Copyright © 2012 John Wiley & Sons, Ltd.
INTRODUCTION
At 50 000 km2, the semi-arid warm-season (C4) grasslands of the Nebraska Sandhills are considered the largest stabilized sand dune formation in the Western Hemisphere (Bleed and Flowerday, 1998). Recent shifts in plant community composition, especially trends of increased woody species abundance, have been observed in these grasslands and elsewhere in the Great Plains of the United States (van Els et al., 2010; Wilcox, 2010; Ratajczak et al., 2011). The increased establishment and success of woody species have been attributed to overgrazing, fire suppression, climate change, nitrogen deposition, landscape fragmentation, land management, seed dispersal, and natural species expansion, or any combination thereof (Fredrickson et al., 2006; Briggs et al., 2007; Bradley and Fleishman, 2008; Volder et al., 2010; Ratajczak et al., 2011).
The native coniferous eastern redcedar (Juniperus virginiana L.) is one of the most rapidly encroaching woody species in the Nebraska Sandhills and other regions of the Great Plains (Schmidt and Stubbendieck, 1993; van Els et al., 2010), impacting approximately 7 million ha of grasslands in its western distribution in the eastern Great Plains (McKinley et al., 2008). The fast and extensive expansion of J. virginiana and the resulting shifts in vegetative cover have been a major concern in affected areas (McKinley and Blair, 2008). Vegetation shifts from C4-dominated grasslands to closed-canopy forests have led to changes in the photosynthetic pathway of the dominant species (i.e. from C4-dominated grasslands with high photosynthetic capacity and relatively a short growing season to C3 conifers with low photosynthetic rates but a longer growing season; Eggemeyer et al., 2006, 2009); altered environmental controls over plant growth and productivity, with large increases in aboveground productivity in forests relative to grasslands; and decreased species diversity during the transition from grasslands to forests (Van Auken, 2008). These shifts are expected to result in significant changes in ecosystem processes with major biogeochemical and ecohydrological consequences (Wilcox, 2010).
Ecohydrological changes have been particularly worrisome in semi-arid areas such as the Great Plains (Heilman et al., 2009). Shifts in vegetation cover and associated changes in species composition, vegetation structure, and root and litter characteristics can significantly alter the water balance through their impacts on transpiration rates, precipitation interception (Tabacchi et al., 2000; Owens et al., 2006), and soil permeability and the resulting water infiltration (Huxman et al., 2005; Volder et al., 2010). There has been a general agreement in the literature that increases in woody vegetation abundance, basal area, and leaf area increase evapotranspiration rates in an ecosystem (Bosch and Hewlett, 1982; Farley et al., 2005) and potentially reduce available soil water and groundwater recharge (Huxman et al., 2005). On the other hand, removal of vegetation has been found to increase water yield in several ecosystems (e.g. Zhang et al., 2001; Robinson et al., 2003; Andreassian, 2004; Farley et al., 2005; Huxman et al., 2005; Jackson et al., 2005; Wilcox et al., 2005; Wilcox and Thurow, 2006). In the Nebraska Sandhills, Eggemeyer et al. (2009), and Wedin and Awada (unpublished data) found that J. virginiana was capable of depleting water deep in the soil profile, leading to considerably drier soils in areas occupied by J. virginiana compared with open grasslands during years of below average precipitation (<570 mm). J. virginiana success in this semi-arid environment was attributed to its drought tolerance (Willson et al., 2008; Bihmidine et al., 2010), together with its long growing season, relatively low transpiration rates, and ability to extract water from both the saturated and unsaturated soil profiles (Eggemeyer et al., 2009). Studies conducted on the ecophysiology of J. virginiana and its potential impact on the ecohydrology in the Nebraska Sandhills and elsewhere have focused on years of average or below average precipitation (e.g. Eggemeyer et al., 2006, 2009; Landon et al., 2009; Volder et al., 2010). The aim of this study is to determine the intra-annual variability and environmental controls over transpiration rates in a planted even-aged (58 years) J. virginiana experimental forest with three canopy classes using sap flux techniques. This study was carried out in a year of above average (34% more) precipitation. Understanding environmental controls over tree transpiration rates and water balance in a wide spectrum of precipitation conditions is critical for the parameterization of comprehensive ecohydrological models and watershed management (Wilcox, 2010). Specifically, the objectives of this study are to (1) understand the intra-annual dynamics of and environmental controls over transpiration rates in an even-aged J. virginiana stand with three canopy classes (dominant, co-dominant, and suppressed) by using sap flux techniques; (2) determine the contribution of each canopy class to stand transpiration; and (3) address the potential ecological implications of J. virginiana expansion on the ecohydrology in the semi-arid grasslands of the Nebraska Sandhills.
MATERIALS AND METHODS
Study area
The study was conducted in 2008 at the Nebraska National Forest (NNF), Halsey, Nebraska, USA (825 m altitude, lat. 41°51′45″ N, long. 100°22′06″ W). The NNF is an experimental forest established in the semi-arid Sandhills grasslands of Nebraska and was hand-planted with coniferous species, mainly J. virginiana and Pinus ponderosa C. Lawson. Plantings started in 1910s and continued for several decades. The documented site history and the relatively uniform soils at the NNF make it uniquely suited to address the issue of tree expansion and encroachment in the Great Plains and other semi-arid grasslands.
Climate on site is semi-arid continental, with a mean annual precipitation of ~570 mm, 75% of which falls during the growing season (April–September). Mean annual temperature is 8·4 °C. The mean minimum temperature in January is ~−14 °C, and the mean maximum temperature in July is ~31 °C. Soils are Valentine fine sand (mixed, mesic Typic Ustipsamments) with deep loose sandy well-drained soils.
Site characteristics
A 58-year-old J. virginiana stand was selected for the study, and a 40 × 40 m area was marked. Stand density was 537 trees ha−1 in the study area, basal area was ~7·9 m2 ha−1, and the leaf-area index (LAI, LI2000, LI-Cor inc., Lincoln, NE, USA) ranged between 1·43 to 1·83. Basic tree and site inventory measurements are presented in Table 1. There was little to no growth of other understory species with the exception of occasional Opuntia spp. (cacti) and scattered individuals of Carex spp. (sedges). Twenty-two trees representing the three canopy classes on site (dominant, co-dominant, and suppressed, Table 1) were initially selected for measurement of tree transpiration using sap flux technique. Following data quality control procedure, a total of 14 trees were finally selected for inclusion in the statistical analysis. The exclusion of the eight trees from the analysis and the observed gaps in the data in figures were due to power interruptions, sensor failure, sensor replacement in spring, very narrow bands of conductive xylem in some of the suppressed individuals, and/or very large deviation from the overall mean within a canopy class.
| Dominant | Co-dominant | Suppressed | |
|---|---|---|---|
| Density (trees ha−1) | 356 | 100 | 81 |
| Tree basal area (m2 ha) | 6·04 (76·5%) | 1·58 (20%) | 0·27 (3·5%) |
| Site average DBH (m) | 0·14 ± 0·0026 | 0·096 ± 0·0017 | 0·068 ± 0·0034 |
| DBH of measured trees (m) | 0·16 ± 0·003 | 0·12 ± 0·001 | 0·08 ± 0·003 |
| Height of measured trees (m) | 8·4 ± 0·15 | 6·9 ± 0·21 | 5·3 ± 0·37 |
| Distance of live branches from the ground (m) | 1·91 ± 0·18 | 1·79 ± 0·15 | 3·2 ± 0·2 |
| % green canopy of total tree height | 77·23 ± 1·6 | 74·05 ± 3·6 | 39·6 ± 4·1 |
| Sap flux measurements (no. of trees)a | 7 | 5 | 2 |
| Sapwood area (m2 ha−1)b | 3·45 | 0·68 | 0·21 |
- a Sensors were originally installed in 22 trees; however, a total 14 trees were finally included in the statistical analysis.
- b Sapwood area was determined by using allometric relationship developed by coring the studied as well as representative trees from the site (Kumagai et al., 2008). Equation and parameters are detailed in Oishi et al. (2008).
Micrometeorological measurements
A weather station was installed on site and was mounted with temperature and relative humidity probes (CS500 Campbell Scientific Inc., UT), two tipping bucket rain gauges (TR-525 M-R3, Texas Electronics, Inc., TX), a quantum sensor (LI190SA LI-Cor Inc., Lincoln, NE), and wind sentry (12005 3-cup anemometer and 12002 gill microvane, RM Yong Company, MI). Two replicate sets of soil moisture sensors (ML2 Theta Probe, Dynamax Inc., TX) along with soil temperature probes (TCAV, Campbell Scientific Inc., UT) were installed at soil depths of 0·2, 0·4, and 0·6 m. Measurements were taken every 15 s and stored as half-hourly means on a datalogger (CR10X, Campbell Scientific Inc., UT). Volumetric soil water content (VSWC %) in the upper 2 m of the soil profile was measured on site and in adjacent grasslands by using the TRIME FM (IMCO, Germany) system with access tubes. Weather data from the station on site were validated against a station at Halsey, NE (High Plains Regional Climate Center, HPRCC, University of Nebraska, UNL; http://www.hprcc.unl.edu). Daily Penman potential evapotranspiration (ETp, mm day−1) were provided by the HPRCC. Penman ET values were multiplied by crop coefficient for well-watered perennial herbaceous vegetation (Medicago sativa) to calculate the ETp used here. Details on the equation and functions used can be found at http://www.hprcc.unl.edu/awdn/et/.
Sap flux measurements and sapwood areas
 (1)
(1) (2)
(2) (3)
(3)For the estimation of annual Ec, missing daily means for trees in the suppressed canopy (~45%) were calculated based on the Js rates derived from the smaller trees in the co-dominant class; this was acceptable because suppressed trees represented a very small percentage of the total sapwood area on site (Table 1), and Js in suppressed and select smaller co-dominant trees did not differ significantly. For the other two classes, missing dates (~14%) for which we have no data for were filled with standard methods (Kumagai et al., 2007; Oishi et al., 2008).
Statistical analysis
Data were analysed using the mixed model procedure in SAS statistical package (SAS Institute, Cary, NC). The size of the data set required that average daily measurements be used for the analysis instead of individual half-hour data. Categorical variables for DBH were integers. Each DBH was classified into its nearest integer category. Four seasons, winter (1 December to 29 February, day of year, DOY, 336–60), spring (1 March to 30 April, DOY 61–121), summer (1 May to 31 August, DOY 122–244), and fall (1 September to 30 November, DOY 245–335) were defined for the data set. A multiple regression approach was used where all environmental variables were fitted as covariates and a stepwise regression selection method was used to detect the variables, which explained the most variability in transpiration. The multiple regression approach was first performed on the entire daily data set and then performed within each season. Because the data consisted of repeated measurements on the same set of trees over an extended period (time series), repeated measure analysis was performed in SAS, where a tree was fitted as a random effect and the error was considered to have a variance covariance structure. After all data corrections, there were at least 100 daily averages for each of the trees (i.e. suppressed trees). This limited the use of different variance covariance structures of the error term to the first auto-regressive structure because this structure estimates one covariance error structure for all trees and all measurements in time. Other structures were considered as well such as compound symmetry, Toeplitz, unstructured, but all structures other than the first auto-regressive structures failed to converge. The models were run on the overall data at first, then on canopy class, seasons, and months.
RESULTS AND DISCUSSION
Environmental parameters
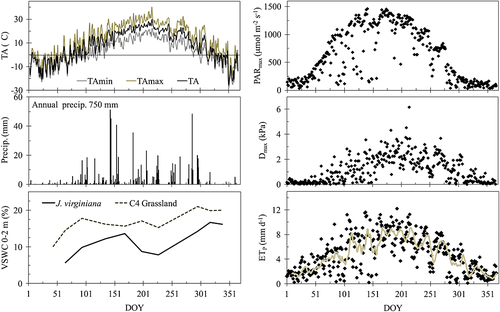
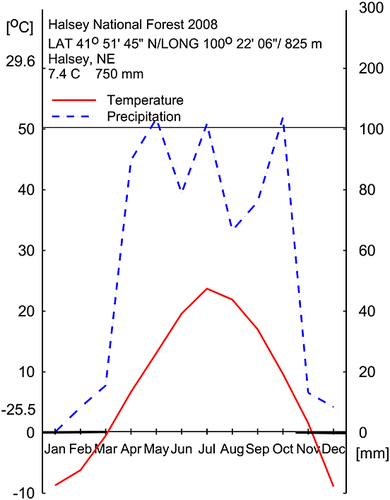
Environmental data for the study period are presented in Figures 1 and 2. The annual average air temperature (TA) on site was 7·5 °C. Seasonal trends in TA were consistent with the 30-year average for the area, reaching a maximum in August (>30 °C) and a minimum in December and January (<−20 °C). Cumulative annual precipitation was 750 mm, 34% above the long-term average of ~570 mm. The climate diagram (Figure 2) shows the absence of drought during the study period. Seasonal variability in TA, PAR, and D resulted in low potential evapotranspiration (ETp) during late summer, fall, and winter months (ETp 489 mm) and high ETp between June and August (ETp 1241 mm, between DOY 125–235). VSWC measured monthly in 2 m deep soil access tubes (Figure 1) indicated that soils in the J. virginiana stand were consistently and significantly (p < 0·05) drier than those in the open grasslands of the NNF. We ran an orthogonal contrast in SAS on the observed trends, and results showed that the seasonal trend of VSWC in grasslands differed significantly from that in the J. virginiana stand (p < 0·05). Noticeable was the steep decline in VSWC between the second half of June and mid-August (DOY 170–215) observed in the J. virginiana stand but not in the adjacent grasslands. This steep decline correlates well with the increase of ETp. Although drier soils in the J. virginiana stand relative to adjacent grasslands were expected and observed in years with average or below average precipitation (Wedin and Awada, unpublished), it was surprising to observe that recovery was slow and trend persisted in years where precipitation was well above average. Volumetric soil water content throughout the year, however, was significantly higher than what has been observed in earlier parts of the decade when drought periods typically started in July and ended in October (e.g. Eggemeyer et al., 2006, 2009). Hourly VSWC data recorded with soil moisture probes at 0·2, 0·4, and 0·6 m depth showed similar seasonal trends (data not shown) as the average 2 m deep VSWC results in Figure 1. The hourly data at specific depths were used in the statistical analyses of the tree transpiration data (Table 2).
| Source | TA | Tmin | Tmax | Tsoil | RH | D | Dmax | PAR | Precip | SM 0·2 | SM 0·4 | SM 0·6 | DBH | |
|---|---|---|---|---|---|---|---|---|---|---|---|---|---|---|
| Season | Winter | * | *** | * | * | ** | * | |||||||
| Spring | * | * | ** | * | * | ** | ||||||||
| Summer | *** | ** | * | * | * | ** | * | * | ||||||
| Fall | * | * | ** | |||||||||||
| Month | January | * | *** | * | * | * | * | |||||||
| February | *** | |||||||||||||
| March | * | * | * | |||||||||||
| April | * | * | * | ** | ||||||||||
| May | * | * | ||||||||||||
| June | * | ** | ** | * | ** | ** | * | * | ||||||
| July | * | * | * | *** | * | |||||||||
| August | ** | *** | * | * | * | * | ** | *** | * | |||||
| September | * | * | * | * | * | |||||||||
| October | * | * | * | * | * | * | * | * | ||||||
| November | * | * | * | |||||||||||
| December | * | * | *** | |||||||||||
- Only significant interactions are displayed (* = significant at p < 0·05; ** = significant at p < 0·01; *** = significant at p < 0·0001).
Transpiration and the environment irrespective of canopy class
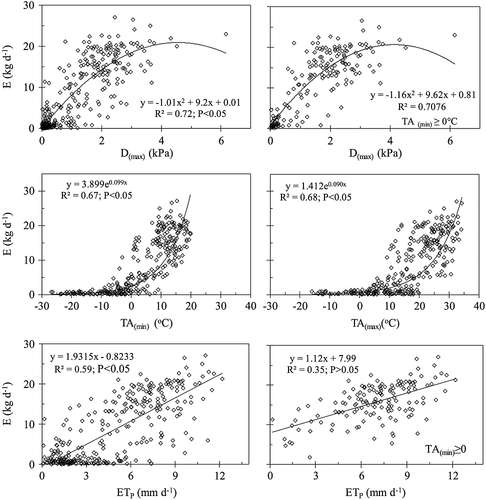
Repeated measures analysis of variance for daily transpiration rates (E) over the 1-year study period showed significant seasonal variability (Table 2, Figure 3), which was closely linked to growing-season length, seasonal variability in the environment, changes in leaf area, physiological capacity of the plants in terms of stomatal control, and plants genetically based endogenous rhythms (Falge et al., 2002; Awada et al., 2003). Transpiration in winter was minimal except on days where TAmin was close to or >0 °C and TAmax was >0 °C. TAmin was the most significant (p < 0·0001) factor controlling E during winter months (defined here from December through February, DOY 336–60), followed sequentially by precipitation (p < 0·01), then by average daily PAR, TA, and deep (0·6 m) soil water content (p < 0·05). Brümmer et al. (2012) stated that temperature and water availability are the main factors determining the rates of E and consequently carbon assimilation in a temperate ecosystem. The E trend observed in this study complements the leaf level gas exchange measurements in J. virginiana trees at NNF, where mature trees maintained positive photosynthetic rates at temperatures >0 °C (Eggemeyer et al., 2006) and effectively utilized water from the deep unfrozen soil layers (investigated using oxygen and hydrogen isotopes; Eggemeyer et al., 2009). Spring season (March and April, DOY 61–121) showed a slight increase in E with the improvement in environmental conditions, specifically PAR, TA, TAmin, RH, D, and precipitation (Table 2, Figure 4). However, we observed a lag in seasonal E relative to PAR, which is explained by the lag of D behind PAR in some forested areas (Brümmer et al., 2012). Winter and spring water uptake observed in this study together with positive photosynthesis (Eggemeyer et al., 2006) indicates a potential ecosystem carbon gain and water loss to transpiration while grasses are dormant (Richardson, 1998; Law et al., 2002). Highest rates of E were observed during summer months (May through September, DOY 125–275) and were positively and significantly associated with higher temperatures, PAR, and D (Table 2). Availability of water in the top 0·2 m of the soil profile was also important during the summer particularly in June, while availability of deeper soil water (0·6 m) was a significant factor for E especially in August. These results are in agreement with what has been reported by Eggemeyer et al. (2009), where J. virginiana trees exhibited significant seasonal plasticity in sources of water uptake, acquiring water from shallow soil profiles (0·05–0·5 m) early in the growing season when water was available in these layers and progressively increasing the fraction taken up from deeper layers as the season progressed, showing little responsiveness to growing-season precipitation events. Rates of E declined in the fall (October through November, DOY 276–335), as expected in response to declines in PAR and TA. Regressing daily average E against TAmin, TAmax, Dmax, and ETp (Figure 4) showed a high and significant response of E to seasonal increases in these parameters. E showed a weak response to increases in ETp when TAmin was ≥0 °C (i.e. during the growing season, Figure 4). This could be attributed to the coupling of high D with a decline in stomatal conductance and consequently E (Bihmidine et al., 2010; Brümmer et al., 2012).
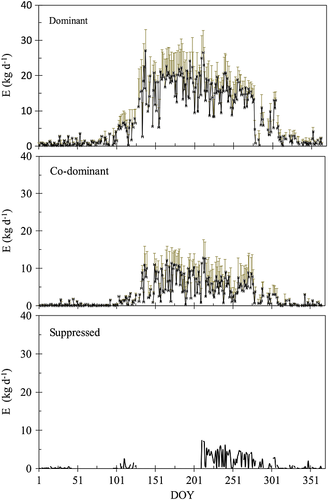
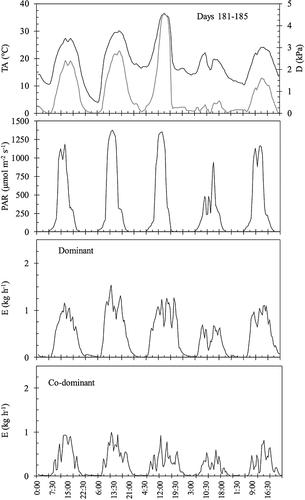
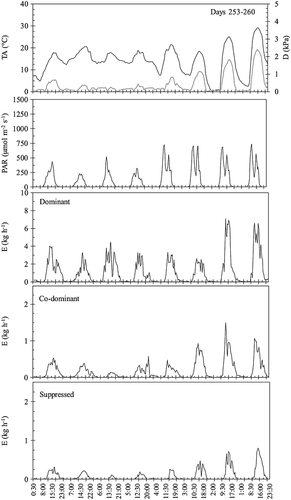
Two representative sample periods were selected during the growing season to illustrate diurnal courses of E in the three canopy classes (dominant, co-dominant, and suppressed); DOY 181–185 (29 June–3 July, Figure 5) and DOY 253–260 (9–16 September, Figure 6). Diurnal courses were not presented for trees in the suppressed canopy for DOY 181–185 (data for suppressed canopy did not pass the quality control during this period). Daily sap flow trends were generally bell-shaped independent of canopy class, increased in the morning in response to increase in PAR, and declining in the afternoon with the decrease in light intensity. Midday variability in E was associated with variability in PAR, TA, and D. Daily sap flow as a function of precipitation and soil moisture were not significant and therefore not presented in Figures 5 and 6.
Transpiration and canopy class
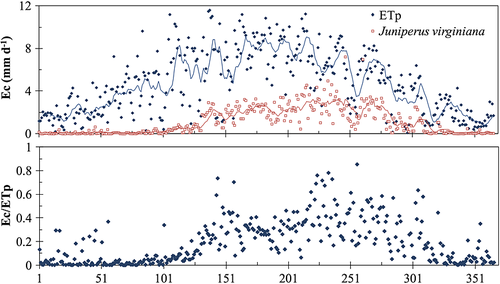
The dominant canopy class represented ~66% and 80% of the total tree density and sapwood area on site, respectively, while the co-dominant class represented ~19% and 15% and the suppressed class represented ~15% and 5% of total trees and sapwood areas on site, respectively. Transpiration rates differed significantly between canopy classes (p < 0·05, Table 1, Figures 3, 5, 6, and 7). Maximum E rates observed on a tree basis did not exceed 25 to 27·4 kg day−1, in the dominant class, compared with the tree maximum rates of 15–19 kg day−1 and 5–7·3 kg day−1 observed in the co-dominant and suppressed classes (Figure 3). Daily values of E in J. virginiana on a tree basis in this study were significantly lower than the reported 48–62 l day−1 in a riparian area of Nebraska (where water is not limited, 844 mm year−1 during the year of study; Landon et al., 2009), but are consistent with values reported for other Juniperus species (e.g. Lane and Barnes, 1987; Dugas et al., 1998; Leffler et al., 2002; Bendevis et al., 2010; Huddle et al., 2011). The significantly higher tree transpiration rates in the dominant compared with the co-dominant and suppressed classes were due to both their larger size and % green canopy, and greater access to light and presumably soil resources. The annual calculated stand transpiration rate (Ec) was ~413 mm year−1 (43% of ETp), of which ~77% was attributed to the dominant, 16% to the co-dominant, and 7% to the suppressed canopy class (Figure 7). This supports findings from other studies that showed the larger and dominant trees on sites contribute to the majority of site transpiration (e.g. Granier et al., 2000; Schaeffer et al., 2000; Oishi et al., 2008). The comparatively low transpiration rates in this and other studies (e.g. Eggemeyer et al., 2009; Bendevis et al., 2010) reflect conservative water use in Juniperus, which allows survival in dry areas. However, the evergreen nature and longer growing season of Juniperus may offset the relatively low water daily uptake on an annual basis.
Ecological implications
The impact of vegetation cover change, particularly the encroachment of woody species on local and regional water balance in semi-arid grasslands of the Great Plains, has been of great interest and debate over the last decades given its importance to the ecology and economy of this region. Our results have shown that the majority of E was from the dominant canopy class on site because of their larger size and leaf area, and accessibility to resources compared with the co-dominant and suppressed canopy. Furthermore, soils were significantly drier in the J. virginiana stand than in the adjacent C4-dominated native grasslands despite the fact that measurements were acquired in a year where precipitation was 34% above long-term average. While there are several factors that might contribute to the depletion of water in the soil profile and thus potential groundwater recharge, we believe that in our case, two factors can be singled out as being most significant; the longer growing season over which physiological activity extends in J. virginiana compared with C4-dominated grasslands in the region (Eggemeyer et al., 2006, 2009; and in Figure 7 Ec relative to ETp) and precipitation interception by the canopy and forest floor, which evaporates before entering the soil (Savenije, 2004; Owens et al., 2006). Intercepted precipitation rates, while species-specific, can be significant and is a function of tree architecture, site density, and rainfall intensity. The scale-like leaf structure and retention of numerous dead branches beneath live canopy can make Juniperus species ideally suited for intercepting and retaining precipitation. Owens et al. (2006) measured a semi-arid Juniperus stand and reported that precipitation events of ≤5 mm failed to reach the ground, and low intensity precipitation of ≤13 mm was largely intercepted by juniper (>60%), while only 20% of high intensity rainfall (>70 mm) was intercepted by canopy and forest floor. Thus, a large amount of precipitation in Juniperus stands may be held by canopy or forest floor and evaporate before it can be used for transpiration by trees. Using our rainfall data and equations from Owens et al. (2006), we estimated that 40% of the rainfall failed to reach the soil at our Juniperus site during the study period. If this is correct, then effective precipitation would have been 450 mm (60% of 750 mm annual precipitation on site for 2008), compared with an estimated 615 mm of effective precipitation in nearby grasslands (assuming 18% canopy interception of precipitation; Thurow et al., 1987). If this were the case then, a total 712 mm would have been lost to evapotranspiration (~95% of incoming precipitation) over the 1-year study period from the Juniperus stand, compared with the reported 250 to 650 mm (or 80% to 85% of incoming precipitation) of evapotranspiration in native grasslands ecosystems in the Great Plains [reported rates vary with grassland type, environmental conditions, and annual average precipitation (Law et al., 2002; Meyers, 2001; Frank, 2003; Burba and Verma, 2005; Brümmer et al., 2012)]. Overall, we are in agreement with Bond (2008), who stated that, ‘(forest) trees with their lower albedo, higher stand evapotranspiration rates because of their extensive roots, greater leaf area, higher canopy precipitation interception and evaporation compared to C4-dominated grasslands will alter water balance in the system’. Our results confirmed this, even in a year of 34% above average precipitation; soils in the J. virginiana remained significantly drier than in adjacent grasslands. Given the predicted climate variability and extremes for the region, it is imperative to continue to evaluate the role of vegetation and vegetation shifts in the ecohydrology and water balance and their feedback on ecosystem services.
ACKNOWLEDGEMENTS
This study was supported by the McIntire-Stennis Forest Research Funds-USDA. We are grateful to Jeremy Hiller and Casey Cain for their field and laboratory assistance, and to Dr K. Hubbard and the staff of High Plains Regional Climate Center, University of Nebraska, for sharing their weather and ETp data. Rita El-Hage would like to acknowledge a graduate fellowship provided to her by the Mediterranean Agronomic Institute of Chania, Crete-Greece. We would like to thank the reviewers for their constructive comments on the manuscript.


