Small- to medium-sized mammals show greater morphological disparity in cervical than lumbar vertebrae across different terrestrial modes of locomotion
Abstract
During mammalian terrestrial locomotion, body flexibility facilitated by the vertebral column is expected to be correlated with observed modes of locomotion, known as gait (e.g., sprawl, trot, hop, bound, gallop). In small- to medium-sized mammals (average weight up to 5 kg), the relationship between locomotive mode and vertebral morphology is largely unexplored. Here we studied the vertebral column from 46 small- to medium-sized mammals. Nine vertebrae across cervical, thoracic, and lumbar regions were chosen to represent the whole vertebral column. Vertebra shape was analysed using three-dimensional geometric morphometrics with the phylogenetic comparative method. We also applied the multi-block method, which can consider all vertebrae as a single structure for analysis. We calculated morphological disparity, phylogenetic signal, and evaluated the effects of allometry and gait on vertebral shape. We also investigated the pattern of integration in the column. We found the cervical vertebrae show the highest degree of morphological disparity, and the first thoracic vertebra shows the highest phylogenetic signal. A significant effect of gait type on vertebrae shape was found, with the lumbar vertebrae having the strongest correlation; but this effect was not significant after taking phylogeny into account. On the other hand, allometry has a significant effect on all vertebrae regardless of the contribution from phylogeny. The regions showed differing degrees of integration, with cervical vertebrae most strongly correlated. With these results, we have revealed novel information that cannot be captured from study of a single vertebra alone: although the lumbar vertebrae are the most correlated with gait, the cervical vertebrae are more morphologically diverse and drive the diversity among species when considering whole column shape.
1 INTRODUCTION
A defining feature of vertebrates, the vertebral column is a key anatomical structure allowing mammalian species to diversify in body shape and thus have diverse modes of locomotion and be successful in occupying terrestrial, aquatic, and aerial environments. The serially homologous vertebrae, each linked by a fibrocartilaginous intervertebral joint, allow each adjacent pair of vertebrae, and ultimately the animal's body, to bend in all six degrees of freedom of motion (dorso-ventral bending, left–right lateral bending, and left–right axial rotation). The number of presacral vertebrae is usually conserved within each evolutionary clade (e.g., 27 presacral count in Ferae, or 26 in Euarchonta and Glires; Galis et al., 2014; Li et al., 2023) giving evidence for the evolutionary stasis theory (Hansen & Houle, 2004; Williams et al., 2019). However, the morphology of mammalian vertebrae is highly variable along the whole column and is the most differentiated among all amniotes (Head & Polly, 2015), particularly in the presacral region (Jones, Angielczyk, et al., 2018). Collectively the whole vertebral column functions to support body motion and stance. Regarding locomotion, it is the thoracolumbar region that provides an attachment for large epaxial musculature necessary for body mobility and stability (Schilling & Carrier, 2010) and has an important role in storing and releasing elastic energy for locomotion when the vertebral column is flexed and extended (Alexander et al., 1985; Koob & Long, 2000). Flexibility of the vertebral column results from the accumulation of several small motions from each pair of vertebrae, which in turn are dependent on vertebral morphology (Argot, 2003; Sargis, 2001).
Recent studies in vertebral column research have mostly focused on ecomorphology (sensu Karr & James, 1975) with an aim to better understand the evolution of vertebral shape and its correlation to locomotion. Several studies have investigated morphological variation among mammalian species across a range of modes of locomotion: terrestrial, arboreal, scansorial, gliding, flying, and aquatic. Findings show that individual vertebra morphology and the number of vertebrae are variable among locomotion modes, mostly within the thoracolumbar region. The lumbar vertebrae showed the highest correlation with a species' mode of locomotion (Da Silva Netto & Tavares, 2021; Figueirido et al., 2023; Granatosky et al., 2014; Jones & Pierce, 2016; Randau et al., 2017). Morphology of vertebrae was commonly found to vary in the size and shape of the spinous and transverse processes, for example, more robust shape in arboreal species than in terrestrial species (Da Silva Netto & Tavares, 2021), and in centrum size (e.g., cranio-caudally shorter and dorso-ventrally deeper in large, dorso-stable runners, Jones, 2015b). In addition, allometry is usually a strong influence on the vertebral column, but it can be confounded by phylogeny and mode of locomotion; generally in mammals, the vertebral shape of terrestrial locomotors follows an allometric scaling, but not for the aquatic locomotors (Jones & Pierce, 2016). In Felidae, when comparing terrestrial, scansorial, and arboreal locomotors, the total vertebral column length shows a negative allometry – larger species have shorter column to increase body stiffness – but the allometric effect can be lost (Randau et al., 2016) or retained (Jones, 2015b) after correcting for phylogeny. In contrast, in spiny rats (Family: Echimyidae), comprising terrestrial, arboreal, semi-aquatic, and semi-fossorial locomotors, the morphological variation of the penultimate lumbar vertebra was not mainly driven by allometric scaling, but instead by locomotive ecology (Da Silva Netto & Tavares, 2021). The strong impact of phylogeny, as indicated by the significant phylogenetic signal, was also observed in these abovementioned studies. So, by focusing on one mode of locomotion, in this case, the terrestrial mode, that is used by many mammalian species, a deeper understanding of the vertebral shape variation and how it relates to allometric scaling and phylogeny can be made with the reduced effect of specialised morphology.
Locomotion mode of terrestrial mammals varies in the pattern of footfall when an animal walks or runs, known as gait (Hildebrand, 1974). Five main gaits are observed in mammals when they move quickly: sprawl, a quadrupedal lateral-bending-based gait that is used exclusively in monotremes; bipedal hop, a bipedal symmetric gait in which only a pair of hindfeet land at the same time; trot, a quadrupedal symmetric gait in which a forefoot and a hindfoot of the different side land at the same time; bound, a quadrupedal symmetric gait in which either a pair of forefeet or hindfeet land at the same time; and gallop, a quadrupedal asymmetric gait in which all four feet land at different time (Dagg, 1973; Hildebrand, 1974). The use of terrestrial gait is optimised for speed (e.g., from walk to trot or bound, and to gallop as the travel speed increases), and such gait-switching behaviour is demonstrated in both large and small body sized mammals (Hoyt & Taylor, 1981; Pridmore, 1992; Webster & Dawson, 2003; Williams, 1983). The vertebral column has been observed in vivo to vary in the degree of flexibility when an animal performs different gaits (Jones & German, 2014; Schilling & Hackert, 2006). In comparative studies, variation in vertebral shape of species with similar modes of locomotion has been studied in various medium-to-large body size mammals such as macropods (Chen et al., 2005), felids (Randau et al., 2017), and equids (Jones, 2016a). One study on felid vertebral columns hypothesised that the regions could be driven by different selective pressures; vertebrae that were more craniad in the column were more phylogenetically conserved, while those more caudad in the column (particularly the lumbar region) were more ecologically variable (Randau et al., 2017). These findings were also supported in macropods (Chen et al., 2005). For smaller mammals less is known about morphological variation relating to gait. One study of shape variation in a single vertebra, the penultimate lumbar vertebra, among small mammals showed shape was not necessarily impacted by speed as found in larger sized mammals (Álvarez et al., 2013). Another study demonstrated increased growth resulting in longer lumbar regions in species with a half-bounding gait (Jones & German, 2014). Further research on the whole vertebral column from a diversity of small mammals is needed to better understand how locomotory mode influences the vertebral column.
Previous studies have performed their analyses of shape variation of individual homologous vertebrae, considering each vertebra in turn when studying multiple from the same column. This is because geometric morphometric methods are not suitable for multi-part, articulated, and moveable structures (but see Vidal-Garcia et al., 2018 and Rhoda et al., 2021 for different solutions). The recently available technique of multi-block method for morphometric purposes (Thomas et al., 2023) serves as a suitable method for evaluating patterns of shape variation among multiple elements simultaneously, such as different vertebrae from a vertebral column. This approach has the benefit that the shape of all vertebrae can be examined together, irrespective of the shape of the articulated column from which they come.
Using both single- and multi-vertebrae approaches, we aim to examine the morphology of vertebral columns in 46 small- to medium-sized terrestrial mammals with diversity in gait, using species from all three mammalian subclasses. We studied the shape of nine vertebrae covering cervical, thoracic, and lumbar regions using geometric morphometrics. Through the utility of phylomorphospaces (sensu Sidlauskas, 2008) representing individual vertebrae and the whole column, we tested the following predictions of vertebral shape diversity as found in medium- to large-sized mammals: lumbar vertebrae are the most variable, and have the strongest correlation with locomotory mode (Chen et al., 2005; Granatosky et al., 2014); all vertebrae will exhibit significant evolutionary allometry (Jones, Benitez, et al., 2018; Randau et al., 2016); the middle thoracic vertebra will have the highest phylogenetic signal (Jones, Benitez, et al., 2018). Since the vertebrae operate together for a functional backbone, it is important to also consider the degree to which vertebrae are morphologically integrated (sensu Olson & Miller, 1999). The strength of integration between structures is expected to influence macroevolution of phenotypes yet it remains unclear how integration influences morphological disparity and how it evolves (e.g., Felice et al., 2018; Sherratt & Kraatz, 2023). Therefore, we measured the relative similarity of the phylomorphospaces of each vertebra to make inferences on patterns of integration among vertebrae, and we discuss how these relate to the results observed for disparity and phylogenetic signal.
2 METHOD
2.1 Specimens and species
One adult individual from each of the 46 mammalian species was used for this study, spanning seven placental families, seven marsupial families, and two monotreme families. The sex of the specimens was not accounted for, as this information is rarely given on the museum specimens. We acknowledged that some of our taxa exhibited sexual size dimorphism (Tombak et al., 2024); however, we assumed that the degree of sexual dimorphism within species is less than the difference among species. We defined the size class of the species following Njoroge et al. (2009) and Renison et al. (2023): ‘small’ for species average weight of less than 2 kg, ‘medium’ for 2–5 kg, and ‘large’ for more than 5 kg. The taxonomic sampling was focused on small-to-medium terrestrial mammals of average size less than 5 kg, with seven species whose average weights were over 5 kg chosen to relate the results to existing studies on medium-to-large land mammals. The body weight of each species was obtained from Smith et al. (2016). The specimens were sourced from museum collections and supplemented with existing X-ray computed tomography (CT) scans available in the online repository MorphoSource (morphosource.org). The information about the species included in this study is detailed in Appendix 1: Table A1.
For museum specimens, they were scanned using a medical X-ray CT scanner (SOMATOM, Siemens Inc.) and a photon-counting CT (PCCT) scanner (NAEOTOM Alpha, Siemens Inc.) at Jones Radiology, Adelaide, South Australia. The use of two scanners was due to an infrastructure upgrade during the course of the study. Digital three-dimensional (3D) models of the vertebral column were reconstructed from the CT scan slice images (DICOM and TIFF format) using 3D Slicer 5.4.0 (3D Slicer, 2023; Fedorov et al., 2012).
2.2 Phylogeny and locomotive abilities
A time-calibrated phylogenetic tree for the 46 species was pruned from the online database (vertlife.org), which is derived from the mammal phylogeny by Upham et al. (2019a) and Upham et al. (2019b). The taxonomic grouping equivalent to family level, which still satisfied the monophyletic grouping, was used as a factor for subsequent statistical analyses. The phylogenetic relationship of the species in this study is shown in Figure 1.
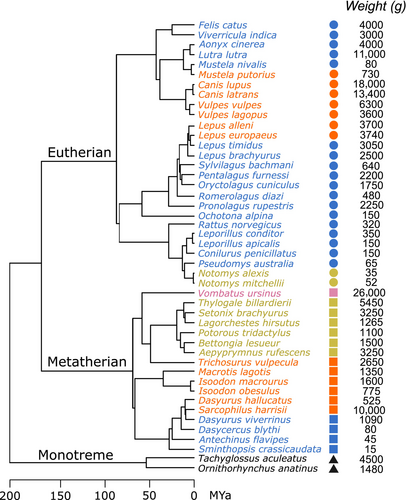
The locomotive mode of each species was represented by the gait that the animals use when they move quickly. Since an animal can use several gaits, we decided to include only the gait type that reflected the quickest movement of the species. Five fast gaits were identified: sprawl, trot, hop, bound, and gallop. The information source of each species is provided in Appendix 1: Table A1. We only used this locomotive classification rather than the other classification (e.g., cursor, ambulator, bounder, etc.) as in Álvarez et al. (2013) because the species were categorised in the same way. A finer gradation of gait was not possible (e.g., half-bound, rotary/transverse gallop) because publicly available footage of small animals running does not show the feet landing pattern necessary for this classification, and many species in this study have not been studied in this respect.
2.3 Vertebrae shape
Vertebrae were identified following the standard regionalisation pattern: cervical contains the first seven vertebrae free from thoracic ribs; thoracic has the vertebra with costal fovea for rib bearing; and lumbar has well-developed transverse processes and free from ribs (Evans & De Lahunta, 2013). To ensure the occurrence and positional homologue of each vertebra in every species, we selected nine vertebrae to represent the vertebral shape along the column: atlas (C1), axis (C2), third cervical (C3), sixth cervical (C6), first thoracic (T1), numerically middle thoracic (T-mid), diaphragmatic thoracic (T-diaph), lumbar at one-third position (L1/3), and the last lumbar (L-last) (Jones, Benitez, et al., 2018; Randau et al., 2017) (Figure 2). Here, a diaphragmatic thoracic vertebra was defined as the first thoracic vertebra to have both of its cranial and caudal articular processes (zygapophyses) facets orienting vertically (Breit, 2002; Williams, 2012). These nine vertebrae were selected because they covered not only the typical shapes of each region and the shape in transitional region but also were representative vertebra from each module as proposed in Randau and Goswami (2017a). For brevity of collectively calling a series of vertebrae craniad or caudad to the vertebra of interest, the prefix ‘pre-’ and ‘post-’ will be used. For example, post-axis vertebrae are referred to any vertebra caudad to the axis vertebra (i.e., C3 to L-last). Tail vertebrae are not common in museum collection, at least for the species sampled here, and it is not practical to identify homologous tail vertebrae to compare across species, therefore this region was not considered.
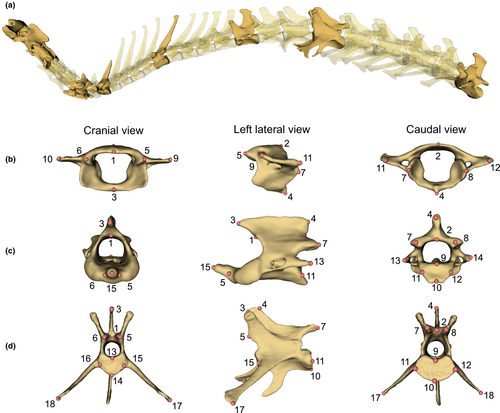
Three-dimensional landmarks were placed on digital 3D models of each vertebra in 3D Slicer. The atlas and axis have their own landmarking schemes due to their specialised shapes; the remaining seven vertebrae have the same landmarking scheme (Figure 2, and the details of their location are shown in Appendix 2: Table A2). In brief, landmarks of type II and III (Bookstein, 1997) were used to capture the areas where the vertebral muscles attach and to reflect the overall dimension (e.g., dorsal most, lateral most) of the vertebra. The landmarking schemes were adapted from Randau et al. (2017); the difference is on the landmark numbers 17 and 18 of the diaphragmatic thoracic vertebra. These landmarks were designated for the lateral most tip of the vertebra, which were on the transverse processes. But the transverse processes are not always present in all species' diaphragmatic thoracic vertebrae, in which case, the accessory processes were the most laterally projected tip. Here, we consider both transverse processes and accessory processes to be functionally equivalent as they provide an attachment point for m. longissimus as observed from the gross dissection of Lepus europaeus, Oryctolagus cuniculus, and Canis lupus. Thus, in this study, we consider landmarks 17 and 18 to be functionally homologous across all post-axis vertebrae, regardless of their position on transverse processes or accessory processes.
Species with damaged vertebrae and missing landmarks were dealt with as follows. For Rattus norvegicus, the penultimate lumbar was used instead of L-last. For Vombatus ursinus, the landmarks on the atlas ventral arch were estimated from the extrapolation of the ossified part. Two species had their missing landmarks estimated using minimum bending energy of thin-plate spline method (Gunz et al., 2009, implemented in geomorph::estimate.missing): Lepus timidus, landmarks 3 and 4 of both T1 and T-mid were estimated from other leporids landmark data (including unpublished data); Isoodon macrourus, landmarks 5, 6, and 15 of axis vertebra were estimated from closest sister species (Isoodon obesulus and Macrotis lagotis). Three species had their landmarks estimated by reflecting from the other side: Lepus timidus (landmarks 6 and 16 of T-mid; landmark 18 of L-last); Viverricula indica (landmark 18 of L-last); and Vulpes lagopus (landmark 18 of L-last).
2.4 Statistical analysis
All analyses were done in R Statistical Environment version 4.2.3 (R Core Team, 2023). The analytical libraries and functions used (herein noted as library::function) were geomorph v.4.0.6 (Adams et al., 2023; Baken et al., 2021), morphoBlocks v.0.1.0 (Thomas & Harmer, 2022), RRPP v.1.4.0 (Collyer et al., 2018; Collyer & Adams, 2023), and vegan v.2.6–4 (Oksanen et al., 2022).
Landmark coordinates of each vertebra were standardised by generalised Procrustes superimpositions (Rohlf & Slice, 1990) via geomorph::gpagen to correct for the effect of scaling, position, and rotation while maintaining their independence as separate structures. Since we were not interested in shape asymmetry, we extracted only the symmetric shape component from the resulting landmark coordinates (Klingenberg et al., 2002) and used them as shape variables for all subsequent analyses.
We first produced a phylomorphospace (Sidlauskas, 2008) to visualise the species' distribution according to their vertebral shape. We applied principal component analysis (PCA) via geomorph::gm.prcomp on each vertebra shape variables. Then, following the method detailed in Thomas et al. (2023), we concatenated the shape variables of all nine vertebrae into ‘superblock’ shape variables (hereafter ‘whole column’ for brevity), on which we applied a regularised consensus PCA (RCPCA) via morphoBlocks::analyseBlocks. The superblock shape variables were subjected to regularised generalised canonical correlation analysis (Tenenhaus et al., 2017; Tenenhaus & Guillemot, 2017) to calculate the amount of variance explained by each ‘global’ component (GC) from the whole column. The resulting variance and the scores can be interpreted in the same manner as PCA and visualised as a phylomorphospace of the whole column shape.
To examine the influence of size and gait on vertebral shapes, we implemented two approaches. Since we found a significant correlation between natural-log transformed centroid sizes (ln-CS) of all vertebrae and natural-log transformed species average weight (Pearson's correlation coefficient > .90, p < .05), we used ln-CS as proxies of species' sizes. We tested for the effect of size and gait using both ordinary least squares and phylogenetic generalised least squares (OLS and PGLS, respectively) methods with the same model (shape ~ size + gait + size:gait) via geomorph::procD.lm and procD.pgls. This approach follows other similar studies (e.g., Álvarez et al., 2013; Da Silva Netto & Tavares, 2021; Jones, 2016a; Manfreda et al., 2006) to provide usable comparison.
The degree of morphological variation of each vertebra was determined from how much their shape dispersed in the shape space, which was measured using the Procrustes variance of each vertebra, calculated using geomorph::morpho.disparity. We calculated phylogenetic signal of each vertebra using the Blomberg's K statistic for multivariate data (Kmult; Adams, 2014; Blomberg et al., 2003) geomorph::physignal, to test whether or not species with closer phylogenetic relationship tend to have more similar vertebral shape. To infer patterns of morphological integration among vertebrae and identify which vertebra could be a proxy for the whole vertebral column, we applied the pairwise standardised Mantel's test, via vegan::mantel, to test the similarity of the morphospace occupation patterns from each vertebra. This was done using distance matrices calculated from the PC and GC scores of their respective vertebra. Mantel's tests were performed on the whole dataset (morphospace of all species) and two subsets: only placentals, and only marsupials, to assess whether they differ in their patterns of integration. All statistical significances were assessed through 999 iterations of permutation.
3 RESULTS
3.1 Whole column morphospace
The morphospace presented here, generated from the RCPCA of whole column data, showed species distributed into distinct groups partially relating to phylogeny (Figure 3). Monotremes occupied a distinct region away from other therian mammals. Within therians, rodents and non-rodent placentals occupied different regions of the morphospace, and marsupials occupied the region in between.
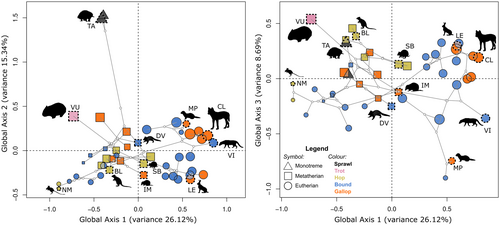
The first three components of the RCPCA of the whole column captured around 50% of the total variance (Table 1). Along the GC1 (26% of total variance) was shape variation attributable to the size (allometric variation) of the animal: small rodents occupied the far negative GC1, while leporids and canids occupied the positive GC1. However, this component was not exclusively allometry, as all marsupials of mixed sizes, including the wombat (the largest species in this study), were located in the middle region of GC1. The separation of phylogenetically distant monotremes from the other species was along GC2 (15%), which accounted for 15% of the variance (Figure 3). The third component, GC3 (8.6%), described the variation that further supported GC1 in delineating between marsupials and placentals.
| Axes | Whole | Atlas | Axis | C3 | C6 | T1 | T-mid | T-diaph | L1/3 | L-last |
|---|---|---|---|---|---|---|---|---|---|---|
| 1 | 26.10% | 45.65% | 59.77% | 61.91% | 49.20% | 65.65% | 51.52% | 37.25% | 32.23% | 37.13% |
| 2 | 15.09% | 16.43% | 13.53% | 12.28% | 16.87% | 13.16% | 19.52% | 17.57% | 26.81% | 22.68% |
| 3 | 8.63% | 10.34% | 9.38% | 6.09% | 12.52% | 7.29% | 7.91% | 12.93% | 12.39% | 14.48% |
| Sum 1–3 | 49.82% | 72.43% | 82.68% | 80.28% | 78.59% | 86.10% | 78.96% | 67.75% | 71.43% | 74.29% |
- Note: The amount of variance described by the first three principal axes and the sum of all three are given for each analysis.
To visualise the shape variation associated with each GC, we selected species at the edge of the distribution in morphospace and plotted shape graphs of each vertebra (Figure 4): Notomys mitchellii (Mitchell's hopping mouse), Viverricula indica (small Indian civet), Tachyglossus aculeatus (short-beaked echidna), and Isoodon macrourus (northern brown bandicoot), representing the minima and maxima of GC1 and GC2, respectively.
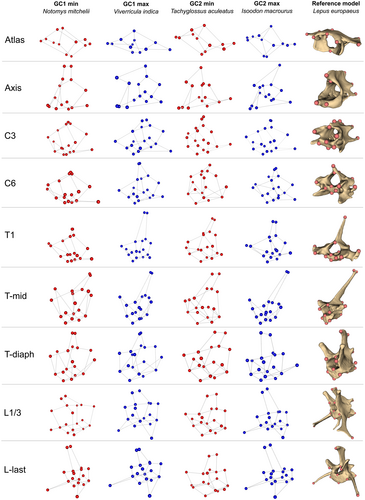
Towards negative GC1 scores were the species with small, pointy spinous process (especially on C3 and C6), but on the last lumbar these species had well-developed, relatively long, and gracile spinous process than had the species at the maxima of GC1. The relative width of cranial and caudal articular processes was lesser towards the maxima of GC1. Opposite patterns of shape variation in transverse processes of different vertebrae were observed: atlas, C3, T-mid, L1/3, and L-last had the transverse processes more laterally projected (and/or relatively longer) towards the maxima of GC1; the more medially projected or relatively shorter transverse processes towards the maxima of GC1 was found in axis, C6, T1, and T-diaph (Figure 4).
GC2 mostly captured shape variation in lateral width of the centrum and cranio-caudal width of the spinous process. Towards the maxima of GC2, the centrum became relatively narrower laterally and longer cranio-caudally. For the cranio-caudal width of the spinous process, different vertebrae again presented opposite change along the GC2: towards maxima of GC2, the spinous processes were wider only in axis and T1. In addition, the change in the direction of the spinous process was also observed. In C6, T-diaph, L1/3, and L-last, towards maxima the spinous process's tip was more cranially projected; the other vertebrae did not have their spinous process changed in direction. As with the first component, GC2 also captured the variation in the degree of lateral projection of the transverse processes. From minima to maxima of GC2, the transverse processes were more laterally projected, and also more ventrally located (Figure 4).
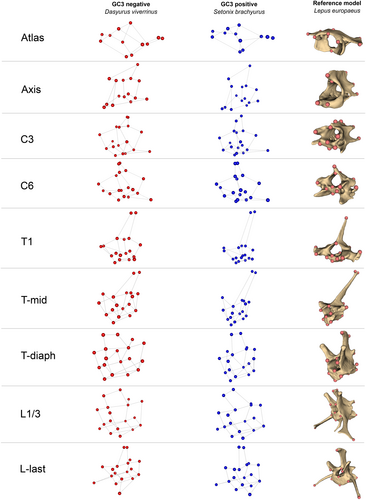
For GC3, the vertebral shapes of Setonix brachyurus (quokka) and Dasyurus viverrinus (eastern quoll) were compared instead of the species on the maximum and minimum of GC3, respectively, to avoid the influence of variation explained by the other GCs. Along this component was the height and the cranio-caudal width of the spinous process. Towards the positive scores, the spinous process became taller but narrower in all vertebrae except for the atlas and C3. The spinous process of C3 became cranio-caudally wider towards positive scores. The atlas was dorso-ventrally flatter, with the cranio-caudally wider wing towards positive scores. Only C6 showed the change in direction of the transverse process from slightly ventrally projected to slightly dorsally projected from negative to positive scores (Appendix 3: Figure 8).
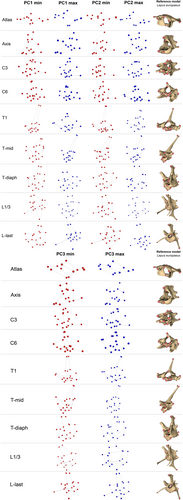
Individual morphospaces were generated for each vertebra using PCA (Appendices 4 and 5: Figures 9 and 10). For each, eight out of nine vertebrae had their first three components captured more than 70% of the variation (Table 1) and were similar to the morphospace of the whole column.
3.2 Vertebra shape versus size and gaits
All nine vertebrae and the whole column have significant allometric variation from both OLS and PGLS models, except for the last lumbar vertebra from the OLS model (Figure 5). Allometry had the strongest impact on the first thoracic vertebra in the OLS model (46%), and on the atlas in the PGLS model (19%). Allometry had the lowest effect on L-last in both models.
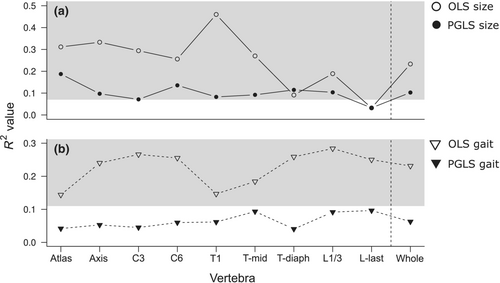
Gait was a significant predictor of vertebrae shape according to the OLS model, with the highest variance being explained for 28% of the L1/3. However, the effect was not significant when the phylogeny was considered. Regardless of the significant allometric variation in the vertebrae shape, there was no interaction between size and gait (Appendix 6: Table A3).
3.3 Individual vertebra shape disparity, phylogenetic signal, and relationship with whole column morphospace
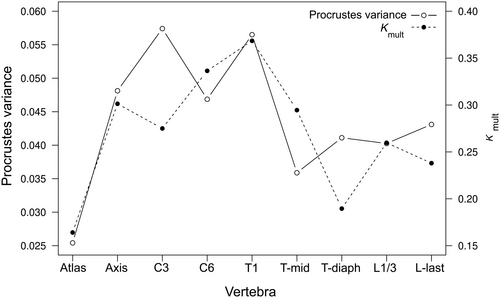
The morphological disparity of vertebral shape was highest in the C3, followed by T1 and the axis (Procrustes variance of 0.057, 0.056, and 0.048, respectively). The atlas had the lowest degree of shape disparity (Figure 6). Phylogenetic signal was highest in the T1 vertebra, and lowest in the atlas; all Kmult values were significant at the 5% level as given by the permutation test (Figure 6).
The suite of Mantel's tests comparing the morphospaces for each vertebra showed different patterns of morphological integration with different taxa of focus (Figure 7). In phylomorphospace subset to placentals, the highest integration (more than 70%) was found within pre-T-mid vertebrae. T-mid vertebra showed an intermediate degree of integration (around 60%) between pre-T-mid and post-T-mid vertebrae. The L1/3 showed higher degree of integration to axis (53%) and C3 (52%) than to the L-last vertebra (49%). For the correlation with whole column morphospace, C3 vertebra showed the highest integration to the whole column (Figure 7a).
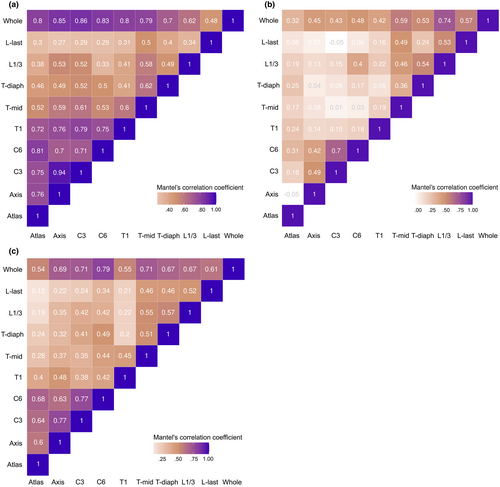
When subsetting phylomorphospace to only marsupials, different patterns to placentals were observed (Figure 7b). The atlas was weakly correlated with any vertebra, while the axis-C3-C6 was strongly integrated with each other. Post-T-mid vertebrae were also found to integrate with each other, except between Tidiaph and L-last. And with the whole column, L1/3 showed the highest integration (74%) to the whole column.
Finally, for the phylomorphospace of all species, a high correlation was found within the four cervical vertebrae and within post-T-mid vertebrae. T1 was only weakly correlated to other vertebra, particularly the vertebrae caudal to it (Figure 7c). And when compared to the whole column shape, C6 was the most related to the phylomorphospace pattern of the whole column (79%). On the other hand, T1 and the atlas (ones with the highest and lowest shape diversity, respectively) both showed only around 55% correlation to the whole column shape.
4 DISCUSSION
The vertebral shape variation in small- to medium-sized terrestrial mammals found here does not support all the hypotheses we made. Terrestrial gait is not correlated to vertebral shape in a phylogenetic context, while the effect of allometry is significant, indicating a strong evolutionary allometric signal but not a locomotory signal in the dataset. We also observed different allometric trajectories between marsupials and placentals. The highest phylogenetic signal was found in the T1 (first thoracic vertebra) instead of the T-mid (numerically middle thoracic vertebra), with the cervical vertebrae showing the highest morphological disparity. And morphospace of the whole column correlated the most with the sixth cervical vertebra morphospace.
4.1 In small mammals, gait has little impact on vertebral shape variation, instead evolutionary allometry has a stronger role
Our results showed a non-significant effect of locomotive strategy on vertebral shape using PGLS, which was significant with an OLS model, indicating that the gait classified for this mammalian group is strongly associated with phylogeny. That is to say, the biological relationship between locomotive strategy and vertebral shape cannot be ascertained in this dataset due to the lack of phylogenetic replication in gait across the phylogeny. Other studies have shown similar findings in the vertebral columns of both small- and large-sized mammals (e.g., Álvarez et al., 2013, Da Silva Netto & Tavares, 2021, Jones, 2016a, Randau & Goswami, 2018; but see Granatosky et al., 2014, Kort & Polly, 2023, Manfreda et al., 2006, Vander Linden et al., 2019). The pelves of mammalian carnivorans were also found to have no correlation with locomotion when phylogeny was taken into account (Lewton et al., 2020). Similarly, Randau and Goswami (2018) also reported the lack of shape covariation between the vertebral column shape and the skull and appendicular skeletons in felids. These studies and our results all highlight the confounding impact of phylogeny and locomotion in analyses of ecomorphology, even though the taxonomic scales are different between these studies (limited to Order or Family level in the previous studies) compared to ours (up to sub-class level). The types of locomotive categories were also variable across these studies, but noticeably, those identifying a significant effect of locomotion after correcting for phylogeny were those having ‘specialised’ locomotors (e.g., true swimmers, flyers) in the analysis with terrestrial locomotors. These common results of losing locomotory signal may signify that changes associated with terrestrial gait have followed the evolutionary history of clades (Dagg, 1973), and these locomotive classifications are not realistically replicating the evolutionary event we expect them to be (see Uyeda et al., 2018).
Nevertheless, the effect of gait on vertebral shape was found to be the strongest on the lumbar shape (Appendix 6: Table A3), as found in previous works (e.g., Figueirido et al., 2021; Jones, Benitez, et al., 2018). This is generally due to the variety of mechanical demands from different types of locomotion (whether they are different modes [terrestrial, arboreal, aquatic, etc.] or gaits [walk, amble, gallop, etc.]) (Slijper, 1946). In the case of different gaits, the highest impact on the post-T-mid vertebrae could be due to the fact that they are the region where most movement occurs (Schilling & Hackert, 2006), and that different gaits require different degrees of bending and muscular activities (Schilling & Carrier, 2010). However, it is evident from our results that the effect of locomotion is deeply confounded by phylogeny and allometric scaling.
There is generally strong evolutionary allometry in the vertebral variation of mammals (Esteban et al., 2023; Jones, 2015a; Jones & Pierce, 2016; Kort & Polly, 2023; Zack et al., 2023), as we found in the vertebral column of small- to medium-sized species in our study. Overall, the primary global axis of shape variation (GC1) captured evolutionary allometric variation in our dataset. In that, towards negative GC1 are smaller species, the vertebrae were more ‘compressed’ in shape (the cranio-caudally short vertebral shape, altogether with the laterally wide articular and transverse processes); and towards positive GC1 are larger species, the vertebrae were more ‘stretched’ in shape (spinous process in pre-L-last vertebrae dorso-ventrally taller, cranio-caudally longer; transverse processes in post-cervical vertebrae laterally expanded; articular processes in pre-L-last vertebrae medially narrower) (Figure 4). The compressed shape would allow dorso-ventral bending but limit the lateral bending and axial rotation of the respective vertebral region, while the more stretched shape, particularly in post-cervical vertebrae, will allow for more mobility in the thoracolumbar region (Jones & German, 2014). The expansion in width and height of spinous process and transverse processes provides more surface area for vertebral muscular mobilisers (m. longissimus) and stabilisers (mm. spinalis et semispinalis) (Schilling, 2005). Also, in larger species the L-last vertebrae instead became more compressed, that is, its spinous process relatively shorter and articular processes laterally wider (Figure 4). The short spinous process would allow for more space for dorsoflexion of the lumbosacral joint, and the wider articular processes for more lateroflexion (Jones, 2016b). The dorso-ventral mobility of lumbosacral joint is important for the animal to propel itself in the locomotion, and the lateral mobility facilitates manoeuvrability (Belyaev et al., 2024). Ultimately, the species towards the positive GC1 have a vertebral structure that allows them to be dorso-mobile runners (Hildebrand, 1985). On the other end of the morphospace, the more compressed shapes are noticeable in cervical and T1 vertebrae, resulting in a compact cervical region. The flexibility of the cervical region is primarily related to the stability/mobility of the head, which in turn links to the visual ability of the animal when they run (Randau & Goswami, 2017a). The other benefit of a compact cervical region in terrestrial species is proposed to prevent mechanical failure of the vertebral column during digging behaviour (Vanburen & Evans, 2017). And for small ricochetal mammals, compact cervical vertebrae are also hypothesised to support the relatively large head compared to body size, so the risk of mechanical failure in holding the relatively heavy head is minimised (Vanburen & Evans, 2017).
Placentals and marsupials displayed different allometric trajectories in the whole column morphospace: the allometric trajectory of placentals shows an obvious size gradient following GC1; but of marsupials, no allometric gradient was observed. This pattern was also found in the individual vertebrae morphospace (Appendix 4: Figure 9). This may reflect the marsupials' common developmental constraint (Martin & Weisbecker, 2023; Sears, 2004), that may have stronger impact than the allometric scaling. Vertebral shapes in the cervico-thoracic region of marsupials are likely to support the well-developed forelimbs in their very early stage of life; the cervical and thoracic vertebrae in one-day-old Tammar wallaby are highly ossified, together with the forelimb skeleton, while the hindlimb skeletons and lumbar vertebrae are not yet ossified (Weisbecker et al., 2008). Such rapid ossification of the upper body skeletons facilitates the extremely ‘arboreal’ behaviour whereby the joey relocates itself from the womb to the pouch soon after birth (Doroba & Sears, 2010; Hughes & Hall, 1988).
4.2 High phylogenetic signal and morphological disparity were found in cervical and thoracic vertebrae
All vertebrae had significant phylogenetic signal, with Kmult values less than one, similar to previous studies (Álvarez et al., 2013; Da Silva Netto & Tavares, 2021; Granatosky et al., 2014; Jones, Benitez, et al., 2018). This means that among closely related taxa, vertebral shapes are less similar than expected under random evolutionary change (Brownian motion), but can also indicate phenotypic convergence (Adams, 2014; Kamilar & Cooper, 2013). This may be observed from the morphospace, such as the similarity in vertebrae shape between two distant placental clades, leporids (rabbits and hares) and canids (dogs). The vertebra with the highest phylogenetic signal (closest to 1) was T1 for small- to medium-sized mammals. This differs from the observation in large mammals where T-mid vertebra has been reported to have the greatest phylogenetic signal (Jones, Benitez, et al., 2018), which in our dataset had the second smallest Kmult value (after the atlas). The absolute value of Kmult is not strictly comparable between studies (because it is variable dependent), but is meaningful between structures within the same study; in this case there are notable differences in the cervical, thoracic, and lumbar vertebrae in small- to medium-sized mammals that differ from large mammals and suggest different selective pressures on these regions.
We observed greater shape disparity in post-atlas cervical (C3 and C6) and T1 vertebrae (i.e., those at the ‘anterior’ end of the column) than in the post-T1 and lumbar vertebrae (or ‘posterior’ vertebrae). This whole column trend contradicted the trend observed from carnivoran- and mammalian-wide analysis (Figueirido et al., 2021; Jones, Benitez, et al., 2018; Randau & Goswami, 2017b). But the trend of disparity within each vertebral region (the increasing disparity from atlas to axis, decreasing from C3 to C6, and increasing from T-mid to L-last) is the same as those reported in larger species (Figueirido et al., 2021; Randau & Goswami, 2017b; Vander Linden et al., 2019). This same trend between small and large-sized mammals could be explained by the conserved Hox genes for vertebral patterning across mammalian lineage (Böhmer, 2017).
However, the diversity of locomotive modes among species considered in these studies might be the reason for the contradicted trend of morphological disparity between the anterior and posterior vertebrae. In previous studies either at mammalian- or carnivoran-wide scale, the whole column trend of posterior vertebrae having the highest disparity could arise from having a broad range of specialised locomotive modes (such as runners, climber, digger, or swimmer) in the analysis. And this high disparity of posterior vertebrae is reinforced by the high correlation with locomotory habit (Figueirido et al., 2021; Randau et al., 2017). For our study, we have limited the locomotion to only terrestrial runners, so the shape of posterior vertebrae could be more conserved to preserve running ability, thus low morphological disparity. Consequently, the relatively greater variation within the cervical region is revealed. This result is concordant with known patterns of locomotive specialisation in mammals, where the posterior vertebrae are differentiated with locomotive ability of the mammals (Jones, Angielczyk, et al., 2018), while the cervical vertebrae (and possibly anterior thoracic vertebrae) diversify for other functions (e.g., vision, foraging) (Figueirido et al., 2021; Vander Linden et al., 2019). But within other modes of locomotion (e.g., mammalian flyers or swimmers), it is unknown whether the patterns of morphological disparity we observe in terrestrial species follow this hypothesis. Such findings will further enhance the current understanding of the evolvability of each vertebra and how its shape becomes specialised for a particular mode of locomotion.
4.3 Vertebrae are differently integrated between regions and along the whole column
Our study joins the growing research base on vertebral column integration in mammals (e.g., Figueirido et al., 2023; Jung et al., 2021; Martín-Serra et al., 2021; Randau & Goswami, 2017b). By examining the similarity of phylomorphospaces using Mantel's correlation, we found three regions of the vertebral column have high correlations between adjacent vertebrae and so were inferred to be more integrated: the cervical with T1 vertebrae, and the series of vertebrae from T-mid to L-last region, which could be further divided into antero- and postero-dorsal (or cranio- and caudo-dorsal) regions as proposed by Martín-Serra et al. (2021).
Comparing the amount of disparity and phylogenetic signal observed for each vertebra against the pattern of Mantel correlations permits some hypotheses to be posited on whether integration is involved in limiting or promoting disparity (e.g., Felice et al., 2018; Sherratt & Kraatz, 2023). Considering the pattern of integration from mammalian-wide morphospace (Figure 7c), the cervical region showed the strongest correlations, inferred as the highest integration, yet this was also the region with high levels of disparity. The thoracic and lumbar vertebrae showed similarly lower correlations, which followed the lower disparity and phylogenetic signal values in those vertebrae. From this we can hypothesise that macroevolution of the vertebral column has been facilitated by higher integration within regions, and lower integration between regions.
Previous research suggests the vertebral region of interest and evolutionary clade can lead to different observations of vertebral integration, which is also evident from our analyses (Figure 7a,b). In the cervical region of domestic dog breeds, a pattern of tripartition (atlas-axis, C3–C5, and C6–C7) was hypothesised to be due to different flexibility available in each part (Arnold et al., 2016). However, in the whole column of a Felidae-wide study (Randau & Goswami, 2017a), the pattern of cervical tripartition was not evident; instead high shape covariation between cervical and lumbar vertebrae was found, which can be explained by a shared ossification timing during development. In a study across carnivorans, the observed modules were more linked with functional difference of each region, and thus more in accordance with the traditional regionalisation scheme: the three-module plus diaphragmatic region, comprising cervical, craniodorsal, diaphragmatic, and caudodorsal (Martín-Serra et al., 2021), which supports the regionalisation-by-function (cervical, pre-diaphragmatic, and post-diaphragmatic region) that was used in earlier studies in marsupials (Pridmore, 1992) and catarrhines (Williams, 2012). However, we have shown that caution should be made when generalising the pattern of vertebral integration for all mammals, as the pattern can be different, at least between placentals and marsupials (Figure 7a,b). Research on the degree of integration between regions of a multi-element structure like the vertebral column is in its infancy compared to that of the skull (e.g., Drake & Klingenberg, 2008; Goswami & Polly, 2010; Marroig et al., 2009). Further research is encouraged to understand how integration between regions, or other modules of the vertebral column, contributes to the phenotypic disparity at an evolutionary level (i.e., Felice et al., 2018).
4.4 The utility of multi-block approach for serially homologous structure
The vertebral column is composed of serially homologous vertebrae, yet the shape of these vertebrae can differ substantially, as to require different measurements (landmark schemes). This means that the vertebrae from all regions can typically be combined into a single analysis because geometric morphometrics requires all variables to be present in all specimens, and makes the expectation that those variables be homologous (Klingenberg, 2008). Furthermore, the articulated and flexible nature of the vertebral column precludes standard Procrustes superimposition approaches to be used, and recent advances to fix positional variation between articulated structures (Rhoda et al., 2021; Vidal-Garcia et al., 2018) make assumptions of what the whole-column shape should be. We demonstrate that the multi-block method for ordinating data from multiple structures into a single morphospace (Thomas et al., 2023) works well for vertebral columns. This is because it evaluates shape variation among all vertebrae simultaneously (regardless of what variables are used to measure them) without being confounded by the vertebra's position relative to one another, which is a separate source of variation with different research questions.
We also tested our data with another approach implemented in the geomorph::combine.subsets function (Collyer et al., 2020), and we did not observe a difference in the resulting morphospaces from either method, except the variances, which were less than 5% different (result not shown). Other methods of combining multiple landmark configurations into one analysis have been developed (e.g., Chen et al. (2005), Jones, Benitez, et al. (2018)), and we suggest the vertebral column is a good system for a systematic comparison of these methods.
AUTHOR CONTRIBUTIONS
Nuttakorn Taewcharoen: Conceptualization (lead); formal analysis (lead); methodology (lead); writing – original draft (lead). Rachel Norris: Writing – review and editing (equal). Emma Sherratt: Conceptualization (supporting); methodology (supporting); writing – review and editing (equal).
ACKNOWLEDGEMENTS
For access to museum specimens, we thank David Stemmer of the South Australian Museum's mammals collection. We thank Mishelle Korlaet and Lars Kruse (Jones Radiology) for CT scanning support. We thank the following people for scan provisioning: Ozboneviz project and Vera Weisbecker's research group; Roger Benson, Cody Thompson, Sharon Grant, and TEMPO project (MorphoSource data); Megu Gunji (provisioning of L. brachyurus, L. timidus, and P. furnessi). And we thank the anonymous reviewer and the Associate Editor for their valuable comments on the manuscript. Open access publishing facilitated by The University of Adelaide, as part of the Wiley - The University of Adelaide agreement via the Council of Australian University Librarians.
FUNDING INFORMATION
PhD sponsorship was provided by the Development and Promotion of Science and Technology Talents Project (DPST) Thai goverment scholarship and the University of Adelaide Research Support Scholarship to NT. This study was funded by the Small Research Grant Scheme 2022 from the Royal Society of South Australia to NT, and partially by the Australian Research Council Future Fellowship FT190100803 to ES.
CONFLICT OF INTEREST STATEMENT
The authors in this study declare no conflict of interest.
APPENDIX 1
- Note: The species are assigned with numbers corresponding to the individual vertebra phylomorphospaces as provided in Appendix 3: Figure 8. Different equipments were used in different scanning facilities: SOMATOM and NAEOTOM ALPHA X-ray CT scanners for Jones Radiology; EinScan Pro HD surface scanner for Toyo University; and for Ozboneviz and TEMPO, please referred to the specimen’s respective MorphoSource web page provided. Abbreviations of specimen collection location: FMNH (Field Museum of Natural History (Zoology) Mammal Collection), NSMT (National Museum of Nature and Science, Tokyo), SAMA (South Australian Museum), UMZ (University Museum of Zoology, Cambridge University), UMMZ (University of Michigan Museum of Zoology), UofA (University of Adelaide, Emma Sherratt’s laboratory).
APPENDIX 2
| Vertebra | Landmark | Description |
|---|---|---|
| Atlas | 1 | Cranial mid-point of the dorsal arch |
| 2 | Caudal mid-point of the dorsal arch | |
| 3 | Cranial mid-point of the ventral arch | |
| 4 | Caudal-most tip of the ventral tuberculum | |
| 5 | Cranial-most point of the left cranial articular process | |
| 6 | Cranial-most point of the right cranial articular process | |
| 7 | Caudal-most point of the left caudal articular process | |
| 8 | Caudal-most point of the right caudal articular process | |
| 9 | Cranial-most edge of the left transverse process | |
| 10 | Cranial-most edge of the right transverse process | |
| 11 | Caudal-most edge of the left transverse process | |
| 12 | Caudal-most edge of the right transverse process | |
| Axis | 1 | Cranio-dorsal mid-point of the vertebral foramen |
| 2 | Caudo-dorsal mid-point of the vertebral foramen | |
| 3 | Cranial-most tip of the spinous process | |
| 4 | Caudal-most tip of the spinous process | |
| 5 | Lateral left of the den base | |
| 6 | Lateral right of the den base | |
| 7 | Caudal-most point of the left caudal articular process | |
| 8 | Caudal-most point of the right caudal articular process | |
| 9 | Dorsal mid-point of the caudal side of centrum | |
| 10 | Ventral mid-point of the caudal side of centrum | |
| 11 | Lateral left mid-point of the caudal side of centrum | |
| 12 | Lateral right mid-point of the caudal side of centrum | |
| 13 | Caudal-most tip of the left transverse process | |
| 14 | Caudal-most tip of the right transverse process | |
| 15 | Cranial-most tip of the den | |
| C3 to the last lumbar | 1 | Cranio-dorsal mid-point of the vertebral foramen |
| 2 | Caudo-dorsal mid-point of the vertebral foramen | |
| 3 | Cranial-most tip of the spinous process | |
| 4 | Caudal-most tip of the spinous process | |
| 5 | Cranial-most point of the left cranial articular process | |
| 6 | Cranial-most point of the right cranial articular process | |
| 7 | Caudal-most point of the left caudal articular process | |
| 8 | Caudal-most point of the right caudal articular process | |
| 9 | Dorsal mid-point of the caudal side of centrum | |
| 10 | Ventral mid-point of the caudal side of centrum | |
| 11 | Lateral left mid-point of the caudal side of centrum | |
| 12 | Lateral right mid-point of the caudal side of centrum | |
| 13 | Dorsal mid-point of the cranial side of centrum | |
| 14 | Ventral mid-point of the cranial side of centrum | |
| 15 | Lateral left mid-point of the cranial side of centrum | |
| 16 | Lateral right mid-point of the cranial side of centrum | |
| 17 | Lateral-most tip of the left transverse process (or accessory process for diaphragmatic thoracic) | |
| 18 | Lateral-most tip of the right transverse process (or accessory process for diaphragmatic thoracic) |
APPENDIX 3
APPENDIX 4

APPENDIX 5
APPENDIX 6
| Factor | Statistic | Whole | Atlas | Axis | C3 | C6 | T1 | T-mid | T-diaph | L1/3 | L-last |
|---|---|---|---|---|---|---|---|---|---|---|---|
| OLSModel: shape ~ size + gait + size:gait | |||||||||||
| Size (df = 1) | R 2 | .23 | .31 | .33 | .29 | .26 | .46 | .27 | .09 | .19 | .03 |
| F | 17.69 | 23.18 | 31.30 | 27.60 | 20.88 | 46.22 | 20.26 | 5.62 | 14.68 | 1.89 | |
| Z | 4.45 | 4.82 | 4.05 | 3.96 | 4.51 | 4.51 | 4.26 | 3.12 | 5.00 | 1.37 | |
| p-Value | .001 | .001 | .001 | .001 | .001 | .001 | .001 | .002 | .001 | .087 | |
| Gait (df = 4) | R 2 | .23 | .14 | .24 | .27 | .26 | .15 | .18 | .26 | .28 | .25 |
| F | 4.38 | 2.68 | 5.65 | 6.24 | 5.21 | 3.69 | 3.46 | 3.99 | 5.52 | 3.66 | |
| Z | 4.43 | 3.10 | 4.68 | 4.13 | 4.21 | 3.41 | 2.85 | 3.95 | 4.60 | 3.66 | |
| p-Value | .001 | .001 | .001 | .001 | .001 | .001 | .003 | .001 | .001 | .001 | |
| Size:Gait (df = 3) | R 2 | .05 | .05 | .03 | .05 | .04 | .03 | .05 | .05 | .05 | .09 |
| F | 1.21 | 1.17 | 1.04 | 1.43 | 0.96 | 0.84 | 1.31 | 1.03 | 1.32 | 1.68 | |
| Z | 0.87 | 0.59 | 0.31 | 1.17 | 0.09 | −0.25 | 0.80 | 0.24 | 0.94 | 1.53 | |
| p-Value | .174 | .285 | .386 | .118 | .47 | .589 | .212 | .41 | .186 | .066 | |
| Residual (df = 37) | R 2 | .49 | .50 | .39 | .39 | .45 | .37 | .49 | .60 | .48 | .63 |
| PGLSModel: shape ~ size + gait + size:gait | |||||||||||
| Size (df = 1) | R 2 | .10 | .19 | .10 | .07 | .14 | .08 | .09 | .11 | .11 | .03 |
| F | 4.91 | 9.68 | 4.48 | 3.29 | 6.55 | 3.81 | 4.52 | 5.35 | 5.23 | 1.54 | |
| Z | 4.41 | 4.43 | 3.18 | 2.59 | 4.30 | 2.72 | 3.00 | 2.66 | 3.55 | 1.06 | |
| p-Value | .001 | .001 | .001 | .002 | .001 | .005 | .003 | .001 | .001 | .146 | |
| Gait (df = 4) | R 2 | .06 | .04 | .05 | .05 | .06 | .06 | .09 | .04 | .09 | .10 |
| F | 0.75 | 0.54 | 0.61 | 0.52 | 0.72 | 0.71 | 1.15 | 0.47 | 1.16 | 1.15 | |
| Z | −0.69 | −1.10 | −0.99 | −1.32 | −0.71 | −0.78 | 0.58 | −1.38 | 0.57 | 0.51 | |
| p-Value | .752 | .875 | .841 | .91 | .767 | .767 | .253 | .906 | .303 | .316 | |
| Size:Gait (df = 3) | R 2 | .06 | .05 | .05 | .08 | .04 | .05 | .06 | .05 | .07 | .10 |
| F | 0.95 | 0.94 | 0.74 | 1.27 | 0.61 | 0.83 | 0.98 | 0.79 | 1.21 | 1.52 | |
| Z | 0.15 | 0.18 | −0.43 | 0.78 | −1.00 | −0.23 | 0.28 | −0.08 | 0.67 | 1.20 | |
| p-Value | .442 | .438 | .675 | .208 | .848 | .581 | .394 | .533 | .263 | .119 | |
| Residual (df = 37) | R 2 | .78 | .72 | .80 | .80 | .77 | .80 | .75 | .79 | .73 | .78 |
- Note: The values from ordinary (OLS) and phylogenetically-corrected (PGLS) models are given. Coefficient of determination (R2) explains how much each factor contributes to shape. Bolded test statistic (F) values denote p ≤ .05. The total degree of freedom is 45. Significant allometric component was found in all vertebrae, except for the L-last, in both models. Gait is only a significant component in the OLS model.
Open Research
OPEN RESEARCH BADGES
This article has earned an Open Data badge for making publicly available the digitally-shareable data necessary to reproduce the reported results. The data is available at https://doi.org/10.25909/25295197.
DATA AVAILABILITY STATEMENT
The R code and all associated raw data to reproduce the results presented in this article are available on Figshare (https://doi.org/10.25909/25295197). The CT image series of all specimens are available on MorphoSource and can be accessed from the web addresses provided in Appendix 1: Table A1.


