Comparison of different macroinvertebrates bioassessment indices in a large near-natural watershed under the context of metacommunity theory
Abstract
The metacommunity theory proposes that community structure and biodiversity are influenced by both local processes (such as environmental filtering) and regional processes (such as dispersal). Despite the extensive use of traditional bioassessments based on species-environment relationships, the impact of dispersal processes on these assessments has been largely overlooked. This study aims to compare correlations between various bioassessment indices, including Shannon Weiner (H′), Biological Monitoring Working Party (BMWP), average score per taxon (ASPT), biotic index (BI), and EPT taxa index (EPT), based on macroinvertebrates collected from 147 sampling sites in a subtropical Chinese near-natural catchment. Modified indices were calculated by removing species strongly influenced by dispersal processes to address the influence of dispersal processes. Their relationship with environmental factors was then compared to the original indices. The study employed random forest regression (RFR) to compare the explanatory power of environmental factors using the two sets of indices. The spearman rank correlation analysis was conducted to examine the correlation between indices and environmental factors. The river health assessment was performed based on both modified and original indices. The results reveal significant differences between original and modified indices (especially H′ and BI) providing a more accurate reflection of environmental conditions. Furthermore, the sensitivity of the different indices to various environmental factors varied, leading to differences in the bioassessment results between the modified and the original indices. Notably, original H′, BMWP, and ASPT overestimated the bioassessment results, whereas the original BI underestimated them. These findings offer valuable insights into bioassessment and river health assessment evaluation within the catchment and other interconnected freshwater ecosystems, such as lakes, reservoirs, and wetlands. Our study underscores the importance of assessing and mitigating the impact of dispersal processes on bioassessment to obtain a more precise representation of the status of freshwater ecosystems.
1 INTRODUCTION
The ecological importance of freshwater ecosystems, such as rivers and streams, cannot be ignored as they are irreplaceable resources that play a critical role in human and social development (Carpenter et al., 2011; Luo et al., 2018). However, freshwater ecosystems face threats from stressors like overexploitation, habitat fragmentation, agricultural activities, and land use changes (Grill et al., 2019; Kundzewicz et al., 2008; Moss, 2008). The impact of these stressors has led to a decline in biodiversity and loss of ecosystem function in freshwater ecosystems (Albert et al., 2021). In order to protect, manage, and restore freshwater biodiversity and associated natural resources the development and validation of diverse bioassessment methodologies are very important (Angeler et al., 2014; Wu et al., 2020). The key idea of bioassessment is that changes in the biological communities found in different locations are a reflection of the environmental conditions between sites (Vilmi et al., 2016). But metacommunity theory suggests that the composition of biological communities is a combination of local (e.g., environmental filtering), regional (e.g., dispersal), and stochastic (e.g., random local disturbances) processes (Cottenie, 2005; Leibold et al., 2004). Therefore, there is a need to validate and compare traditional bioassessments based on species–environmental relationships to provide more accurate information on the ecological health of freshwater ecosystems.
Using aquatic organisms for freshwater ecosystem health assessment is a well-established approach as they are affected by a wide range of stressors that reflect the effects of pollution conditions and changes in habitat and hydrological conditions (Hering et al., 2006; Wu et al., 2023). To date, bioassessment with various aquatic organisms (e.g., fish, macroinvertebrates, and algae) is widely used in many countries and organizations, such as the European Water Framework Directive (WFD) and the US National Biomonitoring Program (NBP) (Arle et al., 2016; Buss et al., 2015). Bioassessment indices are the key tool for bioassessment of freshwater biomonitoring. Their usage proposed information on environmental health, which plays an important role in defining the objectives of environmental management and related policies (Wu et al., 2012; Zhao et al., 2019). Macroinvertebrates are widely used in bioassessment due to their suitable life history, habitat fixation, ease of collection, and ability to rapidly respond to various stressors such as water pollution and anthropogenic influences (Feld & Hering, 2007; Huang et al., 2015; Mereta et al., 2013). The bioassessment indices for macroinvertebrates mainly include: (1) biodiversity indices such as the Shannon Weiner (H′) and Simpson index (Linares et al., 2020); (2) taxonomic unitarity indices such as the EPT taxa index (EPT) (Kitchin, 2005); and (3) indices based on tolerance or sensitivity values for macroinvertebrates such as the BI (biotic index), FBI (family-level biotic index) (Young et al., 2014), BMWP (Biological Monitoring Working Party), and improved ASPT (average score per taxon) index based on BMWP (Armitage et al., 1983; Ruse, 1996). However, these traditional bioassessment indices all share a common problem: they ignore the impact of spatial processes on communities (Vilmi et al., 2016).
Metacommunity theory suggests that environmental factors are not the only factors that define the changes in community structure, but spatial processes are also one of the important processes that affect community structure (Heino et al., 2015; Lin et al., 2024; Thompson et al., 2020; Wu et al., 2022). Many studies suggested the impact of dispersal processes (i.e., mass effect and dispersal limitation) on biodiversity (De Bie et al., 2012; Li et al., 2021; Tonkin et al., 2018). Mass effect assumes that environmentally heterogeneous habitat patches are tightly linked through dispersal such that colonization in source habitats can persist in sink habitats (Mouquet et al., 2003; Mouquet & Loreau, 2002). Dispersal limitations prevent species from reaching suitable habitats (Heino et al., 2015). However, many commonly used indices are often based on traditional assessment concepts (i.e., species-environment relationships) that ignore many important ecological processes (Leboucher et al., 2021; Siqueira et al., 2014). Spatial processes may isolate the relationship between species and their environment (Heino et al., 2017), thus affecting the results of biological assessments. Therefore, the ability of bioassessments to accurately reflect local environmental conditions may be challenged in metacommunity contexts (Bried & Vilmi, 2022; Leboucher et al., 2021). Hence, improvements and comparisons of different bioassessment indices are imminent.
The samples were taken from Thousand Islands Lake (TIL) catchment in China. This area spans the administrative regions of Hangzhou and Huangshan and primarily consists of the Xin'an River and its tributaries (Gu et al., 2016). TIL holds a critical ecological position due to being the largest artificial freshwater reservoir in China and an important source of drinking water for the Yangtze River Delta region (Sheng & Han, 2022b). Characterized by mountainous terrain with extensive forest cover, this region experiences limited anthropogenic activity, predominantly agriculture. Effective control of industrial and domestic wastewater has led to well-preserved ecosystems and biomes (Figure 1, Lin et al., 2024; Wang et al., 2012; Zhai et al., 2014). These factors make it an ideal area for studying the impact of quantitative dispersal processes on bioassessment indices in a near-natural context. We selected several different extant bioassessment indices of H′, BMWP, ASPT, BI, and EPT. Different traits of macroinvertebrates are affected by dispersal processes to different degrees (Lindholm et al., 2018), especially traits related to dispersal ability, thus the dispersal process may separate the link between organisms and the environment and thus affect bioassessment. The species that are more influenced by spatial processes were removed according to a previous study (Liu et al., 2023), to calculate the corresponding modified indices (hereafter as indexmod, respectively). Here we compare the indexmod with the original index in an attempt to address the impact of the dispersal process on bioassessment.
With this study, our goals were: (1) to evaluate the differences in correlations between the original indices and indicesmod with environmental factors; (2) to compare the propensity of different bioassessment indices to indicate the role of various environmental factors to provide useful information for bioassessment and river health management; and (3) to test differences in the water health assessment classes between the two version of the indices.
2 MATERIALS AND METHODS
2.1 Study area description
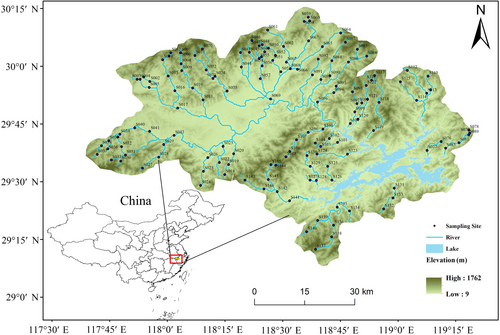
The study encompassed 147 sampling sites within the Thousand Islands Lake (TIL) catchment area (29.21°–30.21° N; 117.70°–119.31° E; elevation gradient over 500 m), China (Figure 2). Situated within a subtropical monsoon climate zone, this sampling region spans an approximate area of 10,080 km2 and experiences an average annual precipitation of 1430 mm. Sampling sites are designed to avoid locations with rapidly fluctuating water quality (e.g., wastewater outfalls) and important hydraulic structures (e.g., bridges, water intakes). At the same time, the habitats in the area are well protected, with low anthropogenic activity and low gradients of environmental disturbance.
2.2 Macroinvertebrates data
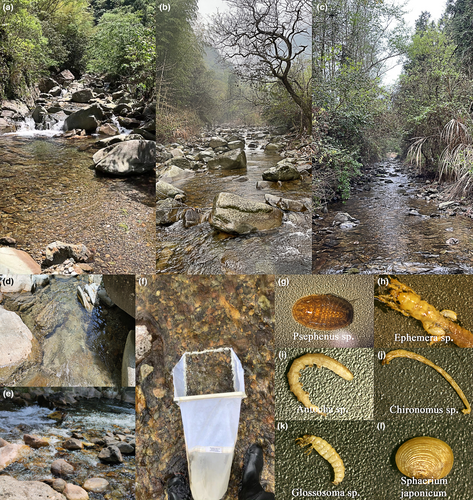
The field investigation was conducted in the dry season (April and May 2021) to avoid heavy rainfall in the TIL catchment. We used Surber net (Figure 1f, 30 × 30 cm2, 500 μm mesh) for three replicate collections at each sampling site. Different microhabitats (Figure 1a–c, mainly fine sediments, rocks, and pebbles) and flow conditions (Figure 1d,e, slower and faster flows) were sampled to cover as many species as possible. Finally, three samples were combined to represent the macroinvertebrates at the site. The sampling points cover the wadable section of the river from the headwaters to the main river. The samples were stored in a removable holding tank and preserved in 70% alcohol for further identification. The macroinvertebrates were classified at the lowest possible taxonomic level (Figure 1g-l, mainly genera) using references (Holzenthal, 2009; Merritt et al., 2017; Morse et al., 1994) and online identification resources (https://www.macroinvertebrates.org/).
2.3 Environmental factors
A comprehensive set of 12 physicochemical parameters was collected at each of the sampling sites, as outlined in Table 1. The assessment of hydro-morphological characteristics encompassed the measurement of river width (Width), water depth (Depth), and flow velocity (Velocity). For these measurements, we used the Global Water Flow Probe FP201 to measure Depth and Velocity in the vicinity of the sampling locations and to measure Width at the river transects where they were located. Each site was assessed and scored according to Qualitative Habitat Evaluation Index (QHEI) (Taft & Koncelik, 2006). The QHEI was calculated for six metrics: substrate, instream cover, channel morphology, riparian zone and bank erosion, pool/glide and riffle-run quality, and map gradient. Each category was assessed visually and assigned a score from 0 to 20, with the final QHEI score being the sum of these six categories. The pH, conductivity (Cond), and water temperature (WT) were measured by using a water quality handheld meter (YSI Professional Plus). In addition, water samples were collected at each site by using 100 mL sample bottle and stored at 4°C in the laboratory for further analysis. The quantification of total phosphorus (TP), total nitrogen (TN), ammonia nitrogen (NH3–N), nitrate nitrogen (NO3–N), and chemical oxygen demand (CODMn) within water samples adhered to the guidelines outlined in the Water and Wastewater Monitoring and Analysis Method (Table 1), as stipulated by The State Environmental Protection Administration (2002).
| Category variables | Code | Units | Mean | Max | Min | SD |
|---|---|---|---|---|---|---|
| Width | Width | m | 13.23 | 104.77 | 1.23 | 15.05 |
| Water depth | Depth | cm | 24.90 | 80.00 | 9.00 | 11.90 |
| Velocity | Velocity | m/s | 0.41 | 1.07 | 0.01 | 0.20 |
| pH | pH | – | 7.65 | 9.50 | 5.51 | 2.75 |
| Water temperature | WT | °C | 17.23 | 23.27 | 7.87 | 0.91 |
| Conductivity | Cond | μs/cm | 167.07 | 363.00 | 14.23 | 84.76 |
| Permanganate index | CODMn | mg/L | 1.12 | 2.64 | 0.48 | 0.36 |
| Ammonia nitrogen | NH3–N | mg/L | 0.11 | 0.40 | 0.03 | 0.04 |
| Nitrate-nitrogen | NO3–N | mg/L | 1.02 | 3.40 | 0.21 | 0.55 |
| Total nitrogen | TN | mg/L | 1.80 | 4.20 | 0.81 | 0.60 |
| Total phosphorus | TP | mg/L | 0.05 | 0.51 | 0.01 | 0.05 |
| Habitat score | QHEI | % | 65.68 | 80.77 | 31.87 | 9.23 |
| Elevation of the sampling site | Elevation | m | 270.88 | 648.00 | 102.00 | 131.50 |
| Slope of the sampling site | Slope | ° | 11.01 | 33.19 | 0.24 | 8.43 |
| Aspect of the sampling site | Aspect | ° | 200.44 | 358.65 | 3.71 | 106.62 |
| Forest% | Forest | % | 96.05 | 100.00 | 59.79 | 6.62 |
| Cropland% | Cropland | % | 3.51 | 38.36 | 0.00 | 6.06 |
| Shrubs% | Shrubs | % | 0.01 | 0.25 | 0.00 | 0.03 |
| Grassland% | Grassland | % | 0.02 | 0.26 | 0.00 | 0.05 |
| Water% | Water | % | 0.06 | 2.12 | 0.00 | 0.24 |
| Impervious% | Impervious | % | 0.35 | 4.49 | 0.00 | 0.66 |
The land cover data of the sampling site at a spatial resolution of 30 m were obtained from Yang and Huang (2021). The land cover within the upstream catchment area of each sampling site was used as the land cover for that site. The study area was re-categorized to identify six land use types: Forest, Cropland, Shrubs, Grassland, Water, and Impervious (see Table 1 and Figure S1). Topographic variables (including Elevation, Slope, and Aspect) were obtained from Amatulli et al. (2018). Slope represents the steepness of the stream along the longitudinal gradient and the aspect captures information on the north–south and east–west orientation of each location.
2.4 Relationships between macroinvertebrate traits and environment
In order to address the impact of dispersal on bioassessment indices, we identified the taxa most affected by dispersal by using dispersal ability group trait (DAG, Bilton et al., 2001; Heino, 2013a; Van De Meutter et al., 2007, Table 2). For detailed information on macroinvertebrates DAG traits, refer to Table S2. DAG01 represents weak passive dispersers with aquatic adults, and DAG04 refers to strong aerial dispersers with flying adults. Based on our previous study of macroinvertebrate community assembly mechanisms in TIL catchment (Liu et al., 2023), the results of trait decomposition and variance partitioning analysis showed that DAG01 and DAG04 had a total explanation of 25% and 61%. In particular, the pure effect of spatial processes on both taxa DAG01 and DAG04 (15% and 52%, respectively) accounted for 60% or more of the total explanation and was much larger than the pure effect of environmental filtering (1% and 3%, respectively). We therefore considered that the 64 species of DAG01 and DAG04 were strongly influenced by the dispersal processes.
| Trait | Codes | Categories | Descriptions |
|---|---|---|---|
| Dispersal ability | DAG01 | Weak passive dispersers with aquatic adults | The classification of DAG was based on the ability of macroinvertebrates to spread on land |
| DAG02 | Weak aerial dispersers with flying adults | ||
| DAG03 | Intermediate aerial dispersers with flying adults | ||
| DAG04 | Strong aerial dispersers with flying adults |
2.5 Data analysis
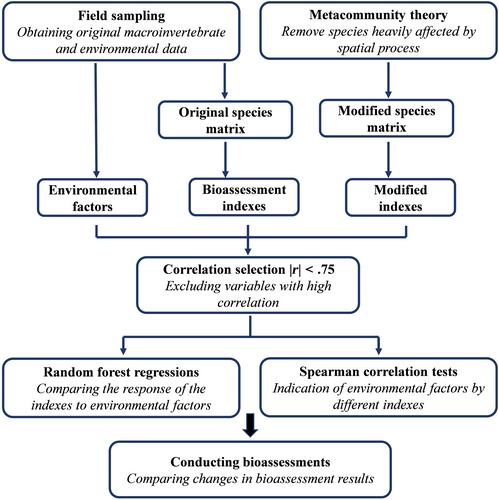
The macroinvertebrates bioassessment indices (containing the original and modified indices) and environmental factors datasets (containing 21 variables) were used to calculate the Spearman rank correlation between the original bioassessment indices and the environmental factors by using SPSS. Prior to this, the Spearman rank correlation analysis was done separately for the indices and environmental factors, and only those with |r| < .75 were allowed to proceed to the next step of the analysis (Huang et al., 2015; You et al., 2021). Next, we used the randomForest function in the R package randomForest to perform random forest regression (RFR) (Breiman, 2001). RFR was used to test the relationship between each index and 21 environmental factors separately. Then, we again used the Spearman rank correlation test to calculate the correlation of environmental factors with the original and modified indices and visualized them using pheatmap function in R package pheatmap (Kolde & Kolde, 2018). Finally, we conducted a river health assessment based on the grading criteria of the bioassessment indices and used the Kruskal–Wallis tests to examine differences between overall values of each original index and indexmod (Table 3).
| Index | Excellent | Good | Fair | Poor | Very poor |
|---|---|---|---|---|---|
| H′ | >3 | (2.0, 3.0] | (1.0, 2.0] | (0.5, 1.0] | (0, 0.5] |
| BMWP | >80 | (50, 80] | (25, 50] | (10, 25] | (0, 10] |
| ASPT | >4.0 | (3.5, 4.0] | (3.1, 3.5] | (2.0, 3.0] | (0, 2.0] |
| BI | (0, 3.5] | (3.5, 5.5] | (5.5, 6.5] | (6.5, 8.5] | >8.5 |
| EPT | >28 | (20, 27] | (14, 20] | (6, 14] | (0, 6] |
- Abbreviations: ASPT, average score per taxon; BI, biotic index; BMWP, Biological Monitoring Working Party; EPT, EPT taxa index; H′, Shannon Weiner diversity index.
3 RESULTS
3.1 Macroinvertebrate communities and environmental conditions
In total, 199 taxa were identified, belonging to 89 families, 22 orders, 9 classes, and 4 phyla. Within this taxonomic diversity, aquatic insects made up a substantial 75% of the total richness. Particularly noteworthy were Ephemeroptera (comprising 36 taxa) and Diptera (comprising 31 taxa), both significantly abundant taxa. Additionally, we also documented 49 taxa of DAG01 and 17 taxa of DGA04 (as detailed in Table S1).
The Spearman rank correlation test for environmental factors showed that most of them were lacking in high correlation values (Table S2). The correlation between NO3–N and TN was high (r = .893). The NO3–N was excluded because it derived from the TN. Similarly, the correlation between Forest, Cropland, and Impervious was high (|r| > .75), and the forest had higher cover and variability in values, so Cropland and Impervious were excluded.
3.2 Correlation of bioassessment indices
The outcomes of the Spearman rank correlation analysis (see Table S3) revealed the interrelation among the five macroinvertebrate bioassessment indices (|r| ranging from .248 to .905, p < .01). This signifies a pronounced level of agreement in the capacity of these indices to gauge river health. A notably strong correlation was found between the BMWP and the EPT index (|r| = .905). The EPT taxa are considered to be representative of aquatic insects in clean water bodies, which may also contribute to the generally high BMWP values for these taxa. And the BMWP index was only used since there was no difference between the EPT and the modified EPTmod index. The other four indices (including H′, BMWP, ASPT, and BI) did not have high correlation coefficients (|r| from .248 to .632), which suggested that each index responded to some independent information. Given that the BI index is derived from the tolerance values of macroinvertebrates, it exhibited a negative correlation with the other four bioassessment indices. However, this correlation was relatively weak (r ranging from −.408 to −.266, p < .01).
3.3 Response of bioassessment indices to environmental factors
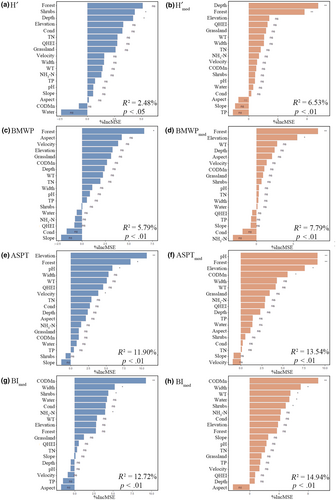
The results of the RFR showed that the environmental factors explained more of the modified bioassessment indices (R2: 6.53%–14.94%) (Figure 4a,c,e,g) than the original bioassessment indices (R2: 2.48%–12.72%) (Figure 4b,d,f,h). Among these, the H′ index responded better with Shrubs and Depth (refer to Figure 4a), whereas the index exhibited Depth and Forest as the predominant predictors (as depicted in Figure 4b). A total of 27 taxa (13.6% of the total taxa) were excluded from the calculation of BMWP and ASPT according to the method of Armitage et al. (1983). For BMWP index, the best predictor was Forest (Figure 4c); the Forest and Elevation were the best predictors for the BMWPmod index (Figure 4d). The ASPT index, on the other hand, revealed noteworthy responsiveness to Elevation, Forest, pH, and Velocity (as depicted in Figure 4e). Meanwhile, the ASPTmod index demonstrated a strong predictive linkage with pH, Forest, Elevation, and CODMn (see Figure 4f). Turning to the BI index, its predictive power was notably associated with CODMn, Width, WT, Shrubs, and NH3–N (as illustrated in Figure 4g). Similarly, the BImod index displayed CODMn, Width, WT, Water, and Shrubs as its most influential predictors (depicted in Figure 4h).
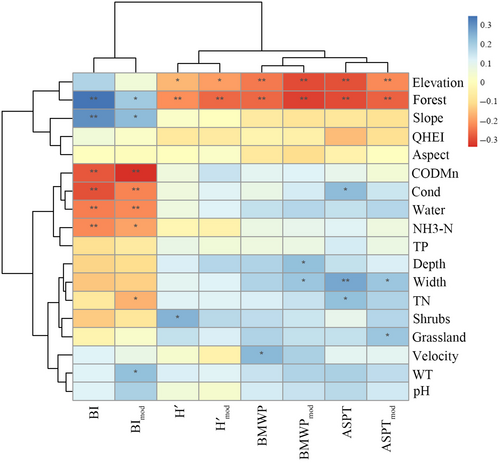
The results of the correlation heat map showed that different bioassessment indices indicate different environmental factors (R values ranged from −0.306 to 0.334; and p values from 6.808E-19 to .968) (Figure 5). Overall, almost all indices were significantly correlated with Forest. All indices except the BI and BImod indices were significantly correlated with Elevation. When examining all groups of indices, the BI and BImod indices showed the strongest correlations with environmental factors, which was consistent with the results of the RFR (Figure 4h,g), especially for water quality factors such as CODMn (p < .01), Cond (p < .01), and NH3–N (p < .01, p < .05, respectively). The BImod index was also significantly correlated with TN (p < .05) and WT (p < .05). H′, , BMWP, and BMWPmod indices were the least responsive to environmental factors, such that the results were also similar to those of the RFR. BMWP was significantly correlated with Velocity (p < .05), while BMWPmod was significantly correlated with Depth (p < .05) and Width (p < .05). In addition, the ASPT and ASPTmod were strongly correlated with Width (p < .01, p < .05, respectively). ASPT index was significantly correlated with Cond (p < .05) and TN (p < .05), and ASPTmod was significantly correlated with Grassland (p < .05).
3.4 Differences in bioassessment results
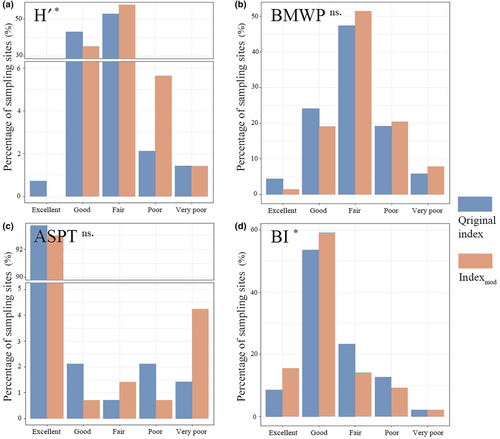
The results of Kruskal–Wallis test showed significant differences between the values of H′ and BI indices with their corresponding modified indices (i.e., p < .05, chi-squared value = 4.15 and 5.40, respectively). There was no significant difference in the values of the BMWP and ASPT indices and their corresponding modified indices (i.e., p ≥ .05). The bioassessment results based on the different indices show that there were differences in the health assessment results of the four groups of indices, as well as differences in the bioassessment results of each index and its corresponding modified index (Figure 6). For the H′ index, 43.66% of the sampling points were excellent and good, 52.82% were fair, and 3.52% were poor and very poor, while for index, the percentage of excellent and good sampling points decreased (35.21%), the percentage of fair sampling points increased (57.75%), and the percentage of poor and very poor sampling points increased (7.04%) (Figure 6a). The BMWP and BMWPmod showed 28.17% and 47.18% of excellent and good sampling points, 47.18% and 51.41% of fair sampling points, and 24.65% and 28.17% of poor and very poor sampling points (Figure 6b). The bioassessment results of ASPT index indicated 95.77% sampling points were excellent and good, 0.70% of fair, 3.52% were poor and very poor, compared to the ASPTmod index which showed a decrease in the percentage of excellent and good sampling points (93.66%), an increase in the percentage of fair sampling points (1.41%) and an increase in the percentage of poor and very poor sampling points (4.93%) (Figure 6c). BImod showed an increase in the proportion of excellent and good sampling points (74.65%) over BI (61.97%), a decrease in the proportion of fair sampling points (23.24%–14.08%) and a decrease in the proportion of poor and very poor sampling points (14.79%–11.27%) (Figure 6d). Overall, the bioassessment results based on the , BMWPmod, and ASPTmod indices became worse, while the bioassessment results based on the BImod index became better.
4 DISCUSSION
4.1 Impact of spatial processes on bioassessment
Here, a novel approach is employed to explore the impact of spatial processes on bioassessment indices. Species strongly affected by spatial process, identified based on macroinvertebrate trait information (i.e., the 64 species included in DAG01 and DAG04), were excluded. This served as the basis for calculating the original and modified indices (Liu et al., 2023). The results showed the same pattern, without exception, the modified indexes were better reflections of the state of the environment than the original indexes. This indicated that consideration of spatial processes allowed for more reliable bioassessment.
Actually, advances in theoretical ecology have shown that biodiversity has a complex relationship with dispersal (Cadotte, 2006; Jiang et al., 2021). Despite recognition of the significance of dispersal in metacommunity ecology, most bioassessments are based on a “pure” species sorting view (Cai et al., 2019; Heino, 2013b; Vilmi et al., 2016). Dispersal processes may fragment the relationship between biomes and their environment (Bried & Vilmi, 2022; Leboucher et al., 2020), further potentially affecting the bioassessment. Recently, Vilmi et al. (2016) showed that species sorting was not the only factor affecting community structure. In addition, Leboucher et al. (2021) also pointed out that considering dispersal processes can improve the accuracy of biological evaluations. Indeed, the intensity of community influence by dispersal processes may depend on the dispersal capacity of organisms, spatial extent, and location in the river basin system (Armitage et al., 1983; Heino et al., 2015). Astorga et al. (2012) found that weaker dispersers exhibited lower environmental control and higher spatial structuring compared to stronger dispersers. However, Heino et al. (2012) did not find significant differences between diatoms (efficient passive dispersers), bryophytes (passive dispersers with moderate dispersal capacity), and invertebrates (inefficient active dispersers) in this regard. The difference in spatial span (distance between sites up to about 800 km and less than 100 km, respectively) between the two studies leads us to hypothesize that the degree of influence of spatial processes varies with spatial extent. The spatial extent of TIL catchment (an area of approximately 10,800 km2) may result in weak dispersers (i.e., DAG01) being affected by dispersal limitation. In addition, the importance of dispersal may be different at different sections of the river network. The headwater streams receive few migrants, so environmental factors should be the main influence on local communities (Schmera et al., 2018). In contrast, our sites covered not only upstream areas but also large downstream rivers connected through Thousand Island Lake, and communities at these sites may receive many migrants from tributaries or even lakes. It may be that such specialized basin configurations result in some high taxa (i.e., DAG04) potentially being affected by high dispersal rates. All these factors may distort the results of the bioassessment by affecting community dispersal. Based on these factors and previous investigation results, the novelty of our study is that we excluded species (i.e., DAG01 and DAG04) that have been identified as being more influenced by spatial processes in TIL catchment, minimizing the impact of dispersal processes on the bioassessment. According to our results, the relationship between the modified indices and the environment was higher than those of the original indices, which led us to conclude that the modified indices might be better indicators of environmental conditions. Thus, the impact of spatial processes should be emphasized in future research to allow for more reliable bioassessments.
4.2 Relationship between bioassessment indices and environmental factors
Our results show that different bioassessment indices were correlated with different environmental factors (Figure 5). Specifically, the BMWP and ASPT and their corresponding modified indices reflected changes in hydro-morphological factors such as width, but poorly reflect water quality factors. As shown by Kantzaris et al. (2002), BMWP and ASPT were not sufficient to assess water quality. But previous studies have also found the applicability of BMWP and ASPT to reflect the physical and chemical factors of water (Yorulmaz & Ertas, 2021; Zeybek, 2017). We speculate that this might be due to the similarity of water quality factors across TIL catchment. BMWP and ASPT were used at the family level. In parallel, family-level values usually represent an intermediate value of species sensitivity (Armitage et al., 1983). In addition, another possible reason is that the BMWP and ASPT indices constructed on the basis of the biological status of UK rivers may not be fully applicable to the TIL. Compared to species-level-based indices, family-level indices may underestimate or overestimate water quality and therefore do not accurately reflect changes in water quality in our study area (MacNeil & Briffa, 2009). Meanwhile, the strongest relationships were found between the BI and BImod indices and environmental factors, especially with water quality factors such as CODMn, Cond, and NH3–N. The accuracy of the BI index in reflecting water quality factors had also been noted in previous studies (Wang et al., 2021; Zhang et al., 2020).
In addition, the H′ and appeared to respond only to changes in Elevation and Forest. The results also showed that all indices except BI and BImod were significantly correlated with Elevation. Recent studies have found that macroinvertebrates diversity patterns are influenced by elevation, particularly in montane stream ecosystems, while altitude may also indirectly affect macroinvertebrates abundance by causing changes in gradients in environmental factors such as climate (Chiu et al., 2020; Yang et al., 2020). These changes may further influence bioassessment. Moreover, all indices were significantly correlated with Forest, and changes in Forest may have an elevational gradient. Land use change (e.g., natural vegetation being replaced by anthropogenic land use) can degrade riparian zones and stream habitats in different ways (Siqueira et al., 2015; Stendera et al., 2012). Therefore, land use can significantly alter the biodiversity of freshwater (Carlson et al., 2016; Johnson et al., 2013). Our study area is a well-protected, highly forested watershed of great ecological significance. Hence, it is important to protect its ecological integrity (Fu et al., 2022; Sheng & Han, 2022a).
4.3 Applicability and comparison of bioassessment indices
In this study, differences in the bioassessment results based on the original and modified indices were found (Figure 6). Overall, the assessment results showed that the steam health in TIL catchment was relatively good. This may be due to the fact that this region is generally subject to less human disturbance, which may result in inadequate coverage of all disturbance gradients. Future studies should thus be expanded to other catchments with significant anthropogenic gradients and assess the generalizability of our findings. Specifically, the original H′, BMWP, and ASPT indices overestimated the bioassessment results, in contrast to the original BI index which underestimated the bioassessment results. Based on our results, the relationship between the modified index and the environment is higher than that of the original index. Therefore, bioassessments based on the modified indices may be more reliable. But the differences between the indices and their applicability in the region will be the focus of our discussion below.
Specifically, traditional biodiversity indices, such as the H′ index, have proved useful in assessing the quality of aquatic ecosystems (Heino et al., 2007; Ji et al., 2020). However, from the results of RFR, it appeared that neither the H′ nor the modified were good indicators of environmental change. At the same time, the accuracy of these indices is increasingly questioned because they ignore functional and phylogenetic differences between species (Jiang et al., 2014; Leonard et al., 2006). Therefore, traditional biodiversity indices alone cannot be relied upon for bioassessment of this region. The BMWP index and the improved ASPT index take into account the sensitivity values of taxonomic units at the family level and are less demanding for species classification, but they tend to be highly variable across regions and the sensitivity values of macroinvertebrates within the same family tend to vary considerably (Monaghan & Soares, 2012; Varnosfaderany et al., 2010). From the RFR results, the BMWP and BMWPmod are poor indicators of environmental factors. A previous study by Ogleni and Topal (2011) also pointed out the inadequacy of the BMWP for water quality assessment, while the ASPT and ASPTmod were more indicative of environmental factors. Varnosfaderany et al. (2010) also showed that the ASPT was more responsive to environmental factors than the BMWP. The BI index, on the other hand, considers the tolerance values of the species and places increased demands on species classification (Carter et al., 2007; Pawlowski et al., 2018). Meanwhile, the strongest relationships were found between the BI and BImod indices and environmental factors. The ASPT and BI and their corresponding modified indices were thus more applicable to the bioassessment of the TIL catchment. However, domestic researches (China) on tolerance and sensitivity values are still very limited, making it necessary to refer to foreign standards for the application of indices, so future efforts should be made in this direction to target the development of tolerance and sensitivity values and that are consistent with specific regions (Liu et al., 2019; Zhang et al., 2020).
At the same time, there is a significant difference between the original and modified indices (here especially H′ and BI indices). Such results once again demonstrate the impact of dispersal processes on bioassessment. Previous studies have combined spatial and trait analyses to measure the importance of spatial processes (dispersal limitation and mass effects) in the community structure of different dispersers. The present study demonstrates the significant impact of spatial processes on bioassessment indices (especially H′ and BI indices). Leboucher et al. (2021) identified 40 diatom species in France with distributions driven primarily by mass effects and proposed an index of biological diatoms (IBDmod) that excludes these species. By comparing the differences between the original IBD and IBDmod responses to the environment, it was also demonstrated that mass effects may lead to biased water quality evaluations. Our approach is novel and easy to use compared to passive dispersers such as diatoms, but it is possible that the effects of spatial processes cannot be accurately quantified due to the coarse levels associated with DAG. But there is no doubt that spatial processes affect bioassessment in both active and passive dispersers. Therefore, the accuracy and validity of the original bioassessment needs to be re-examined in the context of metacommunity theory and the idea can be applied to other highly connected freshwater ecosystems (Cai et al., 2019; Leboucher et al., 2021; Vilmi et al., 2016).
5 CONCLUSION
In conclusion, our study has revealed several key insights into the realm of macroinvertebrate bioassessment indices and their applicability. Firstly, we established that distinct bioassessment indices exhibited significant correlations, yet their responses to environmental factors varied considerably. Notably, the modified indices showcased differential preferences in reflecting environmental nuances, highlighting the importance of their careful selection based on study objectives and contexts. Secondly, the modified bioassessment indices emerged as more robust indicators of environmental conditions compared to their original counterparts, emphasizing the role of spatial processes in refining bioassessment accuracy. However, the degree of accuracy of specific indices needs to be explored in different types of regions. Lastly, a noteworthy disparity in bioassessment outcomes was observed between the modified and original indices, underscoring the need for a comprehensive understanding of spatial processes' influence on these outcomes.
Freshwater ecosystems are irreplaceable for human survival and social development, while multiple stressors threaten them. Our study confirms that existing traditional bioassessment results based on species-environment relationships deviate from the actual freshwater ecosystem health. Therefore, there is an urgent need to apply metacommunity theory to bioassessments to reduce the influence of biological dispersal processes on freshwater ecosystem's health assessment results. Finally, we suggest that bioassessment considering metacommunity theory can be applied to other aquatic communities (e.g., fish, algae, and phytoplankton) and different freshwater ecosystems (e.g., lakes, reservoirs and wetlands). In light of our study's contributions, we contend that the advancement of bioassessment methodologies through metacommunity theory consideration holds promise for more accurate and reliable freshwater ecosystem health evaluations. This, in turn, could facilitate informed decision-making in conservation and management efforts, ensuring the preservation of these invaluable ecosystems for future generations. As the ecological intricacies of freshwater environments continue to be unraveled, the adoption of innovative approaches like metacommunity theory-inspired bioassessment could pave the way toward a more sustainable coexistence between human society and aquatic ecosystems.
AUTHOR CONTRIBUTIONS
Guohao Liu: Conceptualization (equal); investigation (equal); writing – original draft (equal). Xinxin Qi: Data curation (equal); investigation (equal). Zongwei Lin: Data curation (equal); investigation (equal). Yuanyuan Lv: Data curation (equal); investigation (equal). Sangar Khan: Supervision (equal); writing – review and editing (equal). Xiaodong Qu: Conceptualization (equal); methodology (equal). Binsong Jin: Methodology (equal); supervision (equal). Ming Wu: Methodology (equal); supervision (equal). Collins Oduro: Writing – review and editing (equal). Naicheng Wu: Conceptualization (equal); funding acquisition (equal); investigation (equal); project administration (equal); writing – review and editing (equal).
ACKNOWLEDGMENTS
This study was funded by the National Natural Science Foundation of China (Nos. 52279068, 42350410434). We thank Yixia Wang, Yaochun Wang, Wanxiang Jiang, and colleagues of Anhui Normal University for their field support. We are grateful to Editor in Chief (Dr. Chris Foote), Associate Editor (Prof. Pedro Giovâni da Silva), and two anonymous reviewers for their constructive comments on our manuscript.
CONFLICT OF INTEREST STATEMENT
The authors declare that they have no known competing financial interests or personal relationships that could have appeared to influence the work reported in this paper.
Open Research
DATA AVAILABILITY STATEMENT
All data are uploaded as supporting material.


