Occurrence of T-cell and NK-cell subsets with less well-recognized phenotypes in peripheral blood submitted for routine flow cytometry analysis
Ainsleigh J. Hill and Chaoran Zhang contributed equally as first authors.
Andrew P. Weng and Jeffrey W. Craig contributed equally as senior authors.
Funding information: Terry Fox Research Institute
The spectrum of clinical indications for which lymphocyte-directed, peripheral blood flow cytometry (FCM) is requested captures a broad assortment of patients both with and without diagnosable lymphoproliferative disorders (LPD) (Davis et al., 2007). The substantial variation in antigen expression, particularly among T-cells and NK-cells, encountered in this setting presents a diagnostic challenge, as discriminating between physiologic, or so-called “reactive,” responses to various immune stimuli and abnormal, potentially neoplastic conditions is often based on limited anecdotal and subjective experience. Altered expression of lineage-associated antigens, such as CD2, CD5, and CD7, is a characteristic feature of many T-cell and NK-cell LPDs (Craig & Dorfman, 2017); however, loss of CD7 and/or CD5 by T-cells and loss of CD2 and/or CD7 by NK-cells can be observed in the peripheral blood of most, if not all, normal individuals (Aggarwal, Fischer, Swerdlow, & Craig, 2013). Since these phenotypes overlap with one another and cannot be qualitatively distinguished, their frequent occurrence in primary clinical material can be a source of consternation when attempting to render diagnostic interpretations. In an effort to shed light on this issue, we provide here a quantitative analysis of these less well-recognized phenotypes in a large population-based cohort of peripheral blood samples submitted for lymphocyte-directed clinical FCM analysis. Our findings provide practicing hematopathologists with a series of useful benchmarks that can assist with challenging diagnostic interpretations and aid in the judicious selection of samples for further testing (e.g., extended FCM panels and DNA clonality assays).
All work was performed in accordance with approved human ethics protocols at the British Columbia Cancer Agency (BCCA). From an initial series of 889 adult peripheral blood samples submitted to BCCA's Clinical FCM Laboratory for LPD workup during the 2013 calendar year, 371 samples lacking a readily diagnosable hematolymphoid neoplasm were retained for further analysis. Basic demographic data revealed a median age of 61 years (range = 18–90 years) and a slight female predominance (male:female ratio = 40:60). Excluded cases were removed due to the following: a clonal B-cell population (n = 488), an overtly abnormal T-cell population (n = 22), an overtly abnormal NK-cell population (n = 5), circulating blasts (n = 2), or circulating plasma cells (n = 1). For the purposes of this study, overtly abnormal T-cell and NK-cell populations were defined as any immunophenotypically distinct cell cluster meeting one or more of the following criteria (modified by Gorczyca et al., 2002): (a) loss or diminished expression of CD45, (b) loss or diminished expression of a highly conserved lineage antigen (CD2 and/or CD3 for T-cells; CD56 for NK-cells), (c) diminished expression of multiple lineage-associated antigens in conjunction with altered light scattered properties, and (d) a dominant CD4+ CD8+ “double-positive” T-cell (DPT-cell) population or CD4− CD8− “double-negative” T-cell (DNT-cell) population.
Specimens were processed according to standard protocols. Lymphocyte populations were analyzed using a 3-tube, 8-color diagnostic panel, with one tube dedicated to T-cell and NK-cell-associated antibodies (clone, fluorophore): CD45 (HI30; V500), CD3 (UCHT1; FITC), CD2 (L303.1; PE-Cy7), CD5 (L17F12; PerCP-Cy5.5), CD7 (M-T701; PE), CD4 (RPA-T4; BV421), CD8 (SK1; APC-H7) and CD56 (NCAM16.2; APC). The other two tubes focused on evaluation of B-cell populations; however, those data are not presented here as the objective of the current study is to quantitate less well-recognized phenotypes within T-cell and NK-cell subsets. Data were acquired on a BD FACSCanto II flow cytometer (Becton Dickinson; San Jose, California), and FCS data files were manually gated using FlowJo v10 (FlowJo, LLC).
Lymphocytes were identified as brightly CD45+ cells with low granularity (side scatter). T-cells were subsequently defined as all CD2+ CD3+ lymphocytes. T-cells were then divided into CD4+ CD8− helper (CD4+ T-cell), CD4− CD8+ cytotoxic (CD8+ T-cell), DNT-cell and DPT-cell subsets. Quadrant gates were separately applied to each of these four subsets to identify T-cells with complete or significant partial loss of CD7 and/or CD5 using internal control populations as reference (Hunt, Shallenberger, Ten Eyck, & Craig, 2016). NK-like T-cells were separately defined as all CD56+ T-cells. NK-cells were defined as all CD3− CD56+ lymphocytes. A quadrant gate was used to identify NK-cells with complete or significant partial loss of CD2 and/or CD7.
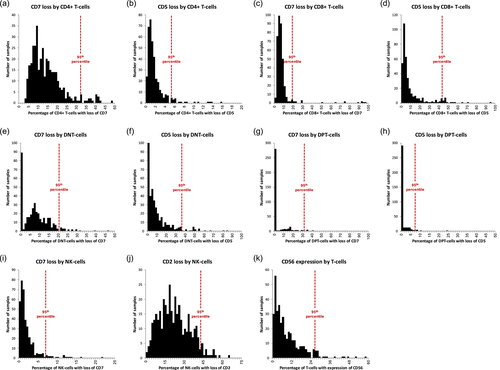
Absolute cell counts were extracted and used to generate descriptive statistics (Table 1) and histograms (Figure 1). Correlations between gated lymphocyte populations were assessed using Spearman's rank-order correlation. Due to the presence of multiple potential confounders, a highly conservative threshold of p = .0001 was used to define statistical significance. T-cell populations with loss of CD7 and/or CD5, including both CD4+ and CD8+ T-cell subsets, were detected in all 371 clinical samples. The proportion of T-cells affected was relatively low (mean T-cells with loss of CD7 = 11.9%; mean T-cells with loss of CD5 = 5.8%; and mean T-cells with loss of both CD7 and CD5 = 1.2%) but varied considerably across T-cell subsets (Table 1). Within each gated T-cell subset, there was significant correlation between the proportion of cells showing loss of CD7 and the proportion of cells showing loss of CD5 (p = <.0001 with ρ = 0.513, 0.268, 0.552 and 0.913 for CD4+ T-cells, CD8+ T-cells, DNT-cell and DPT-cell subsets, respectively), suggesting that processes which favor generation/expansion of CD7− subsets may have a similar effect on CD5− subsets.
| Population statistic | Total cohort (n = 371) | |||
|---|---|---|---|---|
| Median (%) | 95th percentile | Mean (%) | SD | |
| Percentage of CD4+ T-cells with loss of CD7 | 12.8 | 32.2 | 14.5 | 8.1 |
| Percentage of CD4+ T-cells with loss of CD5 | 1.3 | 5.4 | 1.9 | 2.0 |
| Percentage of CD4+ T-cells with loss of CD7 and CD5 | 0.4 | 3.0 | 0.8 | 1.1 |
| Percentage of CD4+ T-cells with loss of CD7 and/or CD5 | 13.9 | 33.3 | 15.7 | 8.4 |
| Percentage of CD8+ T-cells with loss of CD7 | 6.2 | 18.8 | 8.6 | 12.4 |
| Percentage of CD8+ T-cells with loss of CD5 | 4.6 | 43.6 | 9.8 | 13.2 |
| Percentage of CD8+ T-cells with loss of CD7 and CD5 | 0.3 | 4.0 | 1.6 | 6.7 |
| Percentage of CD8+ T-cells with loss of CD7 and/or CD5 | 11.4 | 49.4 | 16.8 | 15.9 |
| Percentage of DNT-cells with loss of CD7 | 7.2 | 20.5 | 8.1 | 7.1 |
| Percentage of DNT-cells with loss of CD5 | 5.8 | 36.5 | 10.3 | 13.4 |
| Percentage of DNT-cells with loss of CD7 and CD5 | 0.2 | 4.8 | 0.9 | 1.9 |
| Percentage of DNT-cells with loss of CD7 and/or CD5 | 15.8 | 48.6 | 17.4 | 15.4 |
| Percentage of DPT-cells with loss of CD7 | 0.0 | 31.9 | 5.4 | 12.1 |
| Percentage of DPT-cells with loss of CD5 | 0.0 | 7.3 | 1.6 | 5.5 |
| Percentage of DPT-cells with loss of CD7 and CD5 | 0.0 | 1.6 | 0.3 | 1.3 |
| Percentage of DPT-cells with loss of CD7 and/or CD5 | 0.0 | 36.7 | 6.7 | 14.2 |
| Percentage of NK-cells with loss of CD7 | 1.3 | 7.0 | 2.2 | 2.6 |
| Percentage of NK-cells with loss of CD2 | 21.1 | 43.1 | 22.5 | 12.0 |
| Percentage of NK-cells with loss of CD7 and CD2 | 0.3 | 2.4 | 0.7 | 1.4 |
| Percentage of NK-cells with loss of CD7 and/or CD2 | 22.3 | 43.9 | 24.0 | 11.9 |
| Percentage of T-cells with co-expression of CD56 | 6.3 | 26.5 | 9.2 | 8.9 |
- Abbreviations: DNT-cells, CD4− CD8− “double-negative” T-cells; DPT-cells, CD4+ CD8+ “double-positive” T-cells; SD, standard deviation.

There was also significant correlation between the proportion of DNT-cells within a given sample and the percentage of DNT-cells showing loss of CD7 and/or CD5 (ρ = 0.462, p = <.0001). A similar correlation was observed for DPT-cells (ρ = 0.660, p = <.0001). In contrast, the proportion of CD4+ T-cells within a given sample was inversely correlated with the percentage of CD4+ T-cells showing loss of CD7 and/or CD5 (ρ = −0.518, p = <.0001). The proportion of CD8+ T-cells showed no correlation with antigen loss. These observations suggest that processes that promote increases in DNT-cell and DPT-cell fractions may specifically favor CD7− and/or CD5− subsets within these fractions. CD56+ CD3− NK-cells frequently showed loss of CD2, but much less often showed loss of CD7. Unlike the situation with CD7 and CD5 loss in T-cells, however, there was no correlation between the proportions of NK-cells showing loss of CD2 and those showing loss of CD7 (ρ = −0.077, p = .1406), suggesting that loss of CD2 and loss of CD7 may be differentially regulated.
In summary, our study documents the frequencies of loss of CD7 and/or CD5 among T-cells and loss of CD7 and/or CD2 among NK-cells in peripheral blood samples submitted for clinical FCM analysis. Further, histogram plots showing the extent of antigen loss for each marker among the most commonly described T-cell subsets and NK-cells (Figure 1) provide an immediately useful benchmark against which practicing hematopathologists can gauge how individual patient samples compare to a large cohort. Since only overtly abnormal cases have been excluded, we acknowledge that this cohort includes a spectrum of patients ranging from so-called “normal” or “healthy” individuals to those with “reactive” (nonmalignant) physiologic responses to various immune stimuli, to those with malignant/premalignant processes at various stages of evolution that may or may not be diagnosable with additional laboratory work-up. Accordingly, the data presented here should not be construed as traditional “reference range” information, but rather as a descriptive resource on the frequency and extent of antigen loss encountered in real-life clinical practice. We submit that knowing where an individual's FCM data places him/her along the distribution of values for “nondiagnostic” clinical FCM samples can be useful for deciding whether additional laboratory studies are indicated. Further investigation would be needed to determine optimal cut-off values in terms of sensitivity and specificity for the detection of verifiable malignant conditions.
ACKNOWLEDGEMENTS
This study was supported in part by a Program Project Grant from the Terry Fox Research Institute.
CONFLICT OF INTEREST
All authors declare no conflicts of interest related to the content of this study.


