Simultaneous measurement of human hematopoietic stem and progenitor cells in blood using multicolor flow cytometry
The authors have no conflict of interest to declare.
Abstract
Hematopoietic stem cells are the source of all inflammatory cell types. Discovery of specific cell surface markers unique to human hematopoietic stem (HSC) and progenitor (HSPC) cell populations has facilitated studies of their development from stem cells to mature cells. The specific marker profiles of HSCs and HSPCs can be used to understand their role in human inflammatory diseases.
The goal of this study is to simultaneously measure HSCs and HSPCs in normal human venous blood using multicolor flow cytometry. Our secondary aim is to determine how G-CSF mobilization alters the quantity of each HSC and HSPC population. Here we show that cells within the CD34+ fraction of human venous blood contains cells with the same cell surface markers found in human bone marrow samples. Mobilization with G-CSF significantly increases the quantity of total CD34+ cells, blood borne HSCs, multipotent progenitors, common myeloid progenitors, and megakaryocyte erythroid progenitors as a percentage of total MNCs analyzed. The increase in blood borne common lymphoid and granulocyte macrophage progenitors with G-CSF treatment did not reach significance. G-CSF treatment predominantly increased the numbers of HSCs and multipotent progenitors in the total CD34+ cell population; common myeloid progenitors and megakaryocyte erythroid progenitors were enriched relative to total MNCs analyzed, but not relative to total CD34+ cells. Our findings illustrate the utility of multicolor flow cytometry to quantify circulating HSCs and HSPCs in venous blood samples from human subjects. © 2016 International Clinical Cytometry Society
Hematopoietic stem cells are the source of all inflammatory cell types. Understanding how disease states affect their quantity and differentiation could provide insights into pathogenesis and therapy. The identification of hematopoietic stem (HSC) and lineage restricted progenitor (HSPC) cell populations with specific cell surface markers has facilitated the study of their development from stem cells to mature cell types (Fig. 1) 1. Prior studies have made use of cell surface marker expression and functional assays to determine the developmental hierarchy of HSCs 1. HSCs reside at the top of the hierarchy and are defined by the two key properties: 1 multipotency (the ability to form all differentiated blood cells and 2 long-term self-renewal whereby HSCs give rise to identical progeny throughout their lifespan through cell division. Markers of HSCs and HSPCs differ substantially between mice and humans 1. In human subjects, HSCs are identified by the cell surface marker profile Lineage- CD34+ CD38- CD90+ CD45RA- 1, 2. The first differentiated cell type after HSCs are multipotent progenitors (MPPs). MPPs are distinguished from HSCs by the lack of CD90 expression and functionally by the loss of self-renewal properties 3. MPPs differentiate to generate two oligopotent progenitors known as the common lymphoid progenitor (CLP; Lin- CD34+ CD38+ CD127+ 1, 4 and the common myeloid progenitor (CMP; Lin- CD34+ CD38+ CD123+ CD45RA-) 1, 5. CMPs give rise to megakaryocyte–erythrocyte progenitors (MEPs; Lin- CD34+ CD38+ CD123- CD45RA-) and granulocyte–macrophage progenitors (GMPs; Lin- CD34+ CD38+ CD123+ CD45RA+). The oligopotent progenitors (CLPs and CMPs) give rise to all lineage-committed cells of the hematopoietic system. With stage-specific markers assigned to HSCs and HSPCs, quantitative assessment of each cell type may provide new insights to their physiology in human subjects.
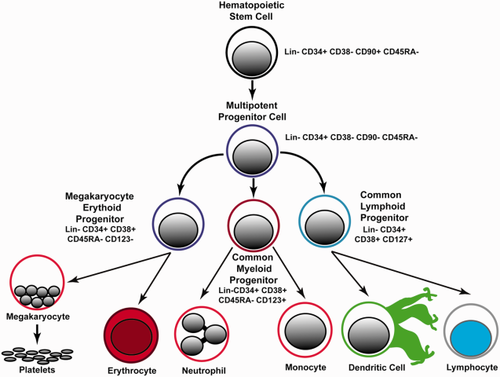
Hierarchy and cell surface markers of hematopoietic stem cells and progenitor cells. [Color figure can be viewed in the online issue, which is available at wileyonlinelibrary.com.]
The ability to distinguish HSCs and lineage-restricted progenitors is a powerful tool to identify quantitative changes that occur with diseases of inflammation and cancer. Prior studies in human subjects have used this approach to measure changes in these cell populations in the bone marrow associated with aging 6, leukemia 7, and myelodysplastic syndromes 8. Diseases of chronic inflammation and cancer exert their effects to cause disease through terminally differentiated inflammatory cells. Understanding how diseases of chronic inflammation and cancer alter the balance of HSCs and HSPCs can provide important insights into the underlying physiology, and potentially point the way to new therapies. However, very few studies have used this approach to measure HSCs and HSPCs in the blood stream of normal human subjects with or without diseases that impact hematopoiesis and inflammation.
Small animal model studies clearly show the effects of disease on the levels of HSC and HSPC populations including myocardial infarction 9, stroke 10, hypercholesterolemia 11-13, aging 14, and cancer 15. In human subjects, CD34+ Lineage- CD45dim cells in the blood stream correlate with total cholesterol levels 16, 17, consistent with studies in small animal models of hypercholesterolemia. However, more precise distinction of the subtypes of CD34+ cells in the blood stream of humans has not been performed. Mechanistically, HSCs and HSPCs play key roles in progression of atherosclerosis 9, 13 and cancer 18 in animal models by contributing to regeneration of myeloid lineage cells, monocytes, and neutrophils among others. Development of methods to measure HSCs and HSPCs in venous blood of human subjects would be a key advance to realize translation of animal model findings to convenient measurements in patients with disease, avoiding or supplementing information from bone marrow samples.
The goal of this study is to simultaneously measure HSCs and HSPCs in normal human venous blood using multicolor flow cytometry. Our secondary aim is to determine the responsiveness of each HSC and HSPC population to mobilization from the bone marrow with G-CSF treatment. Here we show that cells within the CD34+ fraction of human venous blood contain cells with the same cell surface markers of HSCs and HSPCs found in human bone marrow samples. G-CSF treatment predominantly increased the numbers of HSCs and multipotent progenitors in the total CD34+ cell population; common myeloid progenitors and megakaryocyte erythroid progenitors were enriched relative to total MNCs analyzed, but not relative to total CD34+ cells. Our findings describe an approach to quantify HSCs and HSPCs in the blood stream of human subjects and will facilitate further study of these cell types in human disease states.
MATERIALS AND METHODS
Patient Consent for Participation
Our research protocol was conducted by the Roswell Park Cancer Institute shared core resource DataBank and Biorepository (DBBR) for anonymized specimen collection for pilot data (Protocol 36404). This protocol was reviewed and approved by the Roswell Park Cancer Institute Intramural Review Board. Informed consent was obtained from study participants prior to entry, and conducted according to the principles expressed in the Declaration of Helsinki. Subjects were recruited from sibling donors of subjects under consideration for therapeutic bone marrow transplantation. All samples were anonymized. The investigators were blinded to the clinical and demographic background of the donors.
Study Protocol
Please refer to Supporting Information, Figure 1. Venous blood samples (8 mL) were collected in sodium heparin at the time of recruitment for a baseline measurement, and after 4 days of G-CSF treatment (5 μg/kg per day) for peripheral stem cell mobilization and apheresis.
Preparation of Mononuclear Cells and Antibody Staining
Mononuclear cells (MNCs) were purified by Histopaque 1077 (Sigma-Aldrich) gradient centrifugation. The MNC fraction was washed twice by centrifugation and resuspended in HBSS at room temperature to remove residual platelets. The cell concentration in each sample was then enumerated using an automated cell counter (Beckman Coulter AcT diff hematology analyzer). Five million MNCs were stained for 20 min with a cocktail containing saturating amounts of the following mAbs: CD45RA-FITC (Clone ALB11; Beckman Coulter), CD123-PE (Clone 9F5; BD Biosciences), CD38-PerCP-Cy5.5 (Clone HIT2; BD Biosciences), CD127-PerCP-Cy-7 (Clone HIL-7R-M21; BD Biosciences), CD34-APC (Clone BIRMA-K3; Dako), and CD90-BV421 (Clone 5E10). Live Dead Aqua 405 nm (Invitrogen) was used to enumerate and exclude dead cells from the analysis. After incubation with mAbs, the cells were washed once with PBS containing 0.5% bovine serum albumin, 0.1% sodium azide, and 0.0004% tetrasodium EDTA. We compared the effect of sample preparation on the quantity of CD34+ cell populations obtained using whole blood staining followed by ammonium chloride-based RBC lysis versus Ficoll density gradient separation of mononuclear cells. We found negligible differences between the two sample preparation methods on the quantity and percentages of CD34+ cell populations obtained (Supporting Information, Table 1).
Flow Cytometry Analysis
Flow cytometric acquisition was performed on an LSR Fortessa (BD Biosciences) equipped with three laser excitation sources (405 nm 50 mw; 488 nm 50 mw; 640 nm 40 mw) that was quality-controlled on a daily basis using CS&T beads and FACS DiVA software (BD Biosciences). The filter configurations for the PMTs measuring fluorescence emission of the applied fluorochromes were 450/50 nm (BV421); 525/50 nm (Live Dead Aqua); 530/30 nm (FITC); 582/15 nm (PE); 780/60 nm (PE-Cy7); 660/20 nm (APC); and 694/50 nm (PerCP-Cy-5.5). Autofluorescence and single-color controls were acquired to perform spectral overlap compensation using the automated compensation matrix feature in FACS DiVA software. Fluorescence minus one controls were used to identify staining regions. Flow cytometry data was plotted using bi-exponential plots that include axes <0 to assure all data was visible and properly compensated. Data analysis was performed with FlowJo, software Version vX.0.7 (Flowjo LLC, Ashland, OR).
Flow Cytometry Data Analysis Details
Gates defining specific populations of HSC and HPSCs (Fig. 2) were established as described previously 6. Analysis was performed using FlowJo Software using the following steps. 1 Dead cells were excluded using LD Aqua (R1; Fig. 2). 2 Doublets were excluded by gating outliers on SSC-A vs SSC-H (R2; Fig. 2) and FSC-A vs FSC-H plots (R3; Fig. 2). 3 CD38 PerCP-Cy5 vs CD34 APC plotted as a density dot plot. Total CD34+ cells were defined as R1; then total CD34+ cells were divided into CD34+ CD38 bright (R2; Fig. 3) and CD34+ CD38 negative to dim- (R3; Fig. 3) populations. 4 MPP and HSC were defined using a CD90 BV421 versus CD45RA FITC dot plot gated on the CD34+ CD38 negative to dim population (R3). The CD34+ CD38- CD90+ CD45RA- and CD34+ CD38- CD90- CD45RA- populations were selected for measurement of HSCs and MPPs, respectively (see Fig. 5 and Supporting Information, Fig. 2). 5 CMP, GMP, and MEP were defined using a CD45RA versus CD123 contour plot gated CD34+ CD38 bright population (Fig. 6). The CD123+ and CD45RA+ regions were set using fluorescence minus one plots with a 2% contour levels (Supporting Information, Fig. 3). The CD34+ CD38+ CD123- CD45RA- population is defined as megakaryocyte erythroid progenitor (MEPs); CD34+ CD38+ CD123+ CD45RA- cells are defined as common myeloid progenitors (CMPs); CD34+ CD38+ CD123+ CD45RA+ cells are granulocyte monocyte precursors (GMPs). 6 CLP were defined as the CD127-positive population using CD127 versus CD38 gated the CD34+ CD38+ population (Fig. 7). Please refer to Figure 1 for an overview of the cell surface markers and lineage relationship of each cell population.

Gating steps to exclude dead cells and cell aggregates. Illustration of the gating steps applied to the analyzed MNCs to exclude dead cells (R1), cell aggregates, or doublets (R2 and R3) prior to display of fluorescence based cytometry. The results provided are representative of the gating steps taken for all subject samples before and after G-CSF treatment. [Color figure can be viewed in the online issue, which is available at wileyonlinelibrary.com.]
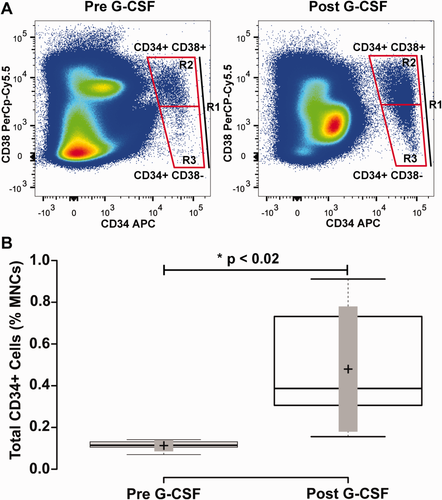
Mobilization of CD34+ mononuclear cells with G-CSF treatment blood mononuclear cells from human subjects were collected before and after 4 days treatment with G-CSF. Panel A illustrates the representative flow cytometry plots revealing CD34+ CD38+ and CD34+ CD38- cell populations in a subject with cell quantities closest to the mean of the study cohort. The labeled boxes shown delineate total CD34+ cells (indicated as R1), CD34+ CD38- (R3), and CD34+ CD38+ (R2) populations. Panel B shows a box-plot that shows the quantity of total CD34+ cells as a percentage of blood mononuclear cells before and after G-CSF treatment. Center lines show the medians; box limits indicate the 25th and 75th percentiles as determined by R software; whiskers extend to minimum and maximum values; crosses represent sample means; bars indicate 90% confidence intervals of the means. n = 6 sample points before and after G-CSF treatment. P values for the comparison of pre- and post-G-CSF are indicated in the figure. [Color figure can be viewed in the online issue, which is available at wileyonlinelibrary.com.]
RESULTS
Since few studies have focused on HSCs and HSPCs in the blood stream, the rationale for this study was to determine feasibility and assess variability of these cell populations between subjects. To test the utility of our seven-color flow cytometry panel for quantification of HSCs and HSPCs, we recruited six normal human subject volunteers. Subjects were donors for hematopoietic stem cell mobilization. Gating was performed to obtain total CD34+ cells, as well as CD34+ CD38+ and CD34+ CD38- populations (Fig. 3, Panel A). In normal subjects before G-CSF treatment, 0.11 ± 0.01% of total mononuclear cells were CD34+. After four days G-CSF treatment this number increased to 0.31 ± 0.14%, resulting in a significant 11.4 ± 8.5-fold increase from baseline levels (Fig. 3B and Table 1; p ≤ 0.018).
| Cell type | Pre-G-CSF | Post-G-CSF | Fold change after G-CSF | P values |
|---|---|---|---|---|
| CD34+ Cells (% of total MNCs) | 0.11 ± 0.01 | 0.31 ± 0.14 | 11.4 ± 8.5 | 0.018 |
| CD34+ CD38- (% of total CD34+) | 16.4 ± 2.1 | 29.93 ± 13.38 | 1.96 ± 0.32 | 0.056 |
| CD34+ CD38- (% of total MNCs) | 0.017 ± 0.003 | 0.096 ± 0.043 | 7.91 ± 1.99 | 0.034 |
| CD34+ CD38+ (% of total CD34+) | 80 ± 1.5 | 66.97 ± 29.95 | 0.84 ± 0.04 | 0.05 |
| CD34+ CD38+ (% of total MNCs) | 0.085 ± 0.01 | 0.2 ± 0.09 | 3.44 ± 0.8 | 0.014 |
| HSCs (% of total CD34+) | 3.43 ± 0.83 | 14.6 ± 6.53 | 4.6 ± 1.02 | 0.014 |
| HSCs (% of total MNCs) | 0.004 ± 0.001 | 0.047 ± 0.02 | 17.7 ±4.5 | 0.027 |
| MPPs (% of total CD34+) | 3.73 ± 1.22 | 12.6 ± 5.63 | 3.5 ± 0.68 | 0.031 |
| MPPs (% of total MNCs) | 0.004 ± 0.0008 | 0.035 ± 0.016 | 13.2 ±4.5 | 0.031 |
| CMPs (% of total CD34+) | 33.43 ±2.76 | 39.1 ± 17.5 | 1.24 ± 0.14 | 0.27 |
| CMPs (% of total MNCs) | 0.033 ± 0.004 | 0.105 ± 0.05 | 5.05 ± 1.64 | 0.021 |
| GMPs (% of total CD34+) | 13.2 ± 3.3 | 7.16 ± 3.5 | 0.71 ± 0.14 | 0.26 |
| GMPs (% of total MNCs) | 0.013 ± 0.003 | 0.023 ± 0.01 | 2.89 ± 0.8 | 0.32 |
| MEPs (% of total CD34+) | 33.2 ± 5.4 | 28.8 ± 12.9 | 0.76 ± 0.19 | 0.58 |
| MEPs (% of total MNCs) | 0.032 ± 0.006 | 0.069 ± 0.03 | 3.1 ± 0.6 | 0.01 |
| CLPs (% of total CD34+) | 6.9 ± 1.5 | 3.3 ± 1.5 | 0.59 ± 0.13 | 0.15 |
| CLPs (% of total MNCs) | 0.007 ± 0.0005 | 0.011 ± 0.005 | 2.1 ± 0.46 | 0.33 |
- Data shown are the means ± standard error of the mean in six subjects before and after G-CSF treatment. P values indicated were derived by a paired t test of data pre- and post-G-CSF.
The CD34+ CD38- subpopulation (Fig. 3, Panel A; containing HSCs and MPPs) at baseline comprised 16.4 ± 2.1% of total CD34 cells, and 0.017 ± 0.003% of total MNCs. After G-CSF mobilization, the CD34+ CD38- population increased to 29.93 ± 13.38% of total CD34+ cells and 0.096 ± 0.043% of total MNCs. This resulted in a borderline significant 1.96 ± 0.32-fold increase as a percentage of total CD34+ cells (p ≤ 0.056), and a significant 7.91 ± 1.99-fold increase as a percentage of total MNCs (Fig. 4, Panel A and Table 1; p ≤ 0.034).
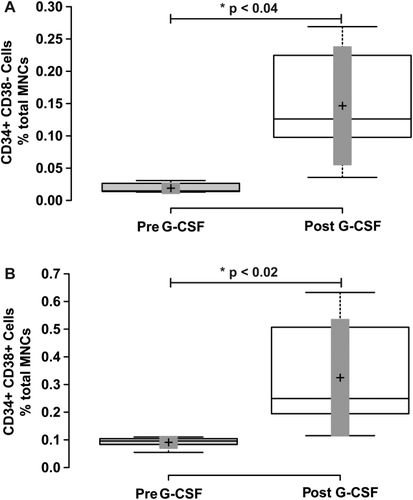
Mobilization of CD34+ CD38- and CD34+ CD38+ mononuclear cells with G-CSF treatment. Blood mononuclear cells were analyzed for CD34 and CD38 cell surface expression as shown in Figure 1A. Panel A shows a box-plot illustrating the change in CD34+ CD38- mononuclear cells before and after G-CSF treatment. Panel B shows a box-plot illustrating the change in CD34+ CD38+ mononuclear cells before and after G-CSF treatment. Center lines show the medians; box limits indicate the 25th and 75th percentiles as determined by R software; whiskers extend to minimum and maximum values; crosses represent sample means; bars indicate 90% confidence intervals of the means. n = 6 sample points before and after G-CSF treatment. P values for the comparison of pre- and post-G-CSF are indicated in the figure.
The CD34+ CD38+ subpopulation (Fig. 3, Panel A; containing lineage-specified HSPCs) at baseline comprised 80.4 ± 1.5% of total CD34 cells and 0.085 ± 0.01% of total MNCs. After G-CSF mobilization, the CD34+ CD38+ population decreased to 66.97 ± 29.95% of total CD34+ cells, but increased to 0.20 ± 0.09% of total MNCs. This resulted in a significant 0.84 ± 0.04-fold decrease as a percentage of total CD34+ cells (p ≤ 0.05), and a significant 3.44 ± 0.8-fold increase as a percentage of total MNCs (Fig. 4, Panel B and Table 1; p ≤ 0.014).
To assess mobilization of hematopoietic stem cells (HSCs) (CD34+ CD38- CD90+ CD45RA-) and multipotent progenitors (MPPs) (CD34+ CD38- CD90- CD45RA-) as defined by the literature 2, 3, we turned our attention to the CD34+ CD38- population of cells (Fig. 3A), and measured staining of CD90 and CD45RA (Fig. 5B). Prior to G-CSF treatment, the HSC population represented 3.43 ± 0.83% of total CD34+ cells and 0.004 ± 0.001% of total MNCs. After 4 days of G-CSF treatment, the HSC population increased to 14.6 ± 6.53% of total CD34+ cells and 0.047 ± 0.02% of total MNCs. This resulted in a significant 4.6 ± 1.02-fold increase as a percentage of total CD34+ cells (p ≤ 0.014), and a significant 17.7 ± 4.5-fold increase as a percentage of total MNCs (Fig. 5, Panel B and Table 1; p ≤ 0.027). The multipotent progenitor population (MPP) (CD34+ CD38- CD90- CD45RA-) at baseline represented 3.73 ± 1.22% of total CD34+ cells and 0.004 ± 0.0008% of total MNCs. With G-CSF mobilization the MPP population increased to 12.6 ± 5.63% of total CD34+ cells and 0.035 ± 0.016% of total MNCs. This resulted in a significant 3.5 ± 0.68-fold increase as a percentage of total CD34+ cells (p ≤ 0.031), and a significant 13.2 ± 4.5-fold increase as a percentage of total MNCs (Fig. 5, Panel C and Table 1; p ≤ 0.031).
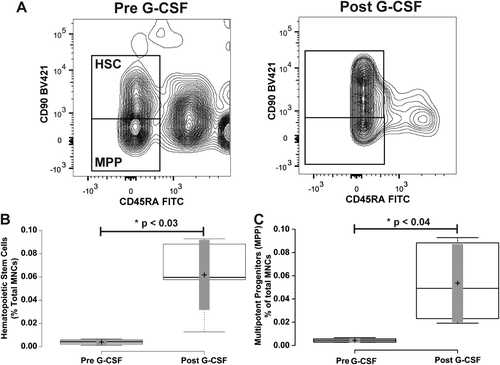
Mobilization of hematopoietic stem and multipotent progenitor cells. Panel A illustrates representative flow cytometry plots from a subject closest to the average of the cohort. CD34+ CD38- cells from Figure 1 were further resolved into CD45RA- CD90+ and CD45– CD90- cell populations. Gate boxes were positioned based on fluorescence minus CD45RA and CD90 stains (shown in Supporting Information, Fig. 2). Panel B shows a box-plot illustrating the change in CD34+ CD38- CD45RA- CD90+ hematopoietic stem cells before and after G-CSF treatment. Panel C shows a box-plot illustrating the change in CD34+ CD38- CD45RA- CD90- multipotent progenitor cells before and after G-CSF treatment. Center lines show the medians; box limits indicate the 25th and 75th percentiles as determined by R software; whiskers extend to minimum and maximum values; crosses represent sample means; bars indicate 90% confidence intervals of the means. n = 6 sample points before and after G-CSF treatment. P values for the comparison of pre- and post-G-CSF are indicated in the figure.
Next we quantified the subpopulations of cells within the CD34+ CD38+ cell population. The onset of CD38 expression coincides with restriction to specific hematopoietic lineages. Expression of CD123 and CD45RA 19 has been utilized to identify and distinguish the common myeloid progenitor (CMPs) (CD34+ CD38+ CD123+ CD45RA-) 5, granulocyte–monocyte progenitor (GMPs) (CD34+ CD38+ CD123+ CD45RA+), and megakaryocyte erythroid progenitor (MEPs) (CD34+ CD38+ CD123- CD45RA-) 1, 6, 20 populations in human bone marrow samples. We tested whether similar populations could be found in human venous blood, and if G-CSF mobilization significantly affected their levels in the blood stream. Similar to prior findings with human bone marrow samples 6, the CD34+ CD38+ population of cells contains three distinct populations of cells co-expressing CD123 and CD45RA. To test whether the frequency of each population changed in the blood stream with G-CSF mobilization treatment, we first quantified the common myeloid progenitor population (CMP) defined by CD34+ CD38+ CD123+ and CD45RA- (Fig. 6, Panel A). At baseline, the CD34+ CD38+ CD123+ and CD45RA- population represented 33.43 ± 2.76% of total CD34+ cells and 0.033 ± 0.004% of total MNCs. After G-CSF mobilization this population modestly increased in quantity to 39.1 ± 17.5% of total CD34+ cells and 0.105 ± 0.05% of total MNCs. This resulted in a nonsignificant 1.24 ± 0.14-fold increase as a percentage of total CD34+ cells (p > 0.27), but a significant 5.05 ± 1.64-fold increase as a percentage of total MNCs (Fig. 6, Panel B and Table 1; p ≤ 0.021).
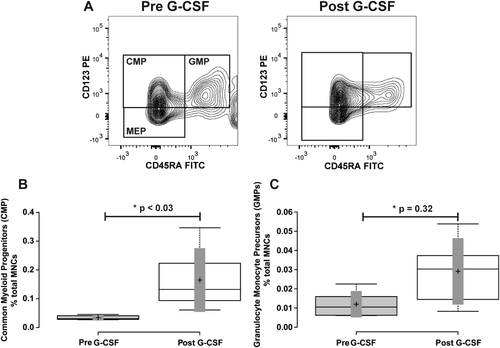
Mobilization of common myeloid progenitors, and granulocyte-monocyte progenitors. Panel A illustrates the representative flow cytometry plots from a subject closest to the average of the cohort. CD34+ CD38+ cells from Figure 1 were further resolved into CD45RA+ and-, and CD123+ and - cell populations. Gate boxes were positioned based on fluorescence minus CD45RA and CD123 stains. Panel B shows a box-plot illustrating the change in CD34+ CD38+ CD45RA- CD123+ common myeloid progenitor (CMP) cells before and after G-CSF treatment. Panel C shows a box-plot illustrating the change in CD34+ CD38+ CD45RA+ CD123+ granulocyte monocyte progenitor (GMP) cells before and after G-CSF treatment. Center lines show the medians; box limits indicate the 25th and 75th percentiles as determined by R software; whiskers extend to minimum and maximum values; crosses represent sample means; bars indicate 90% confidence intervals of the means. n = 6 sample points before and after G-CSF treatment. P values for the comparison of pre- and post-G-CSF are indicated in the figure.
We next quantified the granulocyte–monocyte progenitor population (GMP) defined by CD34+ CD38+ CD123+ and CD45RA+ (Fig. 6, Panel A). At baseline, the CD34+ CD38+ CD123+ and CD45RA+ population represented 13.2 ± 3.3% of total CD34+ cells and 0.013 ± 0.003% of total MNCs. After G-CSF mobilization this population decreased in quantity to 7.16 ± 3.5% of total CD34+ cells, but increased to 0.023 ± 0.01% of total MNCs. This resulted in a nonsignificant 0.71 ± 0.14-fold decrease as a percentage of total CD34+ cells (p = 0.26), and a nonsignificant 2.89 ± 0.80-fold increase as a percentage of total MNCs (Fig. 6, Panel C and Table 1; p = 0.32).
We then measured the megakaryocyte erythroid progenitor population (MEP) defined by CD34+ CD38+ CD123- and CD45RA- (Fig. 6, Panel A). At baseline, the CD34+ CD38+ CD123- and CD45RA- population represented 33.2 ± 5.4% of total CD34+ cells and 0.032 ± 0.006% of total MNCs. After G-CSF mobilization this population decreased in quantity to 28.8 ± 12.9% of total CD34+ cells, but increased to 0.069 ± 0.03% of total MNCs. This resulted in a nonsignificant 0.76 ± 0.19-fold decrease as a percentage of total CD34+ cells (p = 0.58), and a 3.1 ± 0.6-fold increase as a percentage of total MNCs (Supporting Information, Fig. 4 and Table 1; p ≤ 0.01).
Finally, among the CD34+ CD38+ cell types, we measured the common lymphoid progenitor (CLP) population defined by CD34+ CD38+ and CD127+ expression defined previously in human bone marrow samples 6. In human venous blood at baseline, CD34+ CD38+ CD127+ cells (Fig. 7A) represented 6.9 ± 1.5% of total CD34+ cells and 0.007 ± 0.0005% of total MNCs. With G-CSF treatment, this population of cells decreased as a percentage of total CD34+ cells to 3.3 ± 1.5%, and increased as a percentage of total MNCs to 0.011 ± 0.005%. This resulted in a nonsignificant 0.59 ± 0.13-fold decrease as a percentage of total CD34+ cells (p = 0.15), and a 2.1 ± 0.46-fold increase as a percentage of total MNCs (Fig. 7 and Table 1; p = 0.33).
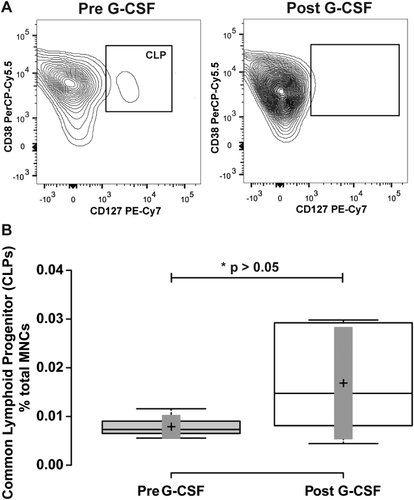
Mobilization of common lymphoid progenitors. Panel A illustrates representative flow cytometry plots from a subject closest to the average of the cohort. CD34+ CD38+ cells from Figure 1 were further resolved into CD38+ and-, and CD127+ cell populations. Gate boxes were positioned based on fluorescence minus CD127 stain. Panel B shows a box-plot illustrating the change in CD34+ CD38+ CD127+ common lymphoid progenitor (CLP) cells before and after G-CSF treatment. Center lines show the medians; box limits indicate the 25th and 75th percentiles as determined by R software; whiskers extend to minimum and maximum values; crosses represent sample means; bars indicate 90% confidence intervals of the means. n = 6 sample points before and after G-CSF treatment. P values for the comparison of pre- and post-G-CSF are indicated in the figure.
DISCUSSION
The findings of this study are 1 cells with the same cell surface marker profiles as found in human HSCs and HSPCs from bone marrow samples are present in human venous blood samples; 2 mobilization therapy with G-CSF results in significant increases in the quantity of total CD34+ cells, and cells expressing cell surface markers of HSCs, MPPs, CMPs, and MEPs as a percentage of total MNCs analyzed; 3 G-CSF treatment increased the quantity of cells expressing markers of CLPs and GMPs, but did not reach statistical significance; 4 G-CSF treatment predominantly increased the relative contribution of cells bearing markers of HSCs and MPPs in the total CD34+ cell population; CMPs and MEPs were enriched relative to total MNCs analyzed but not relative to total CD34+ cells. This indicates G-CSF did not significantly alter the contribution CMPs and MEPs to the total CD34+ cell pool in blood. Our findings support the use of multi-color flow cytometry to quantify blood borne cells expressing markers of HSCs and HSPCs.
There are multiple future applications for our flow cytometry approach. Measurement of HSCs and lineage specified precursors may be useful to more readily understand the effects of different stem cell mobilization agents such as AMD3100 and other emerging agents for translation to clinical use 21. The distinguishing features of successful HSPC preparations for transplantation are not well understood 22. It is plausible the compositions of mobilized CD34+ cells in an apheresis sample may play a role in clinical outcomes with transplantation. Our approach to simultaneously measure HSCs and HSPCs may facilitate greater understanding of the composition of mobilized stem cells that result in improved outcomes, and identify differences between stem cell donors.
The ability to measure HSCs and HSPCs in the blood stream facilitates measurement of the steady-state levels of these cells in human subjects with diseases that may impact their levels including myocardial infarction, stroke, hypercholesterolemia, and cancer. During the preparation of our manuscript, a study was published using a similar multicolor flow cytometry panel for measurement of HSCs and HSPCs in venous blood samples in human subjects. The investigators found in human subjects with cancer, the quantity of GMPs in the blood stream four- to sevenfold higher in subjects with cancer versus normal subjects 23. Patients with cancer also had similar increases in HSCs, and MPPs, and significantly lower numbers of CMPs. High levels of GMPs in the blood stream are associated with significantly worse outcomes. These findings illustrate the utility of multicolor flow cytometry of HSCs and HSPCs as a biomarker of disease severity.
The presence of cells in venous blood with overlapping marker expression as those found in bone marrow fractions with defined function as HSCs and HSPCs is important to advancing their quantification to understand their function in human diseases. Significant quantitative variability was noted in CLPs and GMPs between subjects in our study. In bone marrow, CLP content is significantly reduced with aging 6. In the recently published study of HSCs and HSPCs in the blood stream of normal subjects and patients with cancer, the quantity of circulating HSCs and MPPs significantly increased with age, CMPs were unaffected by age, and GMPs, MEPs, and CLPs decreased in frequency in the blood stream with age 23. In our study, we were blinded to the age of the subjects who donated blood samples and cannot make any assessment of the impact of age on CLP or GMP levels in blood samples and its effects on variability in levels between subjects. However, the use of a case–control study design with age matching of subjects should be considered for future studies of HSCs and HSPCs using our approach. Other factors affecting HSC and HSPC levels, including systemic inflammation or cholesterol levels, may also be expected to affect circulating cell levels based on animal model studies, but remain to be verified in human subjects.
In conclusion, we developed a multicolor flow cytometry approach to quantify the levels of circulating HSCs and HSPCs from human blood, and evaluated the ability of the panel to quantify changes in each cell population before and after mobilization with G-CSF. The findings provide an approach to understand effects of mobilization agents on the composition of mobilized CD34+ cells in the blood stream, and the response of the hematopoietic system to disease.
ACKNOWLEDGMENTS
Research Support:
Data and samples for this study were provided by the Data Bank and BioRepository (DBBR), which is funded by the National Cancer Institute and is a Roswell Park Cancer Institute Cancer Center Support Grant shared resource. Flow cytometry was performed at Roswell Park Cancer Institute's Flow & Image Cytometry Resource, which was established in part by equipment grants from the NIH Shared Instrument Program, and receives support from a Cancer Center Support Grant from the National Cancer Institute to the Roswell Park Cancer Institute, and the NYSTEM Consortia to Accelerate Therapeutic Applications of Stem Cells (Programming Hematopoietic Stem Cells for Long-Term Targeted T Cell Therapy of Patients with Relapsed Ovarian Cancer). The funders had no role in study design, data collection and analysis, decision to publish, or preparation of the manuscript.


