Use of internal control T-cell populations in the flow cytometric evaluation for T-cell neoplasms
Abstract
Objectives
Flow cytometry is an important tool for identification of neoplastic T-cells, but immunophenotypic abnormalities are often subtle and must be distinguished from nonneoplastic subsets. Use of internal control (IC) T-cells in the evaluation for T-cell neoplasms was explored, both as a quality measure and as a reference for evaluating abnormal antigen expression.
Methods
All peripheral blood specimens (3-month period), or those containing abnormal T-cells (29-month period), stained with CD45 V500, CD2 V450, CD3 PE-Cy7, CD7 PE, CD4 Per-CP-Cy5.5, CD8 APC-H7, CD56 APC, CD16&57 FITC, were evaluated. IC T-cells were identified (DIVA, BD Biosciences) and median fluorescence intensity (MFI) recorded. Selected files were merged and reference templates generated (Infinicyt, Cytognos).
Results
IC T-cells were present in all specimens, including those with abnormal T-cells, but subsets were less well-represented. IC T-cell CD3 MFI differed between instruments (p = 0.0007) and subsets (p < 0.001), but not specimen categories, and served as a longitudinal process control. Merged files highlighted small unusual IC-T subsets: CD2+(dim) (0.25% total), CD2− (0.03% total). An IC reference template highlighted neoplastic T-cells, but was limited by staining variability (IC CD3 MFI reference samples different from test (p = 0.003)).
Conclusions
IC T-cells present in the majority of specimens can serve as positive and longitudinal process controls. Use of IC T-cells as an internal reference is limited by variable representation of subsets. Analysis of merged IC T-cells from previously analyzed patient samples can alert the interpreter to less-well-recognized non-neoplastic subsets. However, application of a merged file IC reference template was limited by staining variability. © 2016 Clinical Cytometry Society
INTRODUCTION
Flow cytometric immunophenotyping is an important component of the diagnostic evaluation for leukemia and lymphoma 1. The lineage and immunophenotype of a neoplasm can be determined and used together with morphologic and genetic information for disease classification 1. In addition, neoplastic cells can often be distinguished from non-neoplastic cells using differences in light scatter and antigen expression 2. However, these flow cytometric determinations require an adequately designed, validated and controlled assay 3, 4. In addition to instrument and reagent quality control, it is important to include a process control to verify the performance of the entire analytical procedure (5,6). The component of non-neoplastic cells present within most specimens submitted for leukemia and lymphoma immunophenotyping fulfills the College of American Pathologists requirements for a positive assay control (IC) and has been recommended as a process control 6, 7. IC T-cells are present in most specimens and demonstration of their expected staining pattern has previously been reported as evidence that a flow cytometric assay for leukemia is performing adequately 8, 9. In this study, we investigated the use of IC T-cells in the evaluation for T-cell neoplasia, as both a quality measure and a reference for the detection of abnormalities in T-cell antigen expression.
Flow cytometric immunophenotyping has an established role in the evaluation for T-cell neoplasms, with abnormal antigen expression reported in up to 92% of neoplasms 10. However, T-cells with an abnormal phenotype can be difficult to recognize because the differences from normal are often subtle and must be distinguished from diverse non-neoplastic T-cell subsets 10-12. For example, in their study of peripheral T-cell neoplasms, Jamal et al. reported that only 14% of aberrancies of CD2 expression represented complete lack of staining 10. Detection of the more frequent subtle aberrations in CD2 expression has been reported to be difficult using visual inspection alone, and use of residual normal T-cells as an internal standard has been suggested 13. However, this approach is limited by phenotypic variation in non-neoplastic T-cell subsets and the presence of subsets that have a phenotype similar to that of T-cell neoplasms 14. For example, a subset of non-neoplastic CD7-negative, CD4-positive T-cells with a phenotype similar to that seen in cutaneous T-cell lymphoma (CTCL) is well recognized and, in comparison with other T-cells, may also demonstrate weaker intensity staining for CD2 and CD3 14, 15. Naïve CD4-positive T-cells characteristically display weak intensity staining for CD2 along with bright intensity staining for CD7 16. In addition, there are many less-well-recognized T-cell subsets, including CD8-positive, CD5-dim-positive T-cells.17 The variable presence of diverse T-cell subsets, with different levels of antigen expression, adds to the difficulty in identifying neoplastic cells.
In this study, we explored the comprehensive use of IC T-cells to assist in the distinction between neoplastic and non-neoplastic T-cells and their subsets. We demonstrate that IC T-cell populations are present in all peripheral blood specimens, including those involved by a T-cell neoplasm, but often smaller T-cell subsets contain too few cells to be consistently represented. Lack of IC T-cell subsets makes it difficult to correctly identify less well-recognized subsets and to use IC T-cells as a reference for the detection of phenotypic aberrancy. We also demonstrate that merged files from previously analyzed patient specimens provide a more comprehensive illustration of the expected IC T-cells and their subsets, and can be used to develop a reference template for the evaluation for phenotypic aberrancy.
MATERIALS AND METHODS
Specimen Selection
The study was approved by the Institutional Review Board of the University of Pittsburgh (IRB# PRO11060224). All peripheral blood specimens submitted to the University of Pittsburgh Medical Center Clinical Flow Cytometry Laboratory in June and July 2013 and July 2012, stained with the standard clinical 8-color T/NK-cell reagent combination (CD45 V500, CD2 V450, CD3 PE-Cy7, CD7 PE, CD4 Per-CP-Cy5.5, CD8 APC-H7, CD56 APC, CD16&CD57 FITC (Becton Dickinson, San Jose, CA)) and acquired with two FACS Canto-II instruments (BD Biosciences, San Jose, CA) (designated C-210 and C-217) were retrospectively reviewed. In addition, peripheral blood specimens involved by T-cell lymphoma were identified by searching all specimens stained with the same reagent combination, acquired on the same two instruments, from May 2011 to September 2013 that contained mention of an abnormal T-cell population or involvement by T-cell lymphoma or leukemia in the flow cytometric interpretation, or had another specimen diagnostic of involvement by T-cell lymphoma or leukemia and a peripheral blood evaluation. All dot plots and other available information were reviewed to identify cases considered positive for a mature T-cell neoplasm.
Specimens were divided into four categories based on the presence or absence of an abnormal cell population identified using conventional flow cytometric evaluation, and those with an abnormal cell population were further divided, based on the phenotype of the abnormal population present in the index peripheral blood specimen and information obtained from any other diagnostic specimens: T-cell, B-cell, or other (myeloid malignancies, either acute or chronic, and plasma cell myeloma).
Flow Cytometric Immunophenotyping
Specimen preparation and staining was performed as follows: 5 × 10⁵ cells were stained for 15 min on ice with a cocktail of directly conjugated antibodies. All antibodies were present at saturation, as determined by titration during cocktail design. Red blood cells were then lysed by the addition of 3 μL of ammonium chloride solution (8.26 g of ammonium chloride, 0.1 g of potassium bicarbonate, and 0.037 g of ethylenediaminetetraacetic acid in 100 mL deionized water) and incubated in the dark at room temperature for 8 min. After washing with PBS/0.1% sodium azide, the cells were fixed with formaldehyde (final concentration 1%). A total of 30,000 cells were acquired.
Instrument setup was performed using standard procedures. Although primarily used for T-cell subset enumeration, BD FACS 7-color Setup Beads (BD Biosciences, San Jose, CA) were used in combination with BD FACS Canto Clinical Software (BD Biosciences, San Jose, CA) during instrument startup to establish optimal performance. Daily instrument performance was then confirmed using Cytometer Setup and Tracking (CST) beads (BD Biosciences, San Jose, CA). Compensation was performed weekly for each fluorochrome and each tandem labeled antibody using antibody capture beads (BD Biosciences, San Jose, CA) and checked daily by visual inspection of clinical cases. CST beads were also used to improve instrument-to-instrument agreement (instrument cloning). Instrument C210 was selected as the primary instrument. After instrument setup and determination of baseline settings, voltages were adjusted on instrument C217 using application settings to achieve the target fluorescence intensity values identified on instrument C210. The performance of each instrument was monitored using the Cytometer Setup Report and Cytometer Performance Report (BD Biosciences, San Jose, CA) and associated Levy–Jennings plots. Lot-to-lot comparison of reagents was performed as necessary and instrument to instrument comparison was performed every 6 months using visual inspection of staining of patient specimens.
In addition to the conventional analysis performed in the clinical laboratory, reanalysis was performed using BD FACSDiva software (BD Biosciences, San Jose, CA) with a standard template to further evaluate T-cells and collect fluorescence intensity data, as follows. Doublet exclusion was performed using a dot plot of forward angle scatter (FSC)-area versus FSC-height. Then non-doublet events with low-angle side-light scatter were identified on a plot of CD45 versus SSC, and that population was displayed on a plot of CD2 versus CD3. T-cells were identified as a subset of the low side-light scatter population with staining for CD3. The low-angle side-light scatter population was also gated for CD7-positive, CD56-positive, and CD3-negative NK cells. Subsets of T-cells were then identified, including CD4+ CD8−, CD4+ CD8+, CD4− CD8 + bright, CD4− CD8 + dim, CD4− CD8−, CD7−, CD7 + bright CD2 + dim CD4+, CD3+ bright, CD16 and/or CD57+ CD56−, CD16 and/or CD57+ CD56+, CD16 and/or CD57− CD56−, CD16 and/or CD57− CD56+. For each subset, the MFI for all parameters was collected. An example of the template used can be seen in Figure 1. Dot plots were visually assessed for populations with an abnormal immunophenotype. Altered staining was defined as a half decade, or more, difference in intensity of staining from expected on a log scale. Absence of staining was defined as similar staining to other lymphoid populations lacking the antigen of interest.
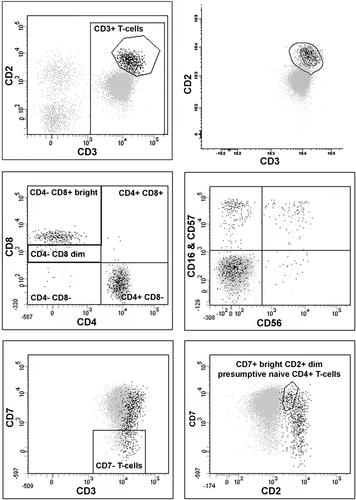
Flow cytometric analysis and gating strategy. Peripheral blood involved by cutaneous T-cell lymphoma with a CD2 + dim, CD3 + dim, mostly CD7+, CD4+, CD8− phenotype. The upper right plot demonstrates application of a reference template developed using Infinicyt software, developed from previously analyzed patient specimens, to highlight T-cells with a normal phenotype and assist in identifying a population with an abnormal phenotype falling outside the template. The other five plots demonstrate the standard data reanalysis template developed using DIVA (events displayed represent non-doublets with low-angle side-light scatter; all T-cells are identified with staining for CD3; T-cells with a normal phenotype are highlighted in black using the polygon gate drawn in the top-left plot).
Infinicyt software (Cytognos AL, Salamanca, Spain) was used to merge files from selected samples and perform analysis of the merged files as follows. All low-angle side scatter events staining for CD3 were identified and displayed on plots of CD3 versus CD2, CD3 versus CD7, CD2 versus CD7, CD4 versus CD8 and CD56 versus CD16 and CD57. A reference template was developed from the merged files using Infinicyt and then applied to three groups of specimens: the reference samples used to create the template, samples known to contain abnormal T-cell populations, and test specimens (Fig. 1). An abnormal population was defined as one where the majority of the events fell outside the outer border of the reference template (95% confidence limit). A minor shift was defined as a population that was shifted relative to the template, often best seen relative to the central tendency (inner circle) of the template, but the majority of events still fell within the 95% confidence limit.
Statistical Analysis
GraphPad Prism 6 (GraphPad Software, Inc., La Jolla, CA) was used to perform all statistical analysis, including descriptive statistics, Kruskal–Wallis nonparametric comparison of multiple groups and Mann–Whitney nonparametric comparison of paired groups.
RESULTS
Specimen Summary
Specimens (n = 153) were identified and divided into four categories based on the presence or absence of an abnormal cell population: no abnormal (n = 59), B abnormal (n = 28), T abnormal (n = 32), other abnormal (n = 34). The abnormal T-cell category included cases of cutaneous T-cell lymphoma (CTCL), T-large granular lymphocyte leukemia (T-LGL), T prolymphocytic leukemia (T-PLL), and peripheral T-cell lymphoma (PTCL) from 23 patients (Table 1). Visual inspection of the conventional flow cytometric analysis for the 32 abnormal T-cell specimens revealed 2 with no phenotypic abnormality (1 T-LGL and 1 PTCL), 6 with altered intensity of antigen staining only, 3 with lack of antigen staining only and 21 with both altered intensity and lack of antigen staining (Table 1). For some antigens, abnormal expression was more often represented by altered antigen expression than complete lack of staining: altered CD2 = 12/15 (80% of cases with abnormal expression) and lack CD2 = 3/15 (20% of cases with abnormal expression); altered CD3 = 14/19 (73.7%) and lack CD3 = 5/19 (26.3%). For other antigens, lack of antigen expression occurred more often: altered CD7 = 7/24 (29.2% of cases with abnormal expression) and lack CD7 = 17/24 (70.8% of cases with abnormal expression). Increased CD7 was only found in the 5 PLL cases, 3 of which also had weak intensity staining for CD2, similar to naïve T-cells. Specimens from the same patient demonstrated abnormal populations with a similar phenotype, but some variation between partial or dim staining and normal expression.
Presence of Internal Control T-Cell Populations
In general, it was considered that any population used as an internal control should contain at least 100 events in order to improve the validity of MFI determinations. IC total T-cells, forming a population of at least 100 events, were present in all but one specimen and demonstrated the expected staining for CD45, CD2, CD3, and CD7. One specimen with marked neutrophilia had only 37 T-cell events, but these formed a discrete population. T-cell subsets were less well represented, with 6 (3.8%) specimens lacking a significant CD4 + CD8− T-cell subset and 16 (10.3%) specimens lacking a CD4− CD8 + bright population (Table 2). NK-like T-cells staining for CD16, CD56, or CD57 represented even fewer events. Therefore, some specimens lacked sufficient internal T-cell subsets to adequately assess for staining of these antigens. Other cell populations, such as CD4-positive monocytes, could assist with quality assessment but were not evaluated in this study.
| Specimen Category | Number Specimens | Total T-cells (CD3+CD2+) | CD8-CD4+ subset | CD7+br, CD2+dim subset | CD8+br CD4- subset | ||||||||
|---|---|---|---|---|---|---|---|---|---|---|---|---|---|
| Internal control >100 events | CD3 MFI (median) | Internal control >100 events | CD3 MFI (median) | Internal control >100 events | CD3 MFI (median) | Internal control >100 events | CD3 MFI (median) | ||||||
| # | % | # | % | # | % | # | % | ||||||
| No Abnormal | 59 | 58 | 98.3 | 19,958 | 58 | 98.3 | 21,764 | 57 | 96.6 | 30,274 | 56 | 94.9 | 15,745 |
| B Abnormal | 28 | 28 | 100.0 | 21,266 | 28 | 100.0 | 23,656 | 25 | 89.3 | 26,806 | 27 | 96.4 | 17,889 |
| T Abnormal | 32 | 32 | 100.0 | 23,162 | 28 | 87.5 | 24,403 | 22 | 68.8 | 29,189 | 23 | 71.9 | 20,408 |
| Other Abnormal | 34 | 34 | 100.0 | 20,023 | 33 | 97.1 | 22,914 | 30 | 88.2 | 31,006 | 31 | 91.2 | 17,057 |
| Total | 153 | 152 | 99.3 | 21,048 | 147 | 96.1 | 23,784 | 134 | 87.6 | 29,081 | 137 | 89.5 | 16,547 |
- Number and proportion of cases with populations containing [mt]100 events. CD3 MFI (median) for each population and specimen type. No statistically significant different between CD3 MFI for specimen categories. CD3 MFI for CD8-CD4+ subset greater than CD8 + CD4− subset (p = 0.0002). CD3 MFI for CD7 + bright CD2 + dim subset greater than CD8-CD4+ subset (p = 0.0009).
In order to further evaluate whether information about IC populations could be extrapolated between specimens, the variability of antigen staining intensity was assessed between instruments and over time. This comparison focused on CD3 staining because of the prevalence of the total T-cell population and the expected relative uniformity of CD3 staining intensity, in contrast to the other antigens evaluated 9. CD3 MFI differed significantly between T-cell subsets: CD3 MFI CD8-CD4+ subset greater than CD8 + CD4- subset (p = 0.0002) and CD3 MFI CD7 + bright CD2 + dim CD4+ subset greater than total CD8-CD4+ subset (p = 0.0009) (Table 2). However, CD3 MFI did not differ significantly between specimen categories, when comparing IC total T-cells or selected T-cell subsets (CD4+ CD8−, CD4− CD8 + bright, CD7+ bright CD2 + dim) (Table 2 and Fig. 2A)
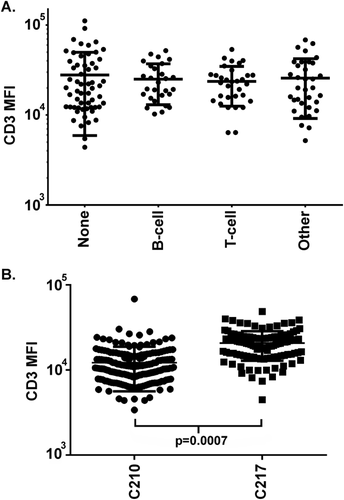
Comparison of total T-cell CD3 median fluorescence intensity. (A) Specimen types. No statistically significant difference in CD3 MFI between specimens containing no abnormal population (None), or abnormal B-cell, T-cell, or other populations. (B) Instruments. MFI = median fluorescence intensity. Horizontal bars represent median and interquartile range.
The CD3 MFI differed significantly between the two flow cytometry instruments: (p = 0.0007) C-210 CD3 MFI median 14,722 (n = 178), C-217 CD3 MFI median 24,973(n = 112) (Fig. 2B). Instrument-to-instrument comparisons performed in the laboratory over this period showed similar subjective staining by visual inspection, but were not critically evaluated for subtle numerical differences in staining. In addition, CD3 MFI varied over time for each instrument, including a significant shift in MFI when the instruments were moved to a new laboratory on June 29th, 2014 (C-210 before move CD3 MFI 10,694, after move CD3 MFI 42,268; C-217 before move CD3 MFI 20,528, after move CD3 MFI 33,831; p = 0.0001), as illustrated on a plot of CD3 MFI versus time of acquisition from March 2013 to September 2013 for C-210 (Fig. 3). Review of cytometer voltage from the setup reports, the longitudinal quality measure followed in the laboratory, did not identify a significant change over this period. However, further investigation revealed that application setting target values for instrument cloning had been determined using single outlying baseline values obtained from the designated instrument during the reinstallation, i.e., target values were selected when the primary instrument was not functioning adequately. Therefore, although the instruments performed within control limits before and after the move, and gave similar but not identical results, the MFI and location of the plotted cells had shifted. To prevent this problem from occurring again, MFI values are now monitored during instrument setup to monitor for shifts.
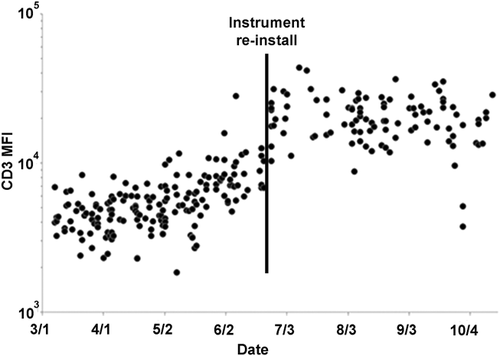
Longitudinal monitoring of total T-cell median fluorescence intensity for CD3 over time. Vertical line indicates a shift in CD3 median fluorescence intensity that occurred following relocation of the instruments. MFI = median fluorescence intensity.
In summary, IC populations from specimens run in the same batch, and run on the same instrument, demonstrated similar staining and were adequate to demonstrate functioning of the assay. However, comparison of IC staining between specimens highlighted differences between instruments and over time that might confound interpretation, particularly when evaluating for small shifts in antigen staining. Indeed, the IC population MFI of recent previously analyzed patient specimens could be used as a longitudinal quality measure to help highlight changes.
Characterization of Non-Neoplastic T-Cell Subsets Using Merged Files
Given the relative uniformity of IC population staining for specimens run on the same instrument during periods remote from the laboratory move, previously analyzed patient specimens were merged to further explore the presence of less-well-recognized non-neoplastic subsets that might be encountered in the peripheral blood with this 8-color antibody/fluorochrome combination.
Files from 20 specimens received in the beginning of June 2013 and acquired using the same instrument were merged and analyzed. Analysis of this merged file helped to highlight small subsets with unusual phenotypes, which might be mistaken for phenotypically abnormal T-cell populations. A double CD4- CD8- population, likely representing gamma-delta T-cells, was identified (2,540 events, 0.42% total events, 2.96% T-cells) and demonstrated variable intensity staining for CD3, including some cells with bright intensity staining for CD3, and weaker intensity staining for CD2. A subset of cells with weak intensity staining for CD2 (1,495 events, 0.25% total events, 1.74% T-cells) had a CD8 mostly positive, CD16- and/or CD57-positive, and CD56-negative NK-like T-cell phenotype (Fig. 4).
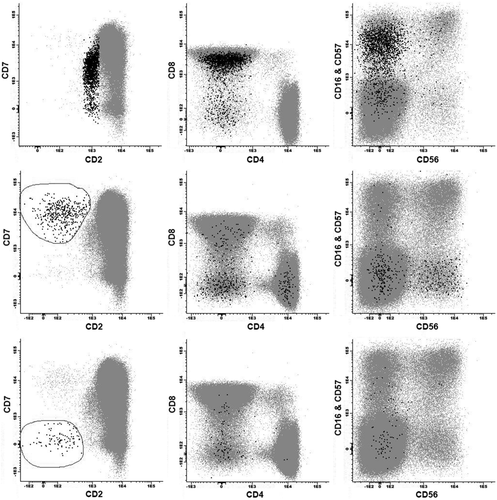
Identification of small, less well-recognized T-cell subsets in peripheral blood using merged previously analyzed patient files. Top row of three plots displays data from 20 merged files and highlights in black a subset of CD2 + dim T-cells with a CD8+, CD16 and/or CD57-positive phenotype. Lower two rows display data from 50 merged files and highlight in black small subsets of CD2−, CD7+ bright and CD2−, CD7− T-cells.
To further explore a small subset of CD2-negative events, an enhanced merged reference file was generated by adding 30 specimens (total of 50 specimens from May and June 2013). This enhanced reference demonstrated two populations of CD2-negative T-cells, which together represented 0.03% of total events, and included one population positive for CD7 (420 events, 0.025% total events, 0.14% T-cells) and one population with lack of staining for CD7 (129 events, 0.008% total events, 0.043% T-cells), both of which included some double CD4- CD8- T-cell events (Fig. 4).
Reference Template Generated from Previously Analyzed Specimens
Merged previously analyzed patient specimens acquired prior to the instrument relocation were used to develop a reference template of expected non-neoplastic T-cell subset staining which could be applied in the evaluation for abnormal T-cells (Fig. 4). A reference template, with an outer border representing the 95% confidence interval based on the distribution of events (density), generated from 20 specimens received in the beginning of June 2013 and acquired using the same instrument, was evaluated by applying it to three sets of specimens: those used to generate the reference (n = 20), test specimens run during the same month on the same instrument (n = 16), and abnormal T-cell specimens (n = 32) (Table 3).
| Specimens |
Abnormal population on morphologic review Number (%) |
Merged reference template | |
|---|---|---|---|
|
Abnormal population outside reference Number (%) |
Shifted template relative to internal control populations Number (%) |
||
| Reference (n = 20) (early June 2013) | 0 | 0 | 5 (25) |
| Test (n = 16) (late June 2013) | 3 (18.8) | 5 (31.3)b | 10 (62.5) |
| Abnormal T-cell (n = 32) (2011–2013, excluding June 2013) | 31 (96.9)a | 28 (87.5)c | 17 (53.1) |
- a One specimen involved by PTCL had an expanded CD8 positive T-cell population similar to that seen in a diagnostic lymph node specimen, but lacked a population with an abnormal phenotype on morphologic review. The reference template highlighted slightly brighter staining for CD3.
- b In addition to the three abnormal samples identified by morphologic review, two additional specimens had populations outside of the reference template, which could represent small non-neoplastic T-cell subsets not adequately represented by the template: CD2 negative-dim positive, CD7+ bright (T0214) with an appearance similar to one of the populations identified with the merged files; CD3 + dim, CD7 + dim (T0202).
- c Three abnormal T-cell specimens with a CD7 negative or partially positive T-cell phenotype identified by conventional morphologic analysis lacked populations falling outside the reference template.
As expected, the reference specimens demonstrated scattered cells, but no abnormal populations falling outside the reference template (Table 3). However, minor shifts in the staining intensity of IC populations relative to the contours inside the reference template were noted for 5 of 20 (25%) reference specimens, with slightly dimmer CD2, dimmer CD3, brighter CD3, brighter CD56, and brighter CD16 and/or CD57.
The abnormal T-cell specimens demonstrated populations falling outside the reference template for 28/32 (87.5%) specimens (Table 3), including 1 specimen with no abnormal phenotype detected by conventional analysis: CD3 slightly brighter than reference. Three specimens with CD7 negative or partially positive T-cell populations identified by conventional analysis fell within the template. In addition, minor shifts in IC populations relative to the contour lines of the template were encountered (Fig. 5), and were more frequent in the abnormal T-cell specimens than the reference specimens, likely reflecting the longer period over which the specimens were collected and/or inclusion of data from both instruments: 17/32 (53.1%).
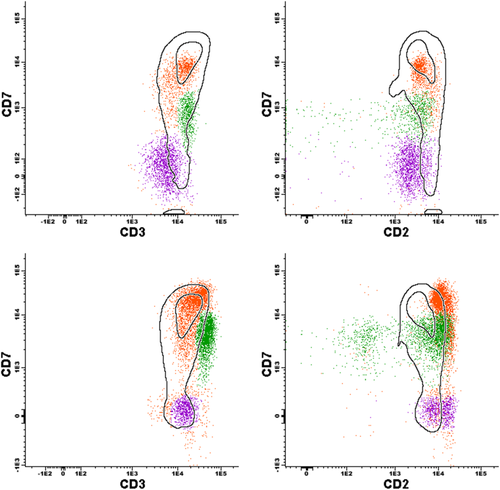
Application of reference template developed from previously analyzed patient specimens. Two specimens from one patient with CTCL. Top row: specimen demonstrating an internal control T-cell population highlighted in orange (CD3+, CD7+ bright, CD2+) falling within the template, a subsequently confirmed gamma-delta population highlighted in green (CD3+ bright, CD7+ dim, CD2 variable including a small CD2 negative component) not entirely contained in the template, and an abnormal population highlighted in purple (CD3+ dim, CD7−, CD2+ dim) falling outside the template. Lower row: another specimen from the same patient demonstrating similar populations to the previous specimen, but with a minor shift of the orange internal control populations relative to the template, making it difficult to recognize the abnormal CD7− population.
For the test specimens, minor shifts in staining of IC populations relative to the contour lines within the template were demonstrated for 10 of 16 (62.5%) specimens, 8 with slightly brighter CD3, 2 with slightly brighter CD2, 3 with slightly brighter CD7, 3 with slightly brighter CD8, 2 with slightly brighter CD4, and 1 with slightly brighter CD16 and/or CD57. In order to further investigate these minor shifts, the CD3 MFI of IC T-cell populations was compared between reference and test specimens and found to be statistically different (p = 0.003). A population falling outside the template was demonstrated for 5 of 16 (37.5%) test specimens, including 3 known to include abnormal T-cell populations using conventional analysis (Table 3). The two other test specimens with populations outside the reference template demonstrated small populations that could represent small non-neoplastic T-cell subsets not adequately represented by the template: one with a CD2 negative, CD7+ bright population similar to that identified with the merged files and one with a small CD3 + dim, CD7 + dim population of uncertain significance.
In summary, the reference template helped to highlight phenotypic abnormalities, but its utility was limited by subtle specimen to specimen variation in the staining of IC populations and inadequate representation of some very low-frequency non-neoplastic subsets.
DISCUSSION
IC populations have been recommended as a useful quality control measure for flow cytometric immunophenotyping 5, 8, 18. Evaluation of normal populations of cells for their expected staining pattern can confirm that the entire flow cytometric system is functioning effectively, including instrument set-up and performance, cell preparation, reagents, and antibody staining 5, 8. For example, the T-cell lineage of a lymphoid malignancy can be determined with greater confidence if non-neoplastic T-cells are present and demonstrate appropriate staining for T-cell and other lineage associated antigens 8. In addition, IC populations can be used in the assessment of phenotypic abnormalities 8, 13. For example, weak-intensity staining for CD3 is more likely to be abnormal, and not an artifact, if there are IC T-cells in the same specimen demonstrating the expected intensity of staining. In this study, we evaluated the performance of IC populations as an objective quality measure for an 8-color flow cytometric tube evaluating the T- and NK-cell associated antigens CD3, CD2, CD7, CD4, CD8, CD16, CD56 and CD57, and CD45. Although a population of IC T-cells was present in all specimens evaluated, including those that also contained an abnormal T-cell population, T-cell subsets were less well represented, often containing fewer than 100 events (Table 2). For example CD7 + bright CD2 + dim presumptive naïve CD4+ T-cells were poorly represented in over 30% of specimens containing a population of abnormal T-cells. Without consistent representation, T-cell subsets with less-well-recognized phenotypic differences could easily be mistaken as abnormal. Indeed, in this study, we confirmed the previously identified differences in CD3 expression between CD4- and CD8-positive T-cell subsets 14. Although increasing the number of acquired events would improve the ability to detect T-cell subsets, some phenotypically unusual T-cell subsets represent a very low proportion of total events and might require acquisition of a million or more events to be consistently recognized. Therefore, we explored an alternate approach, using combined previously analyzed files, from a period remote from the instrument relocation, to create a composite representation of IC T-cells that could be applied to the interpretation of a new specimen.
In order to evaluate the feasibility of combining IC information from previously analyzed specimens, the variability between specimens was assessed. No significant difference in IC staining was identified between specimens that also contained abnormal cells, including abnormal B-cells, abnormal T-cells or other abnormal cells (Fig. 2A). However, significant differences were identified between data obtained from different instruments, despite instrument cloning using commercial beads (Fig. 2B). The need for standardization of flow cytometric assays between instruments is well recognized and has led many laboratories to switch from using target voltages to using application-specific target channels 19-23. The goal of this strategy is to have non-neoplastic populations consistently fall in the same position on dot-plots, regardless of the instrument used. Although this effort has resulted in more comparable data sets, it is acknowledged that setting a target channel for a bright reference bead does not guarantee identical results because of differences in instrument dynamic ranges 19, 21. The difference in MFI seen between instruments in this study emphasized the need to use an identical system for control and specimen testing, particularly if the goal of the assay is to identify small shifts in staining. Indeed, these results suggest that it might be more appropriate to standardize results using patient cells, through monitoring of IC cell populations, rather than relying only on commercial instrument set-up beads 24. In addition, given the presence of well-defined normal T-cell subsets in nearly all samples, a plot of MFI over time can be used to monitor performance of the entire process and alert the interpreter to unexpected change, in a similar fashion to monitoring of red blood cell indices for hematology analyzer quality control (Fig. 3) 25. Application of this longitudinal approach in our laboratory demonstrated a major shift in the MFI of IC T-cell subsets after flow cytometry instrument relocation due to less than optimal application settings being applied for instrument cloning, and resulted in introduction of cell population MFI monitoring as a routine quality measure. However, remote from the move, the MFI was more stable and could be used to combine IC information.
With the goal of generating a more comprehensive representation of IC subsets, files from 20 previously analyzed patient samples acquired on one instrument during a period with relatively stable CD3 MFI were merged. Analysis of these merged files helped to highlight subsets of cells with a phenotype characteristic of naïve CD4+ T-cells, with a CD7 bright, CD2 dim phenotype, and gamma-delta T-cells with a CD4-negative, CD8-negative phenotype and variable staining for CD2 and CD3 (Fig. 4) 16, 26-29. In addition, very small populations of CD2-negative T-cells were highlighted, and were better represented in an enhanced reference file generated from 50 patient specimens (Fig. 4). A small subset of CD2-negative T-cells has previously been reported to represent approximately 0.1–0.8% of all human peripheral blood mononuclear cells, and includes both alpha-beta and gamma-delta subsets 30-32. The information obtained using merged IC previously analyzed patient files helped to highlight these less-well-recognized T-cell subtypes and could help to prevent misinterpretation as a phenotypic aberrancy. In future, it will be of interest to further characterize these small subsets of T-cells using “deep” acquisition of millions of events in representative individuals.
Knowledge of the expected staining pattern of T-cells, and their subsets, is essential for the detection of phenotypic aberrancy. Although IC T-cells provide a valuable reference against which populations of interest can be compared, this approach is limited by under-representation of phenotypically diverse T-cell subsets. Therefore, we explored the use of an IC reference template generated from merged previously analyzed patient samples that could be applied to new specimens and provide the interpreter with more comprehensive information about the expected staining pattern of non-neoplastic T-cells and their subsets. Although, in theory, this strategy could include a case with unrecognized abnormal T-cells, populations representing <20% of IC events should not have a significant impact on the 95% confidence interval of the reference template. However, in a similar fashion, this approach will also exclude rare non-neoplastic subsets from the template, such as the small CD2-negative T-cell populations identified in the merged file analysis. In contrast, the reference template could include frequent encountered small populations, such as clonally expanded CD8 positive T-cells in the elderly 33. However, given the uncertain clinical significance of these expanded populations, it might be prudent not to interpret their presence as significant evidence of T-cell neoplasia. A reference template generated from 20 previously analyzed patient files during a period with stable T-cell MFI helped to highlight small IC T-cells and T-cell populations with an abnormal phenotype, including one that displayed a minor difference from normal that was not detected by visual inspection (Table 3 and Fig. 5). However, as expected, the small CD2-negative populations identified by visual inspection of the merged files fell outside the template and not all T-cell populations demonstrated detectable abnormalities. In addition, this approach was also limited by variability in staining between specimens, even for this period remote from the instrument relocation. One strategy to decrease this variability might be to adopt a standardized system, such as proposed by the EuroFlow consortium 34, and develop MFI entry criteria for a specimen to be fit for evaluation against a reference. A potential alternative strategy might be to normalize flow cytometric data from previously analyzed specimens 35, 36, and develop a normalized template that could be applied to the analysis of new data, using the more prevalent IC T-cell populations as placeholders
In conclusion, IC T-cell populations are present in the majority of clinical peripheral blood samples and can be used to assess the quality of data from the individual specimen and the performance of the flow cytometry system over time. However, use of IC T-cells in the assessment for T-cell neoplasms is limited by under-representation of T-cell subsets. Merged files from previously analyzed patient specimens help to highlight small non-neoplastic T-cell subsets, including those with less-well-recognized phenotypes that might be mistaken as abnormal, and can be used to create reference templates. These strategies have the potential for assisting less experienced interpreters, particularly when assessing flow cytometric immunophenotyping data for small populations with subtle abnormalities in a background of diverse normal subsets, but are limited by variability of staining.


