Application of flow cytometry for myelodysplastic syndromes: Pitfalls and technical considerations
Abstract
The application of flow cytometry (FC) is recommended as part of the diagnostic approach for MDS. The complexity of flow cytometric analysis of bone marrow cells in MDS has been an obstacle for general application. However, in the past years several studies showed practical flow cytometric approaches for the diagnosis and prognosis of MDS. In this report we discuss technical considerations and highlight issues that require special attention when handling and analyzing bone marrow samples of patients with cytopenia and suspicion of MDS. © 2015 Clinical Cytometry Society
In the past years, the number of publications investigating the diagnostic and prognostic value of FC for MDS has increased 1-13. The application of flow cytometry (FC) for myelodysplastic syndromes (MDS) is based on the concept that altered hematopoiesis can be studied by measuring antigen expression levels during differentiation. Knowledge of antigen expression in hematopoietic cells in healthy individuals is obligatory in order to identify abnormal hematopoiesis. Knowledge of phenotypic abnormalities in the bone marrow (BM) that are caused by other disorders is of relevance in order to differentiate from MDS. Especially since flow cytometry is regarded as a recommended technique for the diagnosis of MDS, next to morphologic examination and/or cytogenetics 14, 15.
Furthermore, several studies have shown that flow cytometric analysis of BM of patients with MDS provides prognostic information, in addition to currently used prognostic models such as the Revised International Prognostic Scoring System (IPSS-R) 12.
An international consortium, together with the European LeukemiaNet working group for FC in MDS (IMDS-Flow) formulated recommendations for standardization of flow cytometric analysis of bone marrow (BM) aspirates from patients with MDS 16-20. The first meeting was held in 2008 and recommendations were adjusted parallel to developments in the field of FC, such as transition from four-color to eight-color FC. So far, flow cytometric analyses for MDS have been regarded as complicated procedures requiring specific expertise. The purpose of this article is to give technical considerations, address potential pitfalls and to indicate points that require special attention when analyzing BM samples of patients with cytopenia and suspicion of MDS. Issues are addressed by examples of flow cytometric analyses of healthy subjects and patients with confirmed MDS. Pitfalls and technical issues in flow cytometric analysis of BM analyses are supported by figures with examples from our laboratory and Table 1 provides an overview of keypoints. In previously published studies by our group, the methods that were used to process and stain BM samples are extensively described 2, 6, 12, 13.
| Sample handling |
| Lysing procedure |
| Erythroid cells might be affected by the lysing procedure |
| Lyse-stain-wash is recommended to prevent suboptimal antibody to (erythroid) cell ratio |
| Increasing the volume of the lysing solution rather than the duration of lysing improves lyses of erythrocytes |
| Time to processing |
| Bone marrow samples should be analyzed within 24 h |
| Fixation, time-delay after staining and storage at 4°C influences flow cytometric analysis |
| Keep conditions for sample handling and processing as constant as possible |
| Sample quality: peripheral blood contamination |
| At least 250 cells of each cell population of interest should be measured |
| Bone marrow subpopulation specific |
| Myeloid and B cell progenitor cells |
| The combination of CD11b, CD13, CD117, and/or HLA-DR in combination with CD34 and CD45 is recommended |
| for analysis of myeloid progenitor cells |
| B cell progenitor cells can be differentiated by using CD19 in combination with SSC properties and CD45 |
| Maturing myeloid cells |
| Eosinophils, paroxysmal nocturnal hemoglobulinuria and apoptic myeloid cells can interfere with analysis |
| Monocytes |
| Hypogranular and/or aberrant myeloid cells, apoptotic monocytes can interfere with analysis |
PITFALLS DUE TO SAMPLE HANDLING FOR FLOW CYTOMETRIC ANALYSES
Lysing Procedure
The majority of studies that investigate the application of FC for MDS, focus on the analysis of differentiating myelomonocytic cells in the BM. To prevent hindrance of red blood cells in the analysis, lysis of mature red blood cells is performed by using lysing procedures, preferably with ammonium chloride. Differences between laboratories in lysing procedure are common and vary from the kind of lysing solution that is used, lysing at room temperature, on ice or 37°C, for 5 min or up to 15 min. There is no empiric evidence for what is the best red blood cell lysing procedure for the preparation of a BM sample from patients with MDS 21. The lysing procedure might affect nucleated erythroid cells that remain in the sample. Previously, it was described that red blood cell lysis affects the nucleated erythroid cells by reducing cytoplasm or reducing the cells to naked nuclei, which might influence the analysis of surface antigen expression on maturing erythrocytes 21. In contrast to a more recently published investigation, reporting that the lysing procedure only affected light scatter properties of erythrocytes, but not antigen expression in a qualitative manner 20. It was proposed that CD105pos erythroid cells are resistant to lysis due to lack of the enzyme carbonic anhydrase required for ammonium chloride lysis.
Furthermore, it is recommended to perform a lyse-stain-wash procedure instead of stain-lyse-wash. The ratio of antibody to maturing erythroid cells is not optimal in excess of mature erythrocytes when the stain-lyse-wash procedure is used, especially when analyzing the erythroid lineage. Experiments from our center indicated that increasing the lysing solution to sample volume ratio improves the lysis procedure of mature erythroid cells, rather than increasing the duration of the lysing procedure or repeating the lysing step. The latter would not be recommended since it may result in additional cell loss. Increasing the lysing solution volume would be of particular interest in samples with low white blood cell count. In these cases it is necessary to use a larger volume of the sample to obtain sufficient cells for flow cytometric analysis. Interestingly, erythroid cells of patients with MDS tend to be partly resistant to lysis, resulting in an increased number of erythroid cells remaining in the sample (Fig. 1). An increased number of erythroid cells remaining in the sample after lysis might create a potential pitfall for analysis of antigen expression on erythrocytes. CD235a levels might be falsely interpreted as decreased due to an increased ratio between erythrocytes and the amount of available antibody to stain. The degree of resistance to lysing procedures can be measured by quantifying the remaining number of erythroid cells in the sample. However, it was agreed on by members of IMDS-Flow that CD235a is not recommended to use as a single marker for flow cytometric analysis of MDS due to pitfalls associated with the application of CD235a.
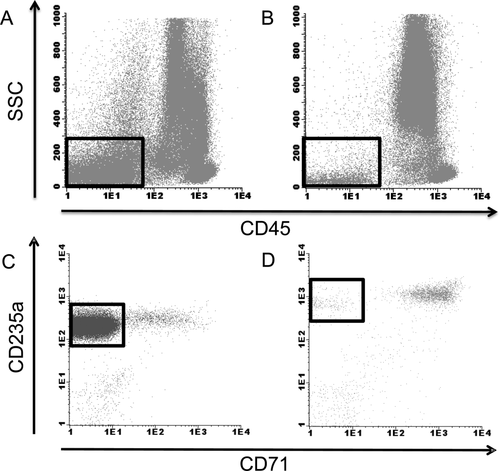
Red blood cell lysis in a MDS bone marrow aspirate compared with that of a healthy volunteer erythroid cells are indicated by squares in A and B. (A) Flow cytometric analysis of the BM of a patient with MDS refractory anemia with ring sideroblasts that appeared to be partly resistant to red blood cell lysis by ammonium chloride; this is illustrated by an increased number of SSCdim and CD45dim-neg cells with expression CD235a. (B) Representative flow cytometric analysis of the BM of a healthy volunteer with normal response of red blood cells to the lysing procedure. (C) Excess of mature CD71negCD235pos erythroid cells (indicated by the square) after lysis. Consequently, CD235a expression is lower because of a suboptimal antibody to mature erythroid cells ratio. (D) In comparison, representative erythroid analysis of the BM of a healthy volunteer with normal response of red blood cells to lysis and normal levels of CD71 and CD235a expression.
Assessment of erythrocyte differentiation by FC in BM for MDS is currently under investigation by members of the IMDS-Flow consortium. The first results indicate that CD36, CD71, CD105 and CD117 are of interest for the differentiating MDS from non-MDS cases 21-23. CD235a can still be applied in combination with CD71 to estimate abnormalities in the differentiation pattern of erythrocytes but is not recommended as a single marker due to artefacts associated with lysing procedures. Heterogeneity vs. homogeneity of CD36 and CD71 on erythroid cells which is indicated by the coefficient of variation by FC might be of interest to differentiate MDS from non-MDS 21.
Time to Processing
It is recommended by IMDS-Flow to process a BM sample within 24 h after it is drawn. However, this might not be feasible for every laboratory, for example due the time that is needed to transport the sample. In addition, after staining, samples should be measured as soon as possible and preferably after fixation. Therefore, we investigated the effect of delay in time to analysis by FC after incubation with antibodies and whether fixation and/or storage at 4°C might prevent time-related changes in antigen expression levels. A delay in the time between staining and analysis results in an increase in sideward scatter (SSC) of neutrophils (Fig. 2). The SSC of neutrophils was calculated as a ratio to the SSC of lymphocytes as internal reference. Moreover, fixation and time delay after fixation enhances this increase in SSC ratio. Storing of stained samples at 4°C further enhanced this effect. Evaluation of the SSC, which is an indication of granularity of neutrophils by FC is an important parameter included in diagnostic and prognostic tools for MDS 1, 4. Time-related and fixative related changes might result in an inadequate interpretation of neutrophil SSC unless procedures are standardized. Other effects of time-delay, fixation and storage at 4°C included an underestimation of the number of CD14pos monocytes, caused by formation of duplets and an increased SSC (Fig. 3). Subsequently, the duplets of monocytes cannot be adequately gated and are lost for further analysis due to increased SSC and interference of neutrophils.
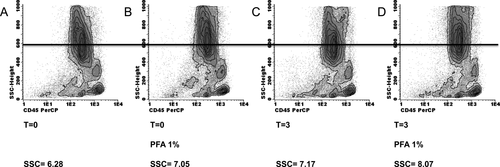
Time and fixative use related changes to the SSC of myeloid cells in a BM sample Maturing myeloid cells are defined by SSChigh and CD45intermediate. The SSC of maturing myeloid cells is calculated as a ratio to lymphocytic cells. Tested in three patients with MDS, with consistently increased SSC of neutrophils upon time delay and/or fixative use. The range of increase in SSC was between 0.77 and 2.77 points when fixative was applied and measured without time delay. Time delay further increased the SSC. (A) In this pathologic control, the SSC is normal compared with the reference value of the healthy volunteer cohort. The BM sample is measured at time point 0, without time delay and use of paraformaldehyde 1% solution (PFA) as a fixative. (B) Flow cytometric analysis of the same BM sample, with the use of PFA 1% as the only variation compared with the analysis as depicted in A. The SSC of myeloid cells is increased by 0.77 points. (C) Analysis of the same BM sample with a 3-h time delay between completing the staining procedure and measurement. Compared with time point 0 with or without fixation, the SSC is increased. (D) A time delay of 3 h in combination with the use of PFA 1% solution as a fixative results in a further increase of the SSC ratio of myeloid cells.

The effect of time-delay and fixation with paraformaldehyde solution on the analysis of monocytes Monocytes were gated by foreward scatter (FSC), sideward scatter (SSC), CD14, CD33 and CD45 properties and then backgated in the FSC vs. SSC plot. (A) At time-point 0 “viable” monocytes are located within the large gate. Few monocytic cells are within the smaller “nonviable” cell gate. (B) After 3 h, the number of “nonviable” monocytes is increased (small gate) as compared with plot A. “Viable” monocytes are gated by the larger gate. (C) Fixation with paraformaldehyde 1% solution and after 3 h of time delay prevents monocytic cells from becoming FSC low or “nonviable.”. [Color figure can be viewed in the online issue, which is available at wileyonlinelibrary.com.]
A positive effect of using fixative is the conservation of antigen expression levels. This especially relates to expression levels of CD11b and CD14, which seemed to be most sensitive for time-related decline in our experience.
In summary, awareness of the effects of variables on flow cytometric analysis such as time delay, fixative use or the type of anticoagulant in which the sample is drawn (e.g., EDTA can affect CD11b expression in contrast to heparin) is the most important. So, the procedures in sample processing and analysis should be as constant as possible. Each laboratory should have its own reference values. Any change that is made to sample handling procedures, processing and analysis should be tested for effects on sample quality and antigen expression levels.
CHOICE OF FLUOROCHROMES AND ANTIBODY COMBINATIONS
The IMDS-Flow made recommendations for flow cytometric parameters that should be minimally analyzed 16, 18. Definitions are given for each cell population of interest to detect abnormalities of subpopulations in the BM. The working party did not strive for complete uniformity in antibody combinations and fluorochromes because it is still under investigation which flow cytometric parameters are most relevant for the clinical application, either diagnostic or prognostic, in MDS. Since the development of the first MDS FC proposal, the number of fluorochromes and hence antibody combinations that can be used has rapidly increased. Together with the increase in possibilities, the amount of output increased and the analysis became more and more elaborate. Furthermore, the use of more than four color FC requires extra attention with regard to optimal instrument settings and for stability and spectral overlap of fluorochromes. The EuroFlow consortium published protocols and instrument settings for eight color FC for the diagnostic work up of haematological malignancies; specifically AML and lymphoid malignancies 24. This panel enables interchangeability and standardization between laboratories. Their AML panel shows overlap with the antibody combinations that are recommended by IMDS-Flow 16, 18. HLA-DR, CD34, CD117, and CD45 are used as a backbone marker in the EuroFlow panel. Adding CD11b, CD13, and CD16 to the backbone markers provides analysis of maturing myeloid, whereas the second antibody combination CD14, CD64, CD300e, and CD35 can be applied for analysis of monocytic differentiation. CD33 in the third combination of CD36, CD71, and CD105 can serve as an additional method in differentiating between monocytes and neutrophils as recommended by the IMDS-flow working party. Analysis of terminal deoxynucleotidyl transferase (TdT), necessary in analysis of acute leukemia, is not recommended for the analysis of MDS. Adding TdT to a panel requires the use of fixation and permeabilization solutions, which affect forward scatter (FSC) and SSC properties of cells. Furthermore, assessing the SSC of (maturing) myeloid cells is a diagnostic and prognostic flow cytometric criteria for MDS 4, 11. Lineage infidelity marker expression on myeloid progenitors should be analyzed according to IMDS guidelines. Most are accounted for in the Euroflow panel; however, CD5 is excluded. CD5 is found in a minority of patients with MDS, ∼7% in our cohort of patients with MDS, mainly patients with high risk MDS (unpublished data). Therefore, a critical appraisal of antibody combinations is required taking into account the BM disorders for which its use is intended. Moreover, changing panels and fluorochromes affects the appearance of differentiation patterns and requires acquisition of new reference values. Further remarks on antibody combinations will be made in the sections below.
Pitfalls Due to Sample Quality: Peripheral Blood Contamination
Peripheral blood contamination in the BM is frequently encountered in laboratory practice e.g., due to BM fibrosis. As a result, acquisition of sufficient number of cells for flow cytometric analysis can be challenging, especially regarding progenitor cells. If <250 events of a cell population of interest are measured, the analysis is regarded as less reliable to make any definite conclusions on aberrant marker expression. The minimum amount of events is set at 25, to consider a population of cells as aberrant by marker expression measured by FC. Moreover, contamination with peripheral blood can influence CD45 and SSC properties of neutrophils. The most mature neutrophils are higher in CD45 expression and lower in SSC compared with more immature neutrophils. Furthermore, the lack of more immature myeloid cells may also hampers proper interpretation of differentiation patterns. Noteworthy, by morphology, hypogranularity is estimated on peripheral blood smears rather than in the BM because it is most pronounced in mature neutrophils. This suggests that by FC, the SSC should be evaluated in the most mature myeloid cells in the BM. Yet, the contrary was anticipated by Ogata et al. who analyzed SSC of CD10neg neutrophils as part of a diagnostic flow cytometric score for MDS 4. This enabled correction for hemodilution; CD10 is expressed on the most mature neutrophils that are most prominent in peripheral blood. However, in a later study, this approach was abandoned 10. In our experience, overall, gating on CD10pos or CD10neg neutrophils to calculate the SSC did not yield significantly different results compared with gating on all the neutrophils within a sample.
PITFALLS IN THE ANALYSIS OF MYELOID AND B CELL PROGENITORS
There is a correlation between the blast count by morphology and the number of myeloid progenitors by FC but discrepancies are common. The flow cytometric definition of a ‘blast’ or preferably myeloid progenitor cell is not necessarily the same as the morphologic definition of a blast. The choice of antibody combinations to denote myeloid progenitors can influence the quantification of myeloid progenitors by FC. Myeloid progenitors can be differentiated from other subpopulations of cells in the BM by flow cytometric SSCintermediate, CD34pos, and CD45dim properties. However, in MDS, abnormalities in SSC properties and/or surface marker expression are frequently observed. The joint interpretation of CD11b, CD13, CD117, and/or HLA-DR in combination with CD34 and CD45 is recommended to avoid leaving out myeloid progenitors with abnormal antigen expression from analysis 16, 18. With six or more color FC it is possible to combine all of the aforementioned markers in one tube to analyze the myeloid progenitor cell compartment. Figure 4 shows the flow cytometric analysis of CD34pos myeloid progenitors with abnormal lack of CD45 on a subpopulation. In this case, quantifying myeloid progenitors by only SSCintermediate and CD45dim properties would give an underestimation of the percentage of myeloid progenitors. Furthermore, the absence of CD45 is an indication of the presence of aberrant myeloid progenitors. Caution is warranted; macro platelets can dimly express CD34, but can be differentiated from CD45neg myeloid progenitors by expression of CD36 and lack of other immature myeloid markers.

Presence of myeloid progenitors with lack of CD45 in a patient with MDS (A) Flow cytometric analysis of BM cells of a patient with MDS with myeloproliferative features. Myeloid progenitors are defined as SSCintermediate and CD45dim (black dots). The myeloid progenitors were backgated by CD34pos properties. Notably, the CD34pos myeloid progenitors are partially negative for CD45. (B) The CD45dim and CD45neg myeloid progenitors are both CD34pos. The CD45neg myeloid progenitors are depicted in gray. (C) The myeloid progenitor population consisting of CD45dim (black dots) and CD45neg (gray dots) myeloid progenitors are depicted.
Figure 5, illustrates that (back) gating with CD34 is insufficient to detect all the myeloid progenitors in the BM. In this patient, aberrant CD34neg myeloid progenitors are present that cannot be differentiated by CD34 and/or CD45 properties alone. Adding CD117 to the combination of antibodies is useful to include all the myeloid progenitors in the analysis.

Abnormal CD34neg myeloid progenitors in a patient with MDS. (A) Flow cytometric analysis of a BM sample of a patient with MDS refractory anemia with excess of blasts (5–10%). Myeloid progenitors are defined as SSCintermediate and CD45dim (black dots). (B) The myeloid progenitors were back gated in the SSC vs. CD45 plot by gating CD34pos cells. Notably, there is a large population of cells with SSCintermediate and CD45dim properties that are not CD34pos. (C) The use of CD117 aids in identifying the aberrantly CD34neg myeloid progenitors. The myeloid progenitors are CD117pos, SSCintermediate and CD45dim (black dots) but CD34neg as described above.
Furthermore, quantification of myeloid progenitors by FC is not the most important application of FC for MDS. Qualitative abnormalities such as aberrant, over or under, homogeneous or heterogeneous expression of a marker to assess abnormalities in hematopoiesis are the most relevant contributions for the diagnosis and prognosis of MDS. Figure 6 depicts the myeloid progenitor cell analysis of a patient with MDS and aberrant and homogeneous expression of CD117, compared with myeloid progenitors from BM of a healthy volunteer.
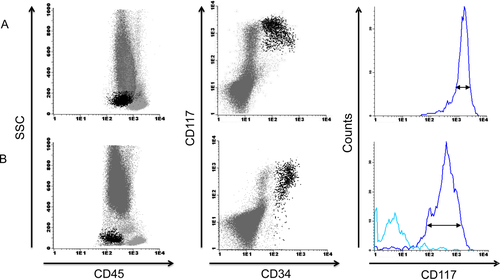
Aberrantly increased and homogeneous expression of CD117 expression on myeloid progenitors in a patient with MDS (A) Myeloid progenitors are defined as SSCintermediate, CD45dim, CD34pos, and CD117pos (black dots). The myeloid progenitors of this patient with MDS refractory anemia have abnormal homogeneous and increased expression of CD117. Of note, the myeloid cells lose CD34 expression and eventually also CD117 expression during differentiation. By using the histogram and coefficient of variation of CD117 expression on myeloid progenitors, the degree of heterogeneity or homogeneity is calculated. (B) Representative example of the analysis of myeloid progenitors in the BM of a healthy volunteer. A normal and heterogeneous (histogram) CD117 expression level is depicted. [Color figure can be viewed in the online issue, which is available at wileyonlinelibrary.com.]
Within the SSCintermediateCD45dim gate that myeloid progenitors reside in, other cells can be found which may be identified by additional markers. B cell progenitors, for example, can be relatively easily differentiated from myeloid progenitors by using CD19 and/or CD117. Yet, CD19 can be aberrantly expressed on myeloid progenitors. Therefore, adding CD117 is helpful in distinguishing aberrant myeloid progenitor cells from B cell progenitors. With six or more color FC, distinguishing cell populations of interest is less problematic compared with four color FC. Quantification of B cell progenitors is part of a flow cytometric diagnostic score for MDS 4. In contrast to healthy subjects and pathologic controls, patients with MDS have a deceased number of B cell progenitors in the BM.
Basophils have similar SSC and CD45 properties as myeloid progenitors and can interfere with evaluation of the number of myeloid progenitors. Contamination of the myeloid progenitor cell gate by basophils can be identified by slightly higher CD45 expression of basophils and by using CD123 and HLA-DR. Basophils are CD123 positive and HLA-DR negative. Myeloid progenitors can also express CD123, however, the expression levels are not as high as that of basophils, and moreover, (normal) myeloid progenitors express HLA-DR. The cases illustrated in Figures 5 and 6 show the importance of adding more markers such as CD117 and/or HLA-DR to the antibody combination because abnormalities can occur in the “backbone” markers CD34 and/or CD45.
The choice of fluorochromes might be the most important for detection of lineage infidelity markers on myeloid progenitors such as CD7 which is normally expressed by T cells. The rule of thumb is to select a fluorochrome taking into account the expected expression level of the antigen on the cell of interest. For expected low antigen expression levels, it is advised to use an antibody bound to a fluorochrome with strong emission qualities.
Antigen expression levels on cell populations of interest should be analyzed by using a reference population. This should be either cells stained with isotype controls which is ideal or, which is more feasible, unstained cells of the cell population of interest. Autofluorescence can vary between cell populations; therefore, it is discouraged to use for example unstained lymphocytes as a reference or control population for myeloid progenitors and the maturing myelomonocytic compartment.
Pitfalls in the Analysis of Maturing Myeloid Cells
Identification of subpopulations of myeloid cells that compose the maturation plots is important to differentiate normal from abnormal hematopoiesis 25. Maturation of myeloid cells can be followed by combining the markers CD11b, CD13, and CD16. Antigen expression levels of these (and other) markers fluctuate during differentiation and result in characteristic patterns of differentiation. Figure 7 shows the differentiation pattern of myeloid cells in the BM of a healthy volunteer. Fluorescence activated sorting (FACS) experiments show that subpopulations of myeloid cells defined by antigen expression levels of CD11b and CD13 correspond with morphological stages of differentiation (Fig. 7). Some important issues need to be addressed for the evaluation of abnormalities in myeloid maturation. Some pitfalls in the analysis of SSC were already mentioned above. For calculation of SSC, which corresponds with granularity of myeloid cells, it is of importance to exclude the eosinophils. Eosinophils are the most granular of neutrophils and might lead to the assumption of normal granularity of neutrophils if not excluded, especially in cases with increased numbers of eosinophils 26. Furthermore, it is of relevance to differentiate eosinophils and apoptotic neutrophils in the maturation patterns for the interpretation of myeloid cell differentiation as shown in Figure 8. This figure describes an experiment in which maturing neutrophils were FACS sorted, and later stained with May Grünwald Giemsa and Sudan-Black for confirmation that a subpopulation of these cells was apoptotic and from myeloid origin. CD10 expression on mature neutophils also decreases due to apoptosis. The presence of a paroxysmal nocturnal hemoglobulinuria (PNH) clone with abnormal loss of CD16 can be difficult to distinguish from neutrophils with abnormal loss of CD16 as part of dysplastic hematopoiesis in MDS. For confirmation of the presence of a PNH clone, analysis of peripheral blood is required as recommended by guidelines 15. If there are more indications of loss of glycosylphosphatidylinositol-linked proteins, for example loss of CD14 on a subpopulation of mature monocytes, additional flow cytometric tests should be performed to assess the presence of PNH.
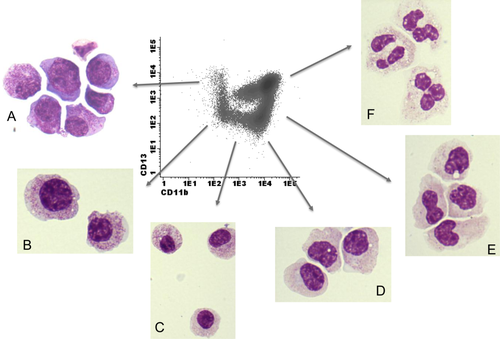
Fluorescence activated cell sorting (FACS) of subpopulations of differentiating myeloid cells in the BM of a healthy individual. Flow cytometric analysis based on antigen expression levels of differentiating myeloid cells in the BM corresponds with morphologic stages of maturing neutrophils. The maturing myeloid cells as analyzed by FC were initially gated by SSChigh and CD45dim properties. Myeloid cells differentiate from CD11bnegCD13pos cells towards CD11bposCD13pos. After sorting, all cells were stained with Giemsa for visualization. (A) CD11bnegCD13pos cells were sorted and correspond with myeloblasts and promyelocytes by morphology. (B) CD11bnegCD13neg myeloid cells correspond with promyelocytes and immature myelocytes by morphology. (C) CD11bdimCD13neg myeloid cells correspond with myelocytes by morphology. (D) CD11bposCD13neg cells correspond with myelocytes by morphology. (E) CD11bposCD13dim cells are consistent with myelocytic and metamyelocytic stage of neutrophil differentiation by morphology. (F) CD11bposCD13pos corresponds with the most mature stage of neutrophil differentiation by morphology. Sorting experiments showed segmented neutrophils. [Color figure can be viewed in the online issue, which is available at wileyonlinelibrary.com.]
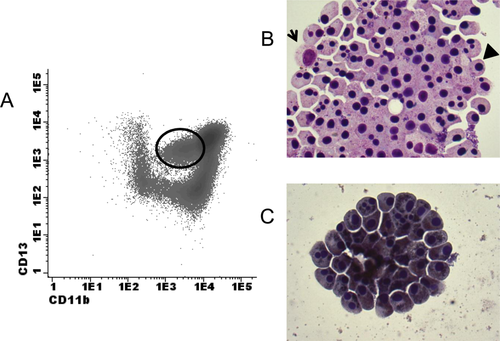
Fluorescence activated cell sorting (FACS) of an apoptotic subpopulation of myeloid cells in the BM of a healthy individual. (A)The maturing myeloid cells as analyzed by flow cytometry were initially gated by SSChigh and CD45dim properties. Myeloid cells differentiate from CD11bnegCD13pos cells toward CD11bposCD13pos. The circle in the plot indicates CD11bdimCD13pos myeloid cells that were sorted. (B) After sorting, cells were stained with Giemsa for visualization. Apart from an occasional viable myeloid cell (indicated by the arrow), the majority of cells are clustered apoptotic cells, with pyknotic nuclei (indicated by the arrowhead. (C) Sudan-Black staining of the subpopulation of interest after cell sorting. The cells are positive for Sudan-Black, indicating that the cells are of myeloid origin. Therefore, it was concluded that the CD11bdimCD13pos cells are apoptotic myeloid cells. [Color figure can be viewed in the online issue, which is available at wileyonlinelibrary.com.]
Pitfalls in the Analysis of Monocytes
Monocytes can be identified by CD33bright and HLA-DRpos expression and backgating by SSCintermediate and CD45bright properties. The more mature monocyte markers CD11b and CD14 can further help to identify mature monocytes. CD36 and CD64 can serve as complementary markers present throughout differentiation. By combining CD14 with CD33 and/or HLA-DR, monocytes can be differentiated from subpopulations of neutrophils with aberrant CD14 expression. Subpopulations of neutrophils can have (abnormal or reactive) HLA-DR expression, giving rise to possible overlap with monocytes. The addition of CD33 in combination with myelomonocytic markers can also aid in separating monocytes from (hypogranular) neutrophils. Of note, the level of CD33 expression is subject to polymorphisms. Therefore, abnormal expression of CD33 on monocytes, neutrophils and myeloid progenitor cells should be assessed in relation to each other.
In some BM samples, the number of monocytes as measured by FC may be underestimated. For instance, apoptosis of monocytes, defined as SSCintermediate, CD45bright, and CD14pos may be reflected by a change in FSC properties (Fig. 3). In cases with FSClow monocytes, caution is warranted when gating based on FSC and SSC plots. To avoid a misinterpretation of the number of mature monocytes in the BM, the FSClow monocytes should be included in the quantification. This can be achieved by adjustment of the debris gate to include these monocytes for analysis.
Yet, analysis of qualitative aberrancies in monocytes may be more important than quantification of this subset. Aberrant expression of CD56 is seen in MDS and described to be associated with chronic myelomonocytic leukemia 27. Activated (normal) monocytes may also express CD56. To ascertain that CD56 is aberrantly expressed, ≥20% of the cells should be one log above normal expression levels of CD56 on monocytes. This is half a log above the level of CD56 expression on activated normal monocytes.
Furthermore, aberrant expression of lymphocytic markers such as CD5 or CD7 can be differentiated from monocytes adhering to T cells or contamination in the gate with T cells by checking whether all T cell markers are expressed or only single. In the case of aberrant expression, only single T cell markers are present. Of note, this is also the case for the analysis of aberrant marker expression on myeloid progenitor cells.
CONCLUSION
Although there are a considerable number of technical pitfalls for FC in MDS, the majority of problems can be tackled by getting acquainted with normal hematopoiesis and the study of (pathologic non-) MDS hematopoiesis. Moreover, standardization of in-house procedures is of utmost importance to evaluate results reliably. Before any conclusions are made on a flow cytometric analysis of a BM aspirate of a patient with the suspicion of MDS, a critical review of the findings is obligatory. Furthermore, FC should not be interpreted as a single technique, but together with BM morphology, cytogenetics, and molecular abnormalities 20. New developments in flow cytometric software with extensive statistical analysis programs may help to objectify flow cytometric results and quantify the distance from normal. Moreover, the lack of markers to follow megakaryocytic differentiation together with the technical limitations to visualize megakaryocytes by FC has prevented its application for MDS. The most recent study investigates abnormalities in surface expression markers of platelets in peripheral blood of patients with MDS 28. Studies are ongoing to determine the true value of analyzing platelet abnormalities by FC for MDS.
In conclusion, FC is a valuable technique that is becoming part of the daily work up of patients with (suspected) MDS, besides morphology, cytogenetics, and molecular biology 15. However, technical issues as described in this article and in the work published by IMDS-Flow should be taken into consideration when implementing FC for MDS.


