Single Cell Phenotypic Profiling of 27 DLBCL Cases Reveals Marked Intertumoral and Intratumoral Heterogeneity
Abstract
Diffuse large B-cell lymphoma (DLBCL) is the most common histologic subtype of non-Hodgkin lymphoma and is notorious for its clinical heterogeneity. Patient outcomes can be predicted by cell-of-origin (COO) classification, demonstrating that the underlying transcriptional signature of malignant B-cells informs biological behavior in the context of standard combination chemotherapy regimens. In the current study, we used mass cytometry (CyTOF) to examine tumor phenotypes at the protein level with single cell resolution in a collection of 27 diagnostic DLBCL biopsy specimens from treatment naïve patients. We found that malignant B-cells from each patient occupied unique regions in 37-dimensional phenotypic space with no apparent clustering of samples into discrete subtypes. Interestingly, variable MHC class II expression was found to be the greatest contributor to phenotypic diversity. Within individual tumors, a subset of cases showed multiple phenotypic subpopulations, and in one case, we were able to demonstrate direct correspondence between protein-level phenotypic subsets and DNA mutation-defined subclones. In summary, CyTOF analysis can resolve both intertumoral and intratumoral heterogeneity among primary samples and reveals that each case of DLBCL is unique and may be comprised of multiple, genetically distinct subclones. © 2019 International Society for Advancement of Cytometry
Diffuse large B-cell lymphoma (DLBCL) accounts for ~30% of non-Hodgkin lymphomas and has a 5-year overall survival rate of 60–70% 1. DLBCL is clinically heterogeneous and has motivated attempts to subclassify the disease. Transcriptional profiling has successfully segregated the disease into germinal center B-cell-like (GCB), activated B-cell-like (ABC), and unclassifiable subtypes, which have disparate clinical outcomes under standard combination chemotherapy regimens 2, 3. Multiple groups have attempted to translate COO-based mRNA signatures into lower dimensional immunohistochemistry (IHC)-compatible protein expression algorithms 4-6, but these have met with variable success 7, 8, thus motivating a return to mRNA-based signatures, but that are compatible with archival, paraffin-embedded tissue 9. More recently, alternative classification schemes have emerged that additionally incorporate DNA mutational patterns, which in some studies has been shown to provide greater prognostic information than mRNA expression signatures alone 10, 11. As well, whole exome sequencing has been used as a measure of intratumoral heterogeneity in DLBCL, with greater heterogeneity being linked with worse outcome 12. Each of these prior approaches have relied upon characterization of tumor cells in bulk and is thus unable to resolve potential phenotypic variation among individual cells within tumors. We sought in the current study to explore the utility of single cell phenotyping by mass cytometry (CyTOF) to assess the extent of intertumoral and intratumoral heterogeneity in DLBCL that could be resolved at the protein level.
Methods
Patient Samples
Diagnostic, pretreatment lymph node biopsies from 27 patients with DLBCL and 11 reactive lymph nodes (rLN) were obtained from the lymphoma tumor bank at BC Cancer Agency. All samples were obtained with informed consent and according to protocols approved by the BCCA Research Ethics Board. Cases were selected based on the availability of sufficient numbers of viable cells for CyTOF analysis.
Sample Batching
For 25 of 27 DLBCL samples, each DLBCL sample was mixed with an aliquot of pooled rLN cells to serve as an internal staining control and source of normal cells for comparison. DLBCL and rLN cells were discriminated by staining with different anti-CD45 conjugates prior to mixing 13. These samples were acquired over 25 different CyTOF acquisition runs (i.e., one DLBCL plus rLN control per run). Two (2) additional DLBCLs were acquired in separate CyTOF acquisition runs without the spiked-in rLN control (i.e. one DLBCL without rLN control per run).
Antibody Staining/Mass Cytometry
Banked cells were thawed at 37°C, washed in complete media (RPMI-1640 + 10% FCS), mixed with control cells as described above, incubated with 25uM cisplatin in serum-free media to discriminate dead cells, and then stained with two panels of metal-conjugated antibodies against surface or surface + intracellular antigens (Supporting Information Table S1). All antibodies were used at a final dilution of 1:100. Surface staining was carried out in PBS + 2% FCS, and intracellular staining was carried out using the eBioscience FoxP3 staining kit as per the manufacturer's instructions. Cells were then fixed, stained with Cell-ID Intercalator-Ir dye (Fluidigm), and prepared for CyTOF acquisition according to the manufacturer's protocols. Cells were acquired on a CyTOF2 instrument (Fluidigm). Across 13 antigens present in both surface and surface + intracellular panels, samples displayed similar staining patterns with an average Pearson correlation of 0.73 across the two panels (Supporting Information Fig. S1).
Data Preprocessing
Viable, non-T-cells were pregated using FlowJo based on negative staining for cisplatin and CD3, and all analysis thereafter was performed in R using 2,500 viable non-T cells per DLBCL or rLN sample (Supporting Information Fig. S2). Data were normalized against internal rLN staining controls to account for batch effects/machine drift. Normalization involved division by the mean signal per channel from the internal staining control for each sample run. Normalized expression values were then transformed using a hyperbolic arcsine function (arcsinh, cofactors a = 0, b = 0.2 as per standards laid out in ref. 14). Kappa and lambda light chains were anonymized, but intensity preserved within a single meta-parameter designated “Ig light chain”. This approach retains information content of Ig light chain expression intensity but precludes samples from separating according to kappa versus lambda light chain isotype.
Entropy Analysis: In order to assess if a population of cells was shared across multiple different samples or unique to a single sample, we calculated the Shannon entropy for each cell based on its nearest neighboring cells in high-dimensional phenotypic space. For the purposes of this calculation, we assigned each CyTOF acquisition run a separate “identity,” such that there were 25 different identities from which to choose neighbors, and each cell chose 25 nearest neighbors for entropy calculation in order to maximize the achievable entropy by each cell. An entropy score of 0 (log21) thus corresponds to a cell whose 25 nearest neighbors all originate from 1 acquisition run, while the maximum entropy score of 4.64 (log225) corresponds to a cell whose 25 nearest neighbors all originate from 25 different acquisition runs. As well, for each acquisition run, we randomly downsampled the data to 5,000 cells including 2,500 from the DLBCL sample and 2,500 from the spiked-in rLN control (total numbers of gated, viable non-T cells acquired by CyTOF are provided in Supporting Information Table S2.). Thus, for all depicted plots, entropy was calculated using a total of 125,000 cells, representing 2,500 cells from each of 25 DLBCL samples and 62,500 cells from the pooled rLN control (collected as 2,500 cells across 25 acquisition runs).
Clustering Analysis
We employed the Phenograph clustering algorithm 15 for unsupervised clustering to define groups of cells with similar phenotypes using default parameters (30 nearest neighbors for graph building step). t-SNE dimensional reduction 16 was used to visualize cell positions in two-dimensional plots from the original 37-dimensional data using the Barnes-Hut implementation and default parameters (perplexity = 30, theta = 0.5). HDBSCAN 14 was used on t-SNE dimensionally reduced data in order to identify subpopulations within individual DLBCL samples using a minimum cluster size threshold of 50 cells.
Principal Component Analysis: We performed sample-level principal component analyses (PCA) by collapsing abnormal B cells from each sample down to a single data point based on median expression values for each marker. Abnormal B cells for each sample were defined as those cells not residing within Phenograph clusters commonly cooccupied by cells from rLN samples. For the 2 of 27 DLBCL samples, which were not accompanied by an rLN spike-in control, tumor cells were identified by conventional sequential bivariate gating strategies as performed by an expert hematopathologist to isolate B cells exhibiting monotypic or otherwise abnormal surface Igκ/Igλ light chain expression.
Next Generation Sequencing
Genomic DNA was extracted from whole tumor samples and subjected to either targeted capture sequencing (SureSelectXT Custom 1 kb up to 499 kb, Agilent) or whole exome sequencing (SureSelectXT Human All Exon v5, Agilent). Paired-end alignments were performed using the bwa-mem aligner version 0.7.5a 17 against the human genome (hg19). Resulting primary BAM files were treated with Picard version 1.126 (Broad Institute, Cambridge, MA; https://broadinstitute.github.io/picard) to remove duplicates. Variants were identified using (1) VarScan version 2.3.6 18—a heuristic and statistical algorithm that detects somatic sequence variants at very high sensitivities; (2) Strelka version 1.0.13 19—an accurate small variant caller optimized for analysis of germline variation in small cohorts and somatic variation in tumor/normal sample pairs; and (3) MuTect (version 1.1.4) 20—a Bayesian classifier to detect somatic mutations with very low allele fractions. Database annotation was performed using SnpEff version 4.2 21 and further filtered and annotated against dbSNP version 137 22. The following criteria were defined for the inclusion of variants: GMAF <0.01, minimum of 10 variant reads and predicted to have a protein-altering effect. Candidate genes were selected based on variant allele frequencies (VAFs) of at least 5% and validated by sequencing of amplicons after PCR amplification of the target locus.
Results
Interrun Data Normalization Using Spiked-In Control Cells from Reactive Lymph Nodes
In order to assess how effectively the interrun normalization approach had performed, we plotted the spiked-in rLN control cells in t-SNE space for each of the 25 CyTOF acquisition runs, both before and after the data normalization procedure (Supporting Information Fig. S3A). In the prenormalized data, we noted a sizable shift in the phenotypic pattern that occurred between runs #5 and #6, which we determined was likely due to a change in antibody reagent lots but thereafter was controlled for more rigorously. There were more minor, progressive shifts that did persist, which we attributed primarily to machine drift. Nonetheless, the data normalization procedure substantially corrected for these interrun variables, yielding near identical patterns in t-SNE plots across all 25 runs. To quantify the effectiveness of interrun normalization, we calculated Shannon entropy values for each cell in the analysis and plotted their distribution, which revealed a substantial increase in entropy values after signal normalization (Supporting Information Fig. S3B). We also plotted individual cell entropy values for the rLN control across the 25 acquisition runs, which revealed a very consistent and narrow distribution with most values in the 3–4 range, indicating that 8–16 of 25 closest neighboring cells were derived from different acquisition runs (Supporting Information Fig. S4A), and thus a very high degree of interrun data homogenization was achieved.
We also took the opportunity to examine entropy values for cells from each of the 25 DLBCL samples and noted that while most samples contained a prominent population cells with entropy values <0.5 (log21.4), a subset also contained appreciable numbers of cells with higher entropy values in the range of 1.5–3.5 (log22.8-log211.3) (Supporting Information Fig. S4B). We considered that these higher entropy cells could represent malignant B cells from different patients that exhibited very similar phenotypes, or alternatively, that they were residual, normal B cells present to varying extents in the biopsy samples and which exhibited elevated entropy values due in part to their phenotypic similarity to cells in the rLN controls. We thus felt it would be important for subsequent analyses to be able to identify and segregate residual normal B cells away from malignant DLBCL cells within each sample, preferably using an unsupervised computational approach.
Unsupervised Clustering to Define Normal from Abnormal B-Cells
Plotting of cells from the 25 DLBCL samples and rLN controls together in t-SNE space illustrates phenotypic regions where patient and reference normal B cells overlap (Fig. 1A). In order to identify normal from malignant B cells within the patient DLBCL samples, we first applied a widely adopted clustering algorithm, Phenograph, which identifies groups of cells with similar phenotypes from highly dimensional data and is based upon the Louvain community detection method to maximize modularity, or the density of edges within, as compared to between, communities 15, 23. Phenograph identified 44 distinct population clusters among cells from the 25 CyTOF acquisition runs, each including one DLBCL sample and the spiked-in rLN control (Fig. 1B). Phenograph clusters could be readily separated into those with high versus little to no rLN representation, and we used this distinction to deem the clusters as either “normal” or “abnormal,” respectively (Fig. 1C). Of note, the deemed normal cells from DLBCL samples localized to similar regions in t-SNE space as the rLN control cells (Fig. 1D; compare with Fig 1A). Similar results were obtained whether using the surface (Fig. 1C) or surface + intracellular (Supporting Information Fig. S5) panel data.
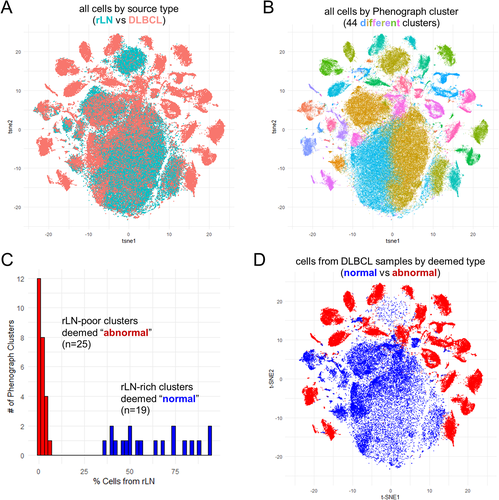
Plotting of individual cell entropy values for each of the 44 Phenograph clusters revealed normal clusters to show median entropy values in the 2–4 range, and the majority of abnormal clusters with median entropy values <0.5 (Supporting Information Fig. S6A). Three of the abnormal Phenograph clusters exhibited intermediate median entropy values in the 1–2 range; however, two of these, clusters #28 and #27, lacked expression of CD19/CD20/CD22 and thus likely represents non-B cells (recall that data preprocessing only excluded CD3+ T-cells from further analysis) (Supporting Information Fig. S6B). Cells in cluster #28 instead expressed low/intermediate levels of HLA-DR, CD80, and CD86, as well as moderate levels of CD194 (CCR4) and CD83 (Supporting Information Fig. S6B), suggesting they may represent a subset of macrophages or dendritic cells that are more highly represented in DLBCL than rLN samples. Clusters #24 and #27, contained very few cells (Supporting Information Fig. S6C) and did not form discrete groupings in t-SNE plots, thus were difficult to interpret further.
To corroborate the assignment of Phenograph clusters into “normal” versus “abnormal” categories, we examined the kappa/lambda light chain expression pattern for all 44 clusters. We found nearly all 19 normal clusters to exhibit a polytypic pattern of Ig kappa/lambda light chain expression, while all 25 abnormal clusters exhibited a monotypic or aberrant surface Ig-null pattern (Supporting Information Fig. S7). The few normal clusters that failed to demonstrate a clear polytypic pattern included cluster #2, which was negative for CD19/CD20/CD22 and thus likely represented non-B cells, and clusters #42 and #30 for which a subset of cells showed high and low levels of nonspecific staining along the diagonal, respectively. Thus, we found Phenograph clustering to perform well as an unsupervised computational means for discriminating tumor cells from residual normal B cells. We are currently exploring whether a similar approach might prove useful as an adjunct clinical diagnostic tool.
Visualization of Intertumoral Heterogeneity
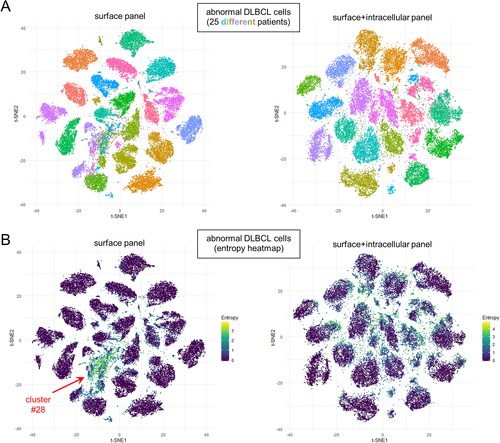
To gain perspective as to the spectrum of phenotypic variation in our DLBCL cohort, we plotted the deemed abnormal cells from each of 25 DLBCL samples in t-SNE space (Fig. 2A). In data from both surface and surface + intracellular marker panels, cells from each patient's tumor appeared to localize to distinct, nonoverlapping regions, which was emphasized by low entropy values for cells within each of the tumor “islands” (Fig. 2B). Of note, we did identify a few groupings of cells with higher entropy values; however, these coincided with non-B cells (i.e., Phenograph cluster #28 indicated by arrows in Fig. 2B). Thus, examining global phenotypic variation in this manner supports the notion that each patient's tumor exhibits a unique phenotype. We suspect this extent of intertumoral diversity is related to the advanced stage of tumor evolution in DLBCL, since we in fact do see regions of phenotypic overlap in lower grade B cell lymphomas (manuscript in preparation).
Comparison of DLBCL Clustering in CyTOF Space with Cell-of-Origin Designation
We had anticipated we might be able to discern molecular subtypes of DLBCL (i.e. ABC vs. GCB cell-of-origin) as areas of local density among tumor samples in multidimensional space. To test this idea, we plotted each patient's abnormal DLBCL cells as a single point in PCA space (using the median expression value for each component antibody marker) and annotated each of the samples with their respective COO assignments. Unexpectedly, we were unable to discern apparent segregation of COO subtypes using the full 37-dimensions of either the surface or surface + intracellular panel, whether COO assignments were defined by Lymph2Cx/Nanostring transcriptional profiling 24 (Fig. 3A), or Hans 4 or Choi 5 immunohistochemisty algorithms performed on corresponding FFPE tissue sections (Supporting Information Fig. S8). Given that the surface + intracellular panel included 6 of 7 markers utilized by various IHC/protein-based classification algorithms (FOXP1, IRF4/MUM1, BCL2, BCL6, CD10, and LMO2; lacking only GCET1), we reran the analysis, but now limited to 6-dimensional space with just these markers (Fig. 3B, Supporting Information Fig S9). We again were unable to discern segregation of samples by COO assignment. Since the Hans algorithm (using CD10, BCL6 and IRF4/MUM1) was completely encapsulated within the surface + intracellular panel (unlike Choi and Tally algorithms that include GCET1), we reran the analysis limited to 3-dimensional space with these markers, and now finally found we could discern a reasonable degree of spatial segregation between GCB and non-GCB types (Fig. 3C).
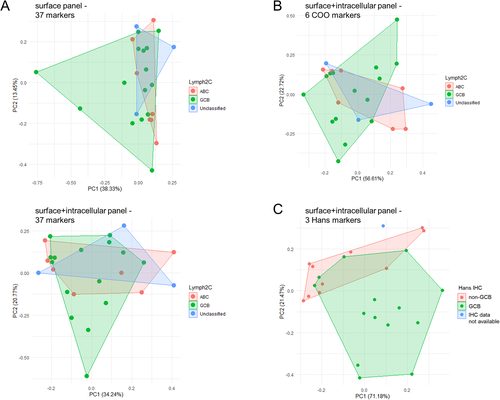
To understand why COO was so inapparent using the full complement of 37 markers, we rank ordered the marker lists by contribution to the first two principal components (PC1 and PC2) in PCA space (Supporting Information Tables S3 and S4). Interestingly, the 6 COO markers ranked at positions #7 (FOXP1), #8 (IRF4/MUM1), #9 (BCL2), #12 (BCL6), #25 (CD10), and #30 (LMO2) in the surface + intracellular panel (Supporting Information Table S4), highlighting that other markers in the panel contributed a greater proportion of the phenotypic heterogeneity within our cohort of 25 cases. Notably, top ranking markers included immune interacting elements (HLA-DR, PDL1), BCR/co-receptor components (Ig light chain, CD79B, CD21, CD22), and an epigenetic modifier (EZH2). These observations suggest that while the mRNA-based COO signature can be discerned in our protein-based CyTOF data set, we found unexpectedly that other elements contributed to overall phenotypic diversity to a greater extent. Intriguingly, those stronger contributing elements highlighted immune interactions and BCR signaling, supporting a potentially important role for the tumor microenvironment in shaping, or perhaps even driving phenotypic diversification in DLBCL.
Using Phenotypic Subpopulations to Define Genetically Distinct Subclones
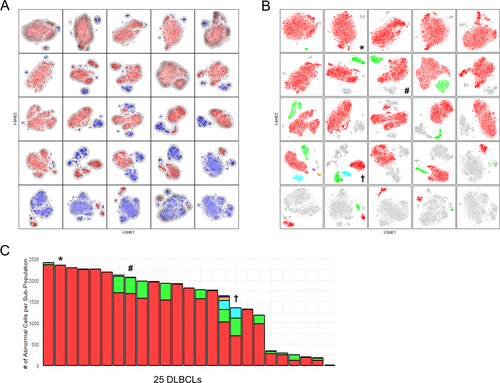
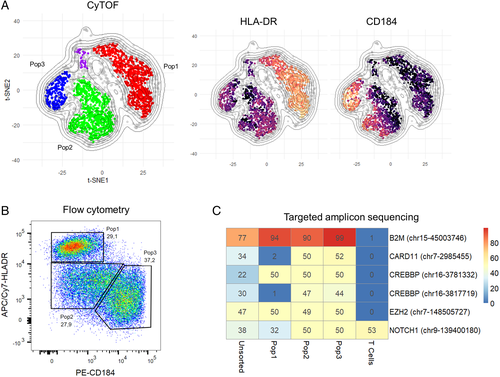
In order to address whether intratumoral subclones could be discerned in CyTOF data, we used t-SNE on each individual case to identify subpopulations of tumor cells within each samples, followed by clustering with HDBSCAN 21 to quantify the subpopulations (Fig. 4). We observed a striking degree of apparent subclonal diversity including cases with single, homogeneous tumor cell populations, single tumor cell populations with variable densities suggestive of incompletely resolved substructure, and multiple, distinct tumor cell subpopulations suggestive of evolved subclones. Focusing on the latter two types, we sought to determine if these phenotypic subpopulations might correspond to DNA mutational subclones. We thus devised conventional sorting strategies from dimensionally reduced CyTOF data and applied these to a subset of cases for which additional parallel vials of frozen cells were available. We referenced whole exome or targeted capture DNA sequencing data from unfractionated tumor samples to define subclonal marker mutations exhibiting VAFs of at least 5% and designed primers for targeted amplicon sequencing of up to 48 candidate marker loci.
From attempts with 8 sorted tumor subpopulations from 3 DLBCL cases, we were able in a single case to demonstrate direct correspondence between phenotypic subpopulations and genotypic subclones. As shown in Figure 5, we found acquired mutations in CARD11 and CREBBP_3817719 that were present in 2/3 sorted tumor cell subsets (Pop2 and Pop3), but absent from the 3rd (Pop1). We did identify acquired mutations at 3 other loci (B2M, CREBBP_3781332, and EZH2) common to all 3 sorted tumor cell subsets but absent from T-cells sorted from the same sample, consistent with the idea that the CARD11/CREBBP_3817719 mutated and non-mutated subclones had evolved from a common B2M/CREBBP_3781332/EZH2 mutated ancestor. Of note, the phenotyping data reveal that the CARD11/CREBBP_3817719 mutated clone (Pop2/3) is distinguished by loss of HLA-DR, a recurrent event in tumor evolution under selective pressure from the host immune system 25, 26 and that we recently showed can be reversed by EZH2 inhibition 27. Data from two similar, but ultimately unsuccessful attempts to show correlation between phenotypic subpopulations and genotypic subclones, are presented in Supporting Information Figures S11-S12.
Discussion
We have demonstrated here that protein expression profiling by CyTOF can reveal striking intertumoral and intratumoral heterogeneity at single cell resolution, which is currently prohibitively expensive using single cell sequencing approaches in a study of this scale. Furthermore, paired single cell protein-transcriptome studies have demonstrated that protein and mRNA levels correlate in many, but not all instances 17, 28, and thus high-parameter measurement of protein expression levels provides a critical layer of functional information not captured by transcriptomic approaches. The current study demonstrates the success of high dimensional single cell protein analysis in segregating normal from malignant B cells in an unsupervised manner, and in revealing elements of phenotypic diversity that are not prominently displayed by transcriptomic approaches. Finally, the current approach revealed phenotypically divergent subpopulations of tumor cells within individual samples, which in one case could be demonstrated to correlate directly with genetic subclones carrying biologically meaningful mutations.
Specifically, we identified subpopulations of cells with reduced MHC-II expression and corresponding mutations in CREBBP and CARD11, both of which are associated with MHC-II loss/reduced antigen presentation in lymphoma (Fig. 5) 29, 30. Interestingly, one of the three subpopulations retained MHC-II expression despite all three harboring the same EZH2 mutation. Given our recent report highlighting an association between EZH2 mutation and MHC-II loss 27, we might speculate that the ancestral clone lacking EZH2 mutation may have expressed MHC-II at an even higher level. Together, these observations illustrate the utility of combined phenotypic and genetic analyses in dissecting the dynamics of subclonal evolution and tumor escape mechanisms.
While the clonal B cell populations within each of the DLBCL tumors was phenotypically distinct from one another, there was one population of cells (cluster #28) that was shared among multiple DLBCL samples. The phenotype of these cells, however, suggested that they do not represent B cells, but may instead represent macrophages or dendritic cells based on intermediate expression of HLA-DR, CD80, and CD86. These cells also expressed CD83, a marker of activated dendritic cells 31, and CD194 (CCR4), suggesting that they may have migrated into DLBCL-involved lymph nodes from peripheral blood or lymph via interaction with CCL17/22 ligands 32. The role of these cells in regulating immunity is an interesting avenue for further study, as CD83+ myeloid cells have been shown to both suppress 33 and stimulate 34 T cell responses in different contexts.
A notable finding of this study was that COO assignment was not a dominant feature in the data, with factors such as immune interaction, BCR signaling, and epigenetic modification contributing more strongly to intersample variability than COO-related markers. COO signatures were still embedded within the data but could only be revealed by a strongly supervised approach. The impact of these alternate markers of intertumoral diversity on clinical outcomes will require larger studies; however, recent work from group has shown that MHC-II loss can identify a subset of patients whose tumors are sensitive to EZH2 inhibition 27.
We also attempted to correlate tumor expression profiles with available clinical data for this cohort of patient samples. We did not discover any significant associations with age, sex, international prognostic index (IPI) score, stage at diagnosis, or tumor mass, presumably due to the relatively small size of the cohort. Multivariate Cox regression also failed to identify any significant correlation between tumor expression profile and either overall survival or progression-free survival. Given the improved resolution afforded by higher dimensional phenotyping, larger studies may yet reveal novel and interesting clinical insights.
Other potential drivers of inter- and intra-patient heterogeneity that were not assessed in the current study include the response of tumor cells to extrinsic factors (e.g. signaling activation from soluble cytokines or stromal ligands) and the supportive or suppressive effect of local interactions with immune cells. Measurement of intracellular signaling is readily assessed by intracellular phospho-flow/CyTOF and represents a powerful means of interrogating functional states. The contribution of immune cell interactions can also be measured, albeit indirectly, by examining the overall composition of the immune infiltrate within tumor samples by CyTOF using dedicated T/myeloid marker panels, which are currently ongoing in our group. Documenting direct cell–cell interactions, however, would require incorporation of additional modalities that capture spatial information such as multidimensional immunohistochemistry or imaging mass cytometry (IMC) performed on intact tissue sections 35. Taken together, these single cell protein-based approaches provide an important element of functional information that can be attained at a cost-level suitable for large collections of patient samples.
Acknowledgments
This work was supported by a Quest for Cures grant from the Leukemia and Lymphoma Society, a Program Project Grant from the Terry Fox Research Institute, Genome Canada, and the BC Cancer Foundation. MK received postdoctoral support from Japan Society for the Promotion of Science.
Author Contributions
MK, XW, CS, and APW designed experiments. MK, XW, GS, DG, KT, EAC, DE, TA, and CSa generated data. MDN, MK, XW, AH, JM, and SH interpreted results. JMC, PF, GWS, and RDG contributed pathology and case selection. RRB, DWS, and CSt provided advice and discussion. MDN, SH, and APW wrote the manuscript.
Conflict of Interest
The authors declare no competing interests.


