An R-Derived FlowSOM Process to Analyze Unsupervised Clustering of Normal and Malignant Human Bone Marrow Classical Flow Cytometry Data
Abstract
Multiparameter flow cytometry (MFC) is a powerful and versatile tool to accurately analyze cell subsets, notably to explore normal and pathological hematopoiesis. Yet, mostly supervised subjective strategies are used to identify cell subsets in this complex tissue. In the past few years, the implementation of mass cytometry and the big data generated have led to a blossoming of new software solutions. Their application to classical MFC in hematology is however still seldom reported. Here, we show how one of these new tools, the FlowSOM R solution, can be applied, together with the Kaluza® software, to a new delineation of hematopoietic subsets in normal human bone marrow (BM). We thus combined the unsupervised discrimination of cell subsets provided by FlowSOM and their expert-driven node-by-node assignment to known or new hematopoietic subsets. We also show how this new tool could modify the MFC exploration of hematological malignancies both at diagnosis (Dg) and follow-up (FU). This can be achieved by direct comparison of merged listmodes of reference normal BM, Dg, and FU samples of a representative acute myeloblastic case tested with the same immunophenotyping panel. This provides an immediate unsupervised evaluation of minimal residual disease. © 2019 International Society for Advancement of Cytometry
The exploration of human bone marrow (BM) is important to understand and diagnose diseases involving altered hematopoiesis. Although morphological identification of cells' distinctive features remains the basis of these analyses, more sophisticated methods appeared to be necessary over time, among which multiparameter flow cytometry (MFC) has gained an undisputed place. The development of monoclonal antibodies, identifying hundreds of leukocyte differentiation antigens 1, has been a major step, which progressively led to the definition of sets of markers of interest for the various lineages of normal hematopoiesis. Panels specifically addressing suspected diseases have been consensually designed and are routinely applied 2-5. The increasing sophistication of flow cytometers has not only led to the generation of more and more stable and reproducible data but also to a dramatic increase of available analysis parameters. Concomitantly, it appeared that classical representations of the data had reached their limits and powerful software allowing for refined multiparametric analyses became an obvious need. Of note, the capacities of principal component analysis (PCA; 6, 7), appearing initially quite performing, soon proved insufficient to perform complex separation of subsets.
A massive leap was achieved when even greater data analysis capacities became mandatory to interpret the large amount of information generated by mass cytometry (MC; 8, 9). Mathematical tools formerly devised to establish the distance (short or long) between clusters of items were thus developed to dissect cellular subpopulations. A number of review papers have described the different approaches proposed, applied to normal and pathological samples 10-12. In a comprehensive review, Weber and Robinson 12 depict and compare several published solutions of clustering methods 13-18 and individualize FlowSOM as the best performing solution. The latter was developed by van Gassen et al. 18, as an algorithm of unsupervised analysis dubbed “Flow Self Organizing Maps” or “FlowSOM.” These authors showed that it could be applied both to MC and classical MFC 18, 19.
Here, we explored how the recognized superiority of FlowSOM 18 could be translated to a new paradigm of unsupervised analysis of classical MFC data acquired in the reproducible way demonstrated by the Harmonemia project 20. In order to obtain a new, redefined delineation of hematopoiesis, we generated FlowSOM reference minimal spanning trees (MST) from merged normal BM (MNBM) samples analyzed with four different monoclonal antibody panels adapted, respectively, to the diagnosis (Dg) of acute myeloblastic (AML) or lymphoblastic (ALL) leukemia. In a second step, we extended the concept to the concomitant FlowSOM analysis of MNBM together with Dg and follow-up (FU) BM patient samples stained with the same antibody panels.
Although examples of the application of FlowSOM to classical MFC can be found in the literature 21, 22, this approach stands out as a completely novel way of unsupervised analysis of hematological MFC data. It can be usefully completed by a node-by-node exploration of the MST generated by FlowSOM through expert-driven (i.e., supervised) examination. Here, this was achieved using the Kaluza® software, a solution proposed by Beckman Coulter® as an off-instrument powerful and versatile MFC reanalysis tool of any .fcs file. It allows to design and store complex gating algorithms and concomitantly display of a variety of histograms as well as descriptive and statistical information. These “protocols” can then be readily applied, in a few seconds, to .fcs files acquired in the same fluorochrome combinations. It is a valuable tool for both research and routine MFC.
Material and Methods
Samples
Normal fresh BM was obtained during heart or hip surgery from patients without hematological disease and presurgery normal whole blood cell counts, according to the approval provided by Bordeaux University Hospital Ethical Committee. They were immediately processed according to Harmonemia 20 specifications with the AML (n = 19) and ALL (n = 17) GEIL A and B panels 5 (Supporting Information Table S1). Briefly, a lysis-no-wash technique was applied, BM samples being analyzed after incubation in the dark and then submitted to red blood cell lysis with 2 ml Versalyse® (Beckman Coulter, Miami, FL). All samples were acquired with a Navios (Beckman Coulter) instrument. Compensations were performed as described in the Harmonemia initiative 20 using Versacomp® beads and the Kaluza wizard (Supplemental table 1).
Software
All analyses, as described in the Supporting Information, first used the packages of FlowSOM, freely available on Bioconductor (FlowSOM and FlowCore) and working with the R statistical programming language 23, 24. Some additional scripts were devised to adapt the data to Kaluza analysis and can be provided on demand by the authors. All .fcs listmodes generated by these scripts are readable with all commercial software for Flow Cytometry (FlowJo, FCS Express, R, etc.) as well as with the enhanced Kaluza protocols available as Supporting Information.
Normalization of BM Listmodes and Choice of FlowSOM Files
For each of the four panels (AML and ALL), MNBM reference listmode files were generated as follows.
As a first step, all normal BM listmode files of a given panel were individually checked, adjusted for compensation if needed, and then saved as .csv files. About 70,000 random events from each BM listmode file were then selected to reduce the size of the final MNBM to approximately 106 cells, and each file was saved as analysis.
In order to obtain the best FLowSOM MST graph on MNBM reference files, the original R-package was modified prior to merging normal samples. Briefly, each fluorescence parameter was normalized based on the median of its best negative population (e.g., CD7-negative B-lymphocytes for AML tube A). This process was achieved via a specific script showing a monoparametric histogram of each fluorescence and providing a cursor that could be adjusted to the peak value of the negative control. Because of the use of Harmonemia principles, this normalization was minimal but had to be checked as a pre-analytical mandatory process to ensure the quality of MST graphs.
All normalized BM listmode .fcs files could then be merged to build the MNBM .fcs reference file. The latter was submitted to FlowFrame with the R flowCore package and then to FlowSOM package processing. Settings (set.seed) were adjusted in order to obtain 24 different FlowSOM random representations for each MNBM panel, each “frozen” for possible future use. This means that the software was modified in a way allowing to retain the characteristics of each unsupervised generated MST.
Data Analysis of Normal BM
All MNBM proposals were then revised using a tracking protocol devised especially on Kaluza for this purpose (Supporting Information). A specific Kaluza tracking sheet was developed to first roughly check the characteristics of MNBM and assess major subsets using the GTLLF color-coded strategy 25 by delineating the major subsets visible on a CD45/SSC scattergram. This highlighted FlowSOM nodes with lineage-specific colors. Node-by-node analysis was then performed with the concomitant use of a statistics sheet displaying all normalized geometric mean fluorescence intensities (MFIs) of each marker (see paragraph below), cell numbers and percentages, as well as backgating on a CD45/SSC scattergram (Supporting Information). When needed, specific biparametric histograms of markers of interest were built on selected nodes. A set of specific colors was attributed to the population identified in each node. The few nodes identified as nonspecific debris were left in gray.
This strategy resulted in a new definition and partition of major hematopoietic subsets, as described in the Results section. Four new maps of MNBM were thus obtained, one for each of the four 10 color panels used.
MFI Calculation for Each Node
One of the crucial points was to obtain an easy-to-read display of any node's immunophenotype. A new automated calculation was thus devised in Kaluza to compare the expression of each marker of the panels used (Supporting Information). The MFI of each antibody was first divided by that of the relevant population unstained by this marker (i.e., autofluorescence) and the result called MFI ratio (MFIr). Moreover, for each antibody, the highest MFIr (on an x-axis) obtained in the MNBM was attributed an arbitrary value of 10 (on a y-axis). All subsequent normalized MFIr values were calculated using a linear regression equation between MFIr and nMFIr. The resulting combined calculations of nMFIr were then applied automatically and displayed on statistics tables. Thus, for each node selected by any tracking gate, the corrected MFI of all markers could be instantly directly displayed.
Concomitant Analysis of FlowSOM MST from MNBM, Leukemic, and FU Samples
Individual Dg and FU listmodes from a given patient were checked for compensations, saved as .csv files, normalized as described above, and then processed/computed together with the MNBM using FlowSOM tools (“FlowSOM::NewData()” and “FROZEN FlowSOM Result” scripts). This operation provides an MST graph representation of the three individual listmodes, respectively, MNBM, Dg, and FU, within the MNBM graphic FROZEN layout (Supporting Information).
As quality control, mode, median, and geometric mean fluorescence values, for each marker used as “negative control” for normalization, were compared by means of monoparametric histograms between MNBM, Dg, and FU samples.
Finally, in parallel, the software was asked to propose a “free” representation of the three MNBM, Dg, and FU files processed together. In this setting, a new discrimination of MST nodes is obtained, not constrained by the positions established on MNBM in the “frozen representation.” Interestingly, the Kaluza software immediately translates the color codes of the reference subsets in the “Free” representation. Moreover, the use of linked gates allows for an immediate comparison of the position and characteristics of any node-defined subset. More precisely, gates are linked in order to obtain a direct comparison of the same nodes in the FROZEN display and the concurrent coloring on relevant Free nodes. Applying the MFI normalization and display strategy described above also provides for an instant comparison of subset proportions and characteristics. This is especially valuable when tracking the leukemic population in the Dg listmode. For immediate control, a biparametric display of each listmode in a classical CD45/SSC cartography is also provided simultaneously on the working sheet.
In order to reduce the number of nodes to dissect, the notion of “nodes of interest” (NI) was devised, as an implementation of the FlowSOM package. A target node region was created on SSC versus CD45, focused on the progenitor (Bermudes) area 25 where blast cells are present in Dg samples. Nodes in this specific region were extracted from the Free FlowSOM result.
Results
Reference Normal BM MST
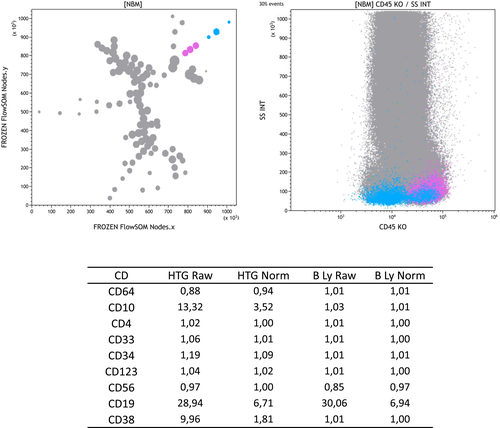
As mentioned in material and methods, for each set of MNBM (tubes A and B of the AML and ALL panels), around 24 different FlowSOM 100-node diagrams were generated, with new FlowSOM parameters ready to be used with the Kaluza software. Backgating the colors of a classical CD45/SSC cartography 25 on the FlowSOM nodes readily allowed to roughly identify cell subsets. A reference image was then chosen for each panel, so as to best graphically represent hematopoietic maturation pathways, that is, segregating myeloid, monocytic, and lymphoid lineages, with the most immature precursors of the Bermudes area 25 in a central position. More details of this tracking procedure are provided as Supporting Information. Once a reference MST was decided upon, detailed investigation of FLowSOM nodes was undertaken. By concomitantly displaying the normalized MFI of each node or nodes cluster, this allowed to identify lineage-related subsets. Examples are shown in Figure 1 and Supporting Information Figure S1 regarding hematogones, T-cell subsets, and granulocytes/immature granulocytes. Of note, concomitant backgating on relevant CD45/SSC cartography biparametric histograms provided a direct control of the adequacy of cluster classification. Specific colors were chosen for each subset, consistent with the rougher color code already published 25, 26.

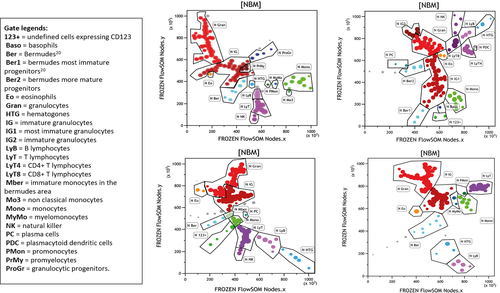
Figure 2 details the different hematopoietic subsets delineated by each of the four panels. These data are tabulated in Supporting Information Table S2, outlining the similitudes and specificities of each panel.

Unsupervised Comparison of Normal BM, Dg, and FU Samples
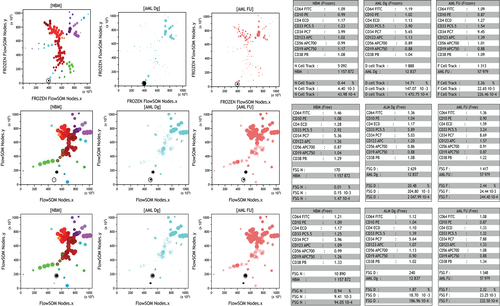
As shown in Figure 3, unsupervised concomitant analysis of MNBM, Dg, and FU files of a representative AML patient provided an instantaneous visualization, on FROZEN FlowSOM, of the position of (1) the abnormal progenitor cell node, (2) remaining normal hematopoiesis at Dg, and (3) regenerating subsets and possible Minimal residual disease (MRD) nodes in FU.

In this representation, the software assigns each cell to the most appropriate node from the FROZEN MST. The use of linked gates allows to collect all comparative immunophenotypic (by normalized MFI) and quantitative information about any given node or nodes cluster through the adjacent statistical tables. Finally, with the NI option, the reduced number of nodes to examine facilitated the identification of truly abnormal progenitor nodes in Dg samples (Supporting Information Fig. S2).
These comparative FROZEN MST further provide an excellent opportunity to verify the performance of pre-analytical MFI normalization. Quality control of the process is displayed in Supporting Information Figure S3. By systematically displaying monoparametric histograms of the “negative” MFI chosen to perform normalization, these data confirm that less than 15% MFI variation was observed between MNBM, Dg, and FU files (data not shown).
Because FROZEN MST assign cells to predefined “normal” nodes, it was hypothesized that a more accurate approach of Dg and, more important, MRD could be obtained by performing a dedicated “free” FlowSOM analysis after merging the three respective files for a given patient. Figure 3 also displays the MST obtained after Free FlowSOM analysis. Of interest, in this example, the single node of leukemic cells in the FROZEN MST representation is now appearing as two nodes in the “free” MST. A separate analysis of these two nodes reveals that the lower one, where cells express CD34, CD38, and CD33, represents the abnormal population, with significantly different proportions compared with MNBM. Conversely, the upper node, where cells lack CD33 and appear in similar proportions in the three MST, likely corresponds to normal hematopoiesis. In this specific example, MRD can thus accurately be evaluated as represented by the bottom CD33+ node.
Of note, on both FROZEN and “free” displays, the position of cells in the linked gates can be backgated on respective CD45/SSC graphs. This further confirms the clustered appearance of leukemic cells versus scattered partition of normal hematopoietic progenitors.
Of interest, the assignment of respective nodes to the diagnostic population of abnormal progenitors was made here without arbitrarily considering their immunophenotypic features. However, the latter were available at each moment in the statistic display. They could be refined by biparametric representations of any marker combinations as mentioned above (Supporting Information Fig. S4).
Discussion
Increasing numbers of unsupervised multidimensional cytometry analysis solutions have recently been published and tested either on artificial data sets or, seldom, on normal or pathological samples 13-17. Most of them, however, are essentially technical reports where pathological samples illustrate the power of the software. In an interesting comparison of clustering methods, it was recently reported without ambiguity that the FlowSOM solution was clearly superior to other proposals 12. A special mention was made to its fast runtimes, allowing interactive analysis on personal desktop computers, while other approaches require powerful hardware and long computing times. We perceived that FlowSOM could provide straightforward unsupervised MFC analyses in hematology 12.
Here, we thus report on an innovative implementation of the Bioconductor.org R FlowSOM package 24 adapted to analysis with the more traditional MFC software Kaluza. At variance from classical manual gating where subsets are identified by the subjective position of cursors or gates, FlowSOM uses fluorescences and light diffusion as continuous values to clusterize cell subsets. The use of classical software, such as Kaluza, allows to appreciate in a second step the MFI of each node in an unprecedented approach generating truly reproducible data defining objectively separated subsets.
The combination of FlowSOM and Kaluza thus provided a novel dissection of normal BM hematopoietic subsets, according to four different panels, in a completely unsupervised process. Implementation of the MST within the Kaluza software provided the possibility of supervised expert checking through the concomitant analysis of each node's characteristics, including classical representations (monoparametric, biparametric, radar, etc.) and detailed statistics (MFI, numbers, percentages, etc.). Subsets often difficult to segregate with traditional approaches then became evident as singled-out nodes (i.e., eosinophils, nonclassical monocytes, or stem cells; 26). Subtle new maturation pathways were also identified, not accessible so far with available tools, by dissecting MNBM in 100 nodes.
In addition, we pursued the intrinsic value of this approach by achieving direct concomitant application of the package to merged files of respective MNBM, Dg, and FU samples. The FROZEN approach allows for a concomitant comparison of stable subsets such as granulocytes, monocytes, and lymphocytes. In the same step, the “free” MST approach simultaneously allows for a more refined analysis of variations within the progenitor/blast subsets together with normal hematopoiesis. Concomitant analysis of FROZEN and “free” representations provides a simple and controlled analysis of MRD through the links between nodes both between MNBM, Dg, and FU MST and between the FROZEN and “free” representation. This is at variance from other solutions comparing a database of normal samples to separate analyses of individual samples 27.
We confirmed the rapidity of FlowSOM and further developed the possibility to navigate in real time between MST maps and classical mono- or biparametric histograms generated by Kaluza. This procedure appeared to be more adequate than automatic assignment of subset subpopulations, even if monitored by heat-map solutions 10, especially for MRD detection.
Some practical aspects of this work must be highlighted. Implementation of the enhanced FlowSOM solution can of course be applied to any .fcs file, with little cell number limitation (here merged listmodes exceeded 106 cells which did not significantly affect the speed of FlowSOM processing). However, in order to make comparisons accurate, several preanalytical steps must be considered. Obviously, harmonized settings of instruments must be used 20 together with the same panel. This allows for the rapid acquisition of whole BM fresh samples tested in the best conditions of lysis no wash. Such settings, making the best of MFC, avoid any cell loss or selection induced by cell separation and washes. Upon analysis, .fcs files must be optimally compensated and then normalized, if needed, to ensure proper superimposition, yet taking into account physiological interindividual variations. The latter were minimized by the use of a rather large number of normal BM samples. Resulting reference MNBMs thus encompass these small differences, providing a normalized “envelope” of hematopoietic subsets. Of note, FlowSOM can generate an unlimited number of MST with the same nodes in different representations, allowing to choose the best operational graphical display to create the FROZEN MST. Afterward, FlowSOM assigns subsets to the FROZEN nodes, thus yielding normal patterns for any single normal BM. The use of colors and precise analysis of each node's characteristics provide both an in-depth description of differentiation pathways and a reference map easily understood.
Node-by-node comparison of MNBM, Dg, and/or FU samples, using either the “FROZEN” or “free” application of FlowSOM, allows to readily observe the disappearance of specific nodes resulting from maturation blockade or variations in those representing regeneration. The precise description of AML samples disclosed a complex organization in subsets, undiscernible with the traditional CD45/SSC representation. The classical clustered blastic population appeared in fact to be composed of the superimposition of these subtly different subsets. The concepts of leukemia-associated immunophenotypes or different from normal immunophenotypes 28-30 found here a clear and immediately grasped definition. The importance of this degree of delineation for therapeutic or prognostic purposes is now being explored by our team within the European LeukemiaNet initiative 31.
In conclusion, this report describes a radically novel way of analyzing classical flow cytometry data. FlowSOM comes in free Bioconductor R packages on the R environment that should allow other software developers to take advantage of the innovations designed during this project. This solution opens a new field of investigations in MFC, obviously not limited to such hematological malignancies as acute leukemia, myelodysplasia, and lymphoproliferative disorders but also encompassing this whole field of medicine.
Acknowledgments
The authors are grateful to Beckman Coulter S.A.S. for logistics support, to A. Briais, M. Jeanneteau, M. Giraudon, and J. Lacombe for their technical assistance and M. Maynadié and C. James for fruitful discussions.
Conflict of Interests
The authors declare that they have no competing interests.


