Optimization of rhabdomyosarcoma disseminated disease assessment by flow cytometry
Abstract
Rhabdomyosarcoma (RMS) is the most common type of soft tissue sarcoma in children. Circulating tumor cells in peripheral blood or disseminated to bone marrow, a concept commonly referred to as minimal residual disease (MRD), are thought to be key to the prediction of metastasis and treatment efficacy. To date, two MRD markers, MYOD and MYOGENIN, have been tested; however, MRD detection continues to be challenging mainly owing to the closeness of the detection limit and the discordance of both markers in some samples. Therefore, the addition of a third marker could be useful for more accurate MRD assessment. The PAX3 gene is expressed during embryo development in all myogenic precursor cells in the dermomyotome. As RMS cells are thought to originate from these muscle precursor cells, they are expected to be positive for PAX3. In this study, PAX3 expression was characterized in cancer cell lines and tumors, showing wide expression in RMS. Detection sensitivities by quantitative polymerase chain reaction (qPCR) of the previously proposed markers, MYOD and MYOGENIN, were similar to that of PAX3, thereby indicating the feasibility of its detection. Interestingly, the flow cytometry experiments supported the usefulness of this technique in the quantification of MRD in RMS using PAX3 as a marker. These results indicate that flow cytometry, albeit in some cases slightly less sensitive, can be considered a good approach for MRD assessment in RMS and more consistent than qPCR, especially owing to its greater specificity. Furthermore, fluorescence-activated cell sorting permits the recovery of cells, thereby providing material for further characterization of circulating or disseminated cancer cells. © 2014 International Society for Advancement of Cytometry
Although epithelial circulating tumor cells (CTCs) were first described well over 100 years ago 1 and associated with cancer in various early studies 2-4, only recently has CTC appraisal been shown to be clinically significant in epithelial malignancies including breast 5, colon 6, and prostate cancer 7, 8, among others. In pediatric sarcomas, several works on Ewing's sarcoma 9-12, rhabdomyosarcoma (RMS) 13, 14, synovial sarcoma 15, and osteosarcoma 16 have suggested the possible use of cancer markers (especially translocation products) and tissue-specific markers for CTC detection. However, results of studies conducted on larger series of pediatric patients together with better standardization of techniques are necessary before they can be used for individual staging of patients. The markers used to detect tumor cells by reverse-transcriptase polymerase chain reaction (RT-PCR) can be either "tissue-specific" or "tumor-specific." The drawback of the first group of markers is linked to the observation that tissue specificity is frequently a relative concept leading to a high rate of false positives. Conversely, the tumor-specific markers, such as translocation products, are considered ideal markers 17.
RMS is one of the most common extracranial solid tumors and the most common type of soft tissue sarcoma in children. RMS can be divided into two major histopathologic subtypes: embryonal and alveolar (eRMS and aRMS, respectively). The majority of aRMS (80–85%) contain one of the reciprocal chromosomal translocations: t(2;13)(q35;q14) or t(1;13)(p36;q14). These translocations generate the novel fusion genes PAX3/FOXO1 and PAX7/FOXO1, respectively 18, 19. However, no characteristic translocations have been described in eRMS. The embryonal subtype is characterized by the loss of heterozygosity in the short arm of chromosome 11 (11p15.5) 20 and gains in chromosomes 2, 7, 8, 11, 12, 13, and 17 21. Patients with metastatic RMS have very poor prognosis and recurrences are common in advanced localized disease. Minimal residual disease (MRD)—CTCs in peripheral blood (PB) or disseminated to bone marrow (BM)—is a widespread feature of this neoplasia 13, 14. MRD assessment is thought to be crucial for evaluation of the risk of metastasis and the appraisal of treatment efficacy. In addition, the volume of blood or BM required is not limiting for the purpose of minimal disseminated disease assessment and samples are taken at diagnosis and at regular intervals during treatment in patients with RMS. In this neoplasia, MRD has previously been studied by conventional and quantitative PCR (qPCR). The markers most used are muscle-specific transcription factors such as MYOD1 and MYOGENIN, and the RMS-specific chimeric transcripts PAX3/FOXO1 and PAX7/FOXO1 13, 14, 22, 23. Particularly in aRMS cases bearing translocation of PAX genes with FOXO1, the chimeric products PAX3/FOXO1 and PAX7/FOXO1 for MRD monitoring are highly specific for tumor cells, because these fusion genes are absent in the genome of normal cells. However, the translocation-bearing tumors account for only 15% of overall RMS cases; therefore, in the majority of cases, the chimeric transcripts are not available as MRD markers. The detection of tissue-specific transcription factors by qRT-PCR is controversial owing to their possible residual expression, albeit extremely low, in control PB or BM that could give rise to false positives 17. Furthermore, the majority of RMS patients positive for MRD are only detected after a high number of PCR cycles (at high Ct values, corresponding to very low levels of the target template) when the qPCR reliability and reproducibility markedly decrease 13, 14. For this reason, we postulate the convenience of the optimization of a flow cytometry-based method to detect RMS CTCs.
Although similar or slightly lower in sensitivity, flow cytometry may render greater specificity than PCR-based techniques, particularly in cases with relatively low expression of the marker in tumor cells. Thus, while RT-PCR or qPCR are not able to distinguish between an extremely low number of cells expressing high amounts of a marker (i.e., CTCs) from a high number of cells expressing extremely low levels of the same marker (i.e., blood or BM cells), flow cytometry can make this distinction as it is able to analyze the expression of the marker on each particular cell; furthermore, because FACS permits sorting of positive cells, additional experiments such as RT-PCR or immunocytochemistry within this unknown subpopulation may be performed, thereby enabling molecular characterization of CTCs. Conversely, neither conventional nor qPCR are able to characterize CTCs beyond the mere statement of their presence or absence.
PAX3 gene codifies for the paired-homeodomain transcription factor PAX3, which is expressed during development in all myogenic precursor cells in the dermomyotome 24. Although myogenesis advances, PAX3 expression gradually ceases, thereby permitting the differentiation of myogenic precursors into myoblasts and, in turn, their fusion to form skeletal muscle fibers 24. When dermomyotome cells are committed to abandoning their epithelial status, they undergo an epithelial–mesenchymal transition and begin migrating toward their final mesenchymal destination 25. These migratory myogenic precursor cells express PAX3, the expression of which is essential for retention of their proliferative status and migratory capability. Once their final destinations are reached, e.g., limb bud mesenchyma, PAX3 expression progressively declines and these cells begin to express muscle-promoting factors (MRFs) such as Myf5, MYOD, MYOGENIN, and Mrf4, which lead precursor cells to evolve into myoblasts able to fuse with each other and differentiate, in turn, into skeletal muscle fibers 25. As RMS is thought to originate from these PAX3-expressing myogenic precursors, PAX3 has been suggested as a central player in the etiology of RMS and the finding of its expression in the great majority of RMS tumors with or without PAX3/FOXO1 translocation 26 raises the possibility of its expression being used as a marker for circulating RMS cells. However, PAX3 appears to be expressed also in some tumors belonging to the Ewing sarcoma family 27 and in tumors of neural crest origin such as neuroblastoma and melanoma 28; therefore, the expression of PAX3 is not restricted to RMS and this invalidates the use of PAX3 expression as a differential diagnostic tool. Nevertheless, the use of a marker such as PAX3 for the detection of CTCs in patients with a previously well-established diagnosis is feasible given that there is no PAX3 expression in PB and BM.
In this study, the expression of PAX3 in RMS and other tumors was analyzed, and the sensitivity of PAX3 detection by qPCR was compared with that of MYOD and MYOGENIN to validate PAX3 as an additional MRD marker in RMS. Furthermore, a new method based on PAX3-immunolabeling and flow cytometry analysis in blood and BM is proposed, as a more specific and reliable tool for minimal disseminated disease assessment in RMS.
Materials and Methods
Cell Culture
Alveolar (RH30, CW9019, and RH18) and embryonal (RD) RMS cell lines were grown in Minimum Essential Medium Eagle with Earle's Salts (MEM), supplemented with 10% fetal calf serum (FCS), 2 mM l-glutamine, 1 mM sodium pyruvate, 1× nonessential amino acids, 100 U/mL penicillin, and 0.1 mg/mL streptomycin (all reagents from PAA Laboratories, Haidmannweg, Austria), and maintained at 37°C in a 5% CO2 water-jacketed incubator. RH18 and RD cell lines were a kind gift from Dr Beat W. Schäfer; TC71 and SKES (Ewing's sarcoma with EWS/FLI translocation) were donated by Dr Oscar Martínez-Tirado. SK-N-AS and LAI-5S (metastatic neuroblastoma), MDA-MB-231 (metastatic breast adenocarcinoma), PANC-1 (pancreatic carcinoma of ductal origin), PC3 (bone metastasis from prostate cancer), Jurkat (T-cell leukemia), U-373 MG and U-87 MG (glioblastoma astrocytoma), HeLa (cervical carcinoma), and A549 (adenocarcinoma from lung alveolar basal epithelia) cell lines were kindly provided by researchers of the Vall d'Hebron Institut of Research (VHIR). Each cell line was cultured according to the recommendations of the American Type Culture Collection (ATCC).
Human Samples
Tumors including 18 RMS, nine Ewing's sarcomas, two synovial sarcomas, and two fibrosarcomas were from our private collection (Instituto de Salud Carlos III collection number C.0002311). All tumor samples were from patients referred for diagnosis and/or treatment at the Pediatric Oncology Department of the Vall d'Hebron Hospital. Informed consent had previously been obtained from all parents or legal guardians. Fetal muscle samples were obtained from the Pathology Department of the Vall d'Hebron Hospital.
Sensitivity of PAX3 detection assays was determined by spiking experiments of RMS cells in PB of healthy donors. From 101 to 106 RMS cells were mixed in a volume of PB corresponding to 107 mononuclear cells (MNCs). White cells were obtained after incubation of spiking samples with erythrocyte lysis buffer, followed by two washes with PBS. Samples were divided for RT-qPCR and flow cytometric analysis.
Flow Cytometry
Cells were blocked with 2% FCS in phosphate buffered saline (PBS). For leukocyte staining, samples were incubated with fluorescein isothiocyanate (FITC)-conjugated anti-CD45 primary antibody (5 µL/1 × 106 cells, Invitrogen, Carlsbad, California) for 30 min at room temperature. For viability determination, dead cells were stained with 7-aminoactinomycin D (7-AAD) (5 µL/1 × 106 cells, R&D Systems, Minneapolis, Minnesota). After two washes with PBS, cells were fixed with 4% freshly prepared paraformaldehyde (Sigma-Aldrich, St. Louis, Missouri, Cat 15812-7) in PBS for 10 min and washed with permeabilizing solution consisting of 0.2% Triton X-100 in blocking solution. Samples were then incubated with phycoerythrin (PE)-conjugated anti-PAX3 primary antibody (10 µL/5 × 105 cells, R&D Systems) for 30 min at room temperature. The mouse IgG2A phycoerythrin isotype control (clone 20102) from R&D systems was used as a control. A cell line with high PAX3 expression (RH-30) and a cell line with extremely low expression (LAI-5S) were used as positive and negative control, respectively. Samples were analyzed with an LSRFortessa cytometer (BD Bioscience, Erembodegem, Belgium) equipped with four lasers—blue, red, violet, and UV—which provide flexibility to accommodate the detection of up to 18 colors simultaneously with a defined set of optical filters. Flow cytometric plots were obtained with FCS Express 4 Flow Research Edition software (Denovosoftware). Cytometry plots show ∼100,000 cells (to avoid saturation), but all the analyses were made with a minimum of 1 million total viable cells. The sensitivity of this assay was referred to as the lower limit of detection (LLD). LLD is the lowest quantity of a substance that can be distinguished from the absence of that substance (a blank value) within a stated confidence limit (in our case P < 0.05). The LLD is estimated from the mean and standard deviation of the blank 29. At least five determinations of blank samples (PB) were taken for each cell line.
RNA Extraction, Retrotranscription, and Real-Time PCR
Total RNA from cell lines and tissues was extracted using the RNeasy Mini Kit (Qiagen, Valencia, California) and from PB, BM, and spiking samples using the QIAamp RNA Blood Mini Kit (Qiagen) following the manufacturer's instructions. Two micrograms of total RNA was incubated with random primers (Invitrogen) for 5 min at 70°C and reverse-transcribed using 200 U of Moloney murine leukemia virus reverse transcriptase (Promega, Madison, Wisconsin) for 1 h at 37°C. A 40-cycle PCR based on the TaqMan assay (Applied Biosystems) was performed to detect MYOD, MYOG, and PAX3 (Hs0015928_m1, Hs01072232_m1, and Hs00240950_m1 TaqMan assays, respectively). The primers and the probe used for PAX3-FOXO1 mRNA detection were as follows: 5′-TGAACCCCACCATTGGCAAT-3′, 5′-CTGTGTAGGGACAGATTATGACGAA-3′, and 5′-TCTCACCTCAGAATTC-3′. The primers and the probe used for PAX7-FOXO1 mRNA detection were as follows: 5′-ACATGAACCCGGTCAGCAA-3′, 5′-CTGTGTAGGGACAGATTATGACGAA-3′, and 5′-CTGTCTCCTCAGAATTC-3′. The housekeeping gene TBP (assay Hs00172424_m1) was used as internal control. Relative levels of each mRNA analyzed were quantified by the method of Livak and Schmittgen 30. All samples were tested in triplicate. The sensitivity of these assays was determined by the LLD parameter, as described above.
Results
Endogenous PAX3 Is Widely Expressed in RMS
PAX3 labeling was assayed by flow cytometry in a panel of RMS and non-RMS cell lines to assess the specificity of this marker. The panel of non-RMS cell lines includes cells of Ewing's sarcoma (TC71, SKES, and HTB166), neuroblastoma (SK-N-AS and LAI-5S), breast cancer (MDA-MB-231), pancreatic cancer (PANC-1), prostate cancer (PC3), T-cell leukemia (Jurkat), glioma (U-87 MG), cervical carcinoma (HeLa), and lung cancer (A549). PAX3-labeled cells were analyzed by flow cytometry. All the RMS cell lines analyzed (RH30, CW9019, RH18, and RD) showed a significant fraction of PAX3-positive cells (Fig. 1A), thereby indicating the suitability of PAX3 as an RMS marker. Very low levels of or no positive cells were encountered in the non-RMS cell lines, except for one neuroblastoma cell line and one glioma-derived cell line, which showed a moderate amount of positive cells. Illustrative cytometric plots (RH30 cell line) are shown in Figure 1B and Supporting Information Figure S1 (LAI-5S cell line).
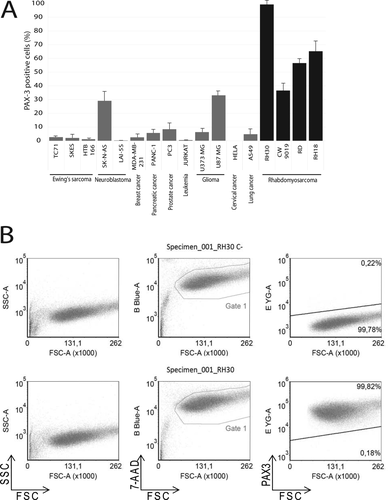
(A) Flow cytometry analysis of PAX3 staining positivity in a panel of non-RMS cancer cell lines (gray bars) and RMS cell lines (black bars). The name of each cell line and corresponding cancer type are indicated at the base of each bar. (B) Cytometric plots in RH30 cell line illustrating the analysis made for each cell line in A. Each cell line was labeled with an isotype control (upper panel, C-) and anti-PAX3 antibody (lower panel). Plots depict the forward and reverse scattering (left), viability analysis (B Blue-A, 7-AAD, center), and PAX3 labeling (E YG-A, PE, right), respectively.
PAX3-based MRD determination would only be feasible in samples from patients with PAX3-expressing tumors; therefore, the first step is to assess its expression in a wide panel of tumors. To ascertain the prevalence of this marker in tumors, a PAX3 mRNA expression analysis by qPCR was performed in a panel (n = 15) of RMS tumor samples (Fig. 2A). All the aRMS analyzed presented high PAX3 expression, with all the cases of this subtype (n = 6) showing at least a fourfold increase compared to fetal skeletal muscle (FM). PAX3 levels in eRMS (n = 10) also showed remarkably high levels, with 66% of cases at least doubling the expression level of the reference tissue (FM). Thus, only in three of 15 RMS cases analyzed were PAX3 levels slightly below the level of FM. However, the fact that the reference tissue (FM) is a PAX3-expressing tissue, albeit at moderate levels, should be taken into account and even the three cases of RMS with levels lower than FM (value < 1) can be considered slightly positive for PAX3 expression, because their expression is detectable given the absolute negativity of PB and BM samples. Importantly, in all PB and BM samples analyzed (mRNA from MNC fraction), PAX3 was not detectable.
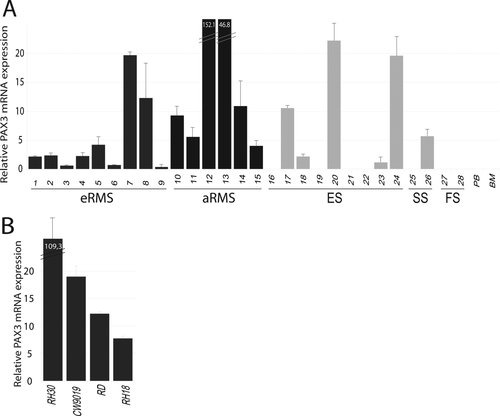
(A) PAX3 expression levels in tumors measured by quantitative PCR in eRMS (dark gray bars), aRMS (black bars), and other pediatric sarcomas (soft gray bars), including Ewing's sarcoma (ES), synovial sarcoma (SS), and fibrosarcoma (FS). PB and BM: peripheral blood and bone marrow from healthy donors. (B) Relative PAX3 mRNA expression in RMS cell lines. In both A and B, all relative mRNA levels are referred to those of PAX3 in normal fetal muscle.
PAX3 expression was analyzed by qPCR to establish its possible application as a marker for MRD detection in Ewing family tumors and other pediatric sarcomas (Fig. 2A). Although some of the non-RMS tumors presented detectable PAX3 levels, a significant percentage of cases showing extremely low or no expression was found (53%), thereby invalidating the possible use of PAX3 as an MRD marker in these sarcomas (no expression in four of nine for Ewing's sarcoma, one of two for synovial sarcoma, and two of two for fibrosarcoma; Fig. 2A).
The RMS cell lines analyzed expressed high amounts of PAX3 compared to fetal muscle as a reference tissue (Fig. 2B), with more than a 100-fold change for RH-30, more than a 15-fold change for CW9019, and a fold-change between 5 and 15 for RD and RH18.
PAX3 Could Be Considered a Highly Sensitive Additional Marker for MRD
As the applicability of an MRD marker strongly relies on its capability to detect small amounts of tumor cells in blood or BM samples, it is important to compare its sensitivity with that of the markers previously shown by qPCR. For this reason, the sensitivities of translocation products (involving PAX3 and PAX7 with FOXO1), MYOD and MYOGENIN, detected by qPCR were compared with that of endogenous PAX3 (Fig. 3A). Sensitivities were assayed in 10-fold-increasing serial dilutions of RMS cells in 107 MNCs from PB of healthy donors. The dilutions were prepared with three different RMS cell lines (RH30, CW9019, and RD) expressing different relative levels of the markers analyzed. The detection limit of a target gene relies strongly on the expression levels of this target in each cell line. Thus, the RH30 cell line (bearing PAX3/FOXO1 translocation) expressed high levels of PAX3/FOXO1, MYOD, MYOGENIN, and endogenous PAX3, and the cell line CW9019 (bearing PAX7/FOXO1 translocation) expressed high levels of PAX7/FOXO1 and MYOD, but moderate levels of MYOGENIN and PAX3. Finally, the cell line RD (bearing no translocation) showed low levels of endogenous PAX3, moderate levels of MYOGENIN, and high levels of MYOD (Fig. 3B). Owing to the high levels of all markers analyzed in RH30, all were detected with the same high sensitivity. Thus, all markers were detected up to a dilution of 102 tumor cells/107 MNC in this cell line. The cell line CW9019 showed sensitivity of 102 for MYOD, 105 for MYOGENIN, 102 for PAX7/FOXO1, and 103 for endogenous PAX3. Finally, MYOD and MYOGENIN were detected in the cell line RD at 102 and 103, respectively, while PAX3 was detected at the dilution of 104 cells/107 MNC (Fig. 3A).
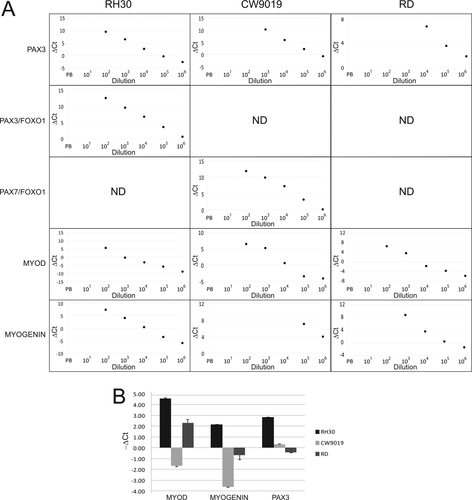
(A) Sensitivity of quantitative PCR for PAX3, PAX3/FOXO1, PAX7/FOXO1, MYOD, and MYOGENIN. Serial dilutions of RMS cells at 10-fold increments in peripheral blood were analyzed for expression of the markers assessed by qPCR. The points not shown for each marker correspond to points under the qPCR limit of detection and therefore not detected. ND: not detected in any dilution. (B) Expression levels of MYOD, MYOGENIN, and PAX3 in the three cell lines used in spiking experiments. All determinations were made in triplicate.
PAX3 Detection-Based Flow Cytometry Is a Highly Specific and Sensitive Methodology
Sensitivity of the PAX3 cytometric assay was determined in 10-fold-increasing serial dilutions of RMS cells in 107 MNCs from PB of healthy donors. The RMS cells used for the serial dilutions were RH30 (aRMS-bearing PAX3/FOXO1 translocation), CW9019 (aRMS-bearing PAX7/FOXO1 translocation), and RD (eRMS). CD45 is a protein tyrosine phosphatase considered a hematopoietic cell marker, with the exception of erythrocytes and platelets; therefore, the majority of blood cells are expected to be found in the PAX3−/CD45+ subpopulation (upper left quadrant).The tumor cells could be visualized as a well-differentiated PAX3+/CD45− subpopulation appearing in the lower right quadrant (Fig. 4, all plots of RH30 cell line are shown). At dilutions with a high tumor cell load (104, 105, and 106), PAX3+/CD45− cells were easily detected as a well-differentiated subpopulation; furthermore, down to a dilution with 103 cells, a slight increase in the percentage of cells in this quadrant could also be detected. Thus, sensitivities for RH30, CW9019, and RD cell lines were between 103 and 104 cells/107 MNC. The presence of cells in the upper/right quadrant (CD45+/PAX3+) is also noteworthy. The cell percentage in this quadrant in PB samples suggests the presence of a population of cells positive for both markers in blood. Using the percentages of PAX3+/CD45− cells obtained per each dilution and each cell line, we obtained the plots depicted in Figure 5. The lower limit of detection (LLD or LOD) was calculated for each cell line (Fig. 5) as previously described 15 to evaluate numerically the sensitivity of the assay. The LLD is the lowest value for an analyte that can be statistically distinguished from a blank. The probability of a false positive above this value is 5%. Using this statistic, the limits of detection for the three cell lines analyzed were calculated, thereby rendering values of 1.13 × 10³, 1.70 × 10³, and 1.92 × 10³ cells referred to 107 MNC for the cell lines RH30, CW9019, and RD, respectively. The mean and standard deviation of the blank control were calculated from five independent determinations of blood samples from healthy donors.
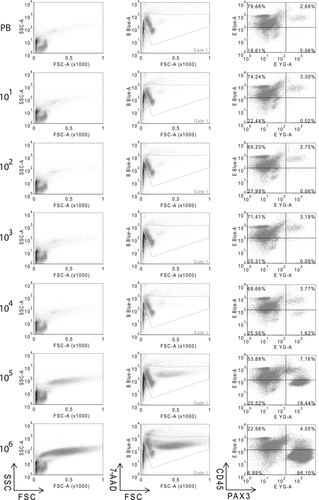
Flow cytometry plots of serial dilutions of RMS cells (RH30) in peripheral blood. Samples were labeled with PAX3 and CD45 antibodies. The number on the left denotes the input of RMS cells/107 blood mononuclear cells. The plots depict forward and side scatterings (left), viability and forward scattering (B Blue-A, 7-AAD, center), and double labeling PAX3 and CD45 (E-Blue-A/PE and E YG-A/FITC, respectively, right). In the last case, plots were subdivided into four quadrants and the percentage of cells in each quadrant is indicated inside the corresponding quadrant. RMS cells are shown in the lower-right quadrant (CD45−/PAX3+).
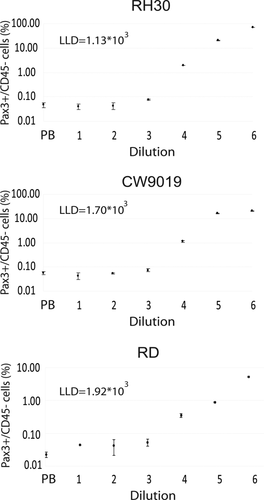
Sensitivity assessment of cytometric assay in serial dilution (spiking) experiments. The cell line is indicated at the top of each plot and the lower limit of detection (LLD) is indicated inside each plot. The dilution indicates the number of RMS per 107 blood MNC. The plots represent the percentage of CD45−/PAX3+ cells detected in each dilution. Each point corresponds to the mean of three independent determinations.
Discussion
The detection of RMS cells in PB and BM is thought to be of the utmost importance for the management of patients with this malignancy 13, 14. RMS-specific translocation products PAX3/FOXO1 and PAX7/FOXO1 as markers for RMS cells are widely accepted owing to their absolute specificity for tumor cells. Unfortunately, such ideal markers cannot be used in the majority of RMS patients (∼85%). On the other hand, the detection by qPCR of MYOD and MYOGENIN (and also PAX3), albeit very sensitive, is challenging owing to the possible presence of these mRNAs in some blood or BM cells. This “illegitimate” transcription in control tissue should be taken into account as MRD detection by qPCR in patients is usually very close to the detection limit of the technique, thereby increasing the risk of false positives. A further problem is the noncoincident detection of the two most widely accepted markers, MYOD and MYOGENIN, in some patient samples 14. Usually, only patients with positivity of both markers are considered true positives. The significance of a single positivity remains unclear. The addition of a third marker such as PAX3 could contribute to the correct classification of more patients. Interestingly, although sequential expression is found in normal muscle development of these three muscle differentiation markers, a mutually exclusive expression is not observed in tumors, thereby suggesting that the normal regulation that drives these genes in muscle is absolutely lost in tumors.
One of the main technical challenges we faced in this work was the absence of known membrane surface RMS markers. All currently known RMS markers are transcription factors that are usually located in the cell nucleus. This feature technically complicates the work and renders it necessary to fix and permeabilize the cells, thereby making the recovery of live cells impossible. However, the cytometric procedure reported in this work permits the recovery of cells from which biologic material can easily be extracted, thereby enabling the molecular characterization of CTCs. The molecular characteristics of this rare subpopulation of cells are to date totally unknown. Deeper understanding of the molecular mechanisms that permit these cells to survive away from the tumor and eventually form new tumors would be essential for future therapies focused on metastasis reduction.
This study revealed PAX3 expression in all RMS tumors analyzed, the majority with levels higher than FM, thereby pointing to PAX3 as a candidate marker for the detection of circulating or disseminated disease. However, the expression of PAX3 is not restricted to RMS, as PAX3 expression has been previously described in some other pediatric sarcomas such as Ewing's 27 and also neural tumors such as neuroblastoma or melanoma 28. Taken together, our results suggest that PAX3 expression cannot be used in other sarcomas owing to the great variability of expression shown among cell lines and tumor samples, including a significant percentage of samples with undetectable PAX3 levels. Obviously, PAX3 would not be useful as a differential diagnostic marker; however, in patients with a previously well-established RMS diagnosis, it could be a very interesting tool for MRD assessment. Interestingly, PAX3 levels were variable, albeit always detectable, in RMS. This variability may suggest heterogeneity in RMS in terms of PAX3 oncogenic dependence. In general, PAX3 levels in ARMS were higher than in ERMS; however, flow cytometry is able to distinguish better than qPCR the presence of cells with weak positivity. For instance, the RD cell line corresponds to ERMS subtype and presented very low PAX3 levels and, as shown in Figures 3 and 5, the sensitivity was somewhat better (1 log) by flow cytometry and relatively similar to the other (strongly expressing PAX3) cell lines. Sensitivity by qPCR strongly relies on the expression level of the target because positive cells were diluted in a majority of negative cells and the analysis was made in cell lysates as an overall mix. The fact that cytometry detects the specific expression of a given marker in each particular cell renders it a more robust method. The main condition for its detection is that the level of expression in tumor cells can be distinguishable from the level of blood or BM cells (which do not express PAX3).
The higher levels of PAX3 expression may be explained in terms of PAX/FOXO1 translocation presence in ARMS. However, the presence of endogenous PAX3 in ERMS suggests that the biologic role of this transcription factor in tumors that bear no PAX3 translocation may be important and warrants further study in the future.
An interesting previous work reported the sensitivity of qPCR in spiking experiments performed with lymphoma cell lines instead of PB MNC 14. That study yielded sensitivity near to 101 RH30 tumor cells per 107 MNC; however, the spiking was made with the immortalized cell line U937 instead of MNC from PB 14. Whole blood contains nucleated white cells that constitute an easily accessible source from which RNA can be extracted. However, blood is a particularly problematic tissue from which to isolate RNA as this nucleic acid is extremely prone to degradation by ribonucleases, of which red cells are a rich source. The qPCR from samples prepared with blood MNC lost approximately one logarithm of sensitivity, with an approximate sensitivity of 102 for RH30. Furthermore, as shown in Figures 1A, 2B, and 3B, the cell line used in these studies, RH30, strongly expresses myogenic markers such as MYOD and MYOGENIN as well as PAX3. Therefore, this cell line is the most ideal model we can use to achieve high sensitivity. Unfortunately, the majority of RMS cell lines and patients' tumors do not show such high expression of myogenic markers, which therefore reduces assay sensitivity. CW9019 and RD cell lines were detected with lower sensitivities and their level of detection in serial dilutions, as expected, correlated with the level of expression of the marker in each cell line. In this work, the inclusion of cell lines with moderate levels of myogenic markers, such as CW9019 and RD, provided more realistic models by which to evaluate the capability of minimal disseminated disease detection of a given methodology.
Flow cytometry for MRD in leukemia has been increasingly used for identifying leukemia-associated immunophenotypes 31 and has also been described for Ewing's sarcoma MRD assessment 32 and as a diagnostic tool in several pediatric sarcomas including RMS 33. Recent advances in leukemia indicate a concordance with PCR-based MRD data in up to 96% of cases. However, PCRs remain more sensitive at MRD levels below 103 leukemic cells in 107 blood MNC 34. This result concurs with those we obtained in RMS cells. The consistency of detection in the three RMS cell lines with sensitivity close to 103 is noteworthy. Remarkably, although qPCR was highly dependent on the expression levels of the marker in each cell line, flow cytometry yielded a more constant sensitivity. Although the sensitivity of PCR was higher than that of cytometry for the RH30 cell line, this relationship changed in the cell lines CW9019 and RD. In these cell lines, cytometry detected the presence of CTCs similar to or even better than PCR, particularly in the RD cell line (PCR sensitivity 104 for PAX3). This comparison suggests that in patients with PAX3-low-expression CTCs, cytometry sensitivity could be better than that of qPCR.
The addition of a third marker (PAX3) to the current qPCR-based double analysis (MYOD and MYOGENIN) could help to reduce the risk of false positives, thereby improving the reliability of this method. Furthermore, a challenge for coming years will be to translate the flow cytometry-based method to patients, study cooperatively its applicability in a large cohort of patients, and investigate its capacity to predict metastases, thereby establishing its clinical value. Finding a truly reliable method for MRD quantification in RMS could lead to improved patient follow-up and better prediction of metastasis risk which, in turn, could eventually lead to a reduced mortality rate.
Acknowledgments
The authors thank Mr Alex Bote and Dr Irene Sales for technical support with flow cytometer management, Dr Paqui Gallego for technical support with the real-time PCR assays, and Ms Christine O'Hara for help with the English version of this manuscript. The authors declare no conflict of interest.


