Image-based computational fluid dynamics for estimating pressure drop and fractional flow reserve across iliac artery stenosis: A comparison with in-vivo measurements
Funding information: Canon Medical Research Europe Ltd.; Medical Research Scotland, Grant/Award Number: PhD-888-2015
Abstract
Computational Fluid Dynamics (CFD) and time-resolved phase-contrast magnetic resonance imaging (PC-MRI) are potential non-invasive methods for the assessment of the severity of arterial stenoses. Fractional flow reserve (FFR) is the current “gold standard” for determining stenosis severity in the coronary arteries but is an invasive method requiring insertion of a pressure wire. CFD derived FFR (vFFR) is an alternative to traditional catheter derived FFR now available commercially for coronary artery assessment, however, it can potentially be applied to a wider range of vulnerable vessels such as the iliac arteries. In this study CFD simulations are used to assess the ability of vFFR in predicting the stenosis severity in a patient with a stenosis of 77% area reduction (>50% diameter reduction) in the right iliac artery. Variations of vFFR, overall pressure drop and flow split between the vessels were observed by using different boundary conditions. Correlations between boundary condition parameters and resulting flow variables are presented. The study concludes that vFFR has good potential to characterise iliac artery stenotic disease.
1 INTRODUCTION
Nevertheless, the concept of FFR has not as yet been extensively tested for the assessment of stenotic disease in other body areas where they are common such as the iliac, femoral and renal arteries, where the use of the index can also be beneficial. While ultrasound (US) measurements can be performed in peripheral vessels such as the iliac arteries, these can only be accurately obtained from slim patients and are otherwise negatively impacted by obesity, bowel gas etc. or incorrect angle of intonation [7]. Ultrasound measurements also suffer from a high degree of intra- and inter-observer variability and is therefore less acceptable clinically compared to computed tomography angiography (CTA) and magnetic resonance angiography (MRA) [8]. Additional disadvantages of US measurements are that they require skilled personnel and are time consuming, which can make them effectively more expensive than expected [7], and the images are not readily interpretable by clinicians for discussion at multi-disciplinary team meetings. On the other hand, and in addition to improved sensitivity over US [9], advantages of MRA include the ability to extract morphological information which can be used to help procedure planning (by providing information about required stent sizes etc.) [7]; and in the rare cases where patients have preference, MRI is the preferred option, as US can induce more pain as more pressure is exerted in order to visualise deep iliac arteries or displace bowel gas [10].
The established first choice non-invasive test for peripheral artery disease has been the measurement of ankle-brachial index (ABI) [11]. Still, ABI has limited applicability since meaningful values can only be measured post-exercise which is not always possible in elderly patients which tend to be the group suffering from PAD the most [11]. Hioki et al, however, showed that there is a good correlation between ABI and FFR making it a viable alternative [11]. Nevertheless, invasively measured FFR has its own limitations and can be affected by measurement errors arising from the guide wire partially blocking the vessel [12]. Furthermore invasive FFR measurement is associated with increased risks and costs: requiring drug administration, specialist equipment, an operating room and a medical team [13]. Ideally healthcare providers and patients are interested in minimising all associated costs and eliminating all unnecessary risks without compromising on service quality. Therefore, there has been an increasing interest in recent years in determining FFR non-invasively by taking advantage of advances in medical imaging and the ever increasing computational power that is available.
Computational fluid dynamics (CFD) is a branch of engineering that deals with solving fluid dynamic problems through numerical methods. CFD combined with high quality medical imaging data can be a powerful tool and a viable non-invasive alternative to catheter derived pressure measurements for FFR calculation. When it comes to the original definition of FFR in the coronary arteries several studies of non-invasive computed FFR based on imaging data have been published [14-18]. The accurate prediction of blood flow via CFD simulations is dependent on many factors such as accurate representation of the geometry, mesh quality, the numerical methods that have been used, and appropriate boundary conditions. Out of these the geometry reconstruction and mesh quality have some of the highest impact when it comes to coronary artery FFR, closely followed by the choice of boundary conditions [19, 20]. Sankaran et al investigated errors in calculating CFD derived coronary FFR on CT-derived geometries (FFRCT) using inlet velocity profiles estimated from cardiac output and resistance boundary conditions. The study showed that in two out of three of vessels the minimum lumen diameter variation resulted in the highest variation of FFRCT, followed closely by the resistance value, while in the third vessel the opposite was true with resistance responsible for the highest variation in FFRCT followed by the minimum lumen diameter [19]. This was later confirmed by Agujetas et al who investigated the effects of single pixel variation in the geometry of an idealised coronary artery with a highly eccentric stenosis and showed significant errors in the calculated FFR [20]. While both geometry and boundary conditions seem to impact the final results in coronary FFR and warrant further investigation for the broader applications in other vessels, solely the investigation of boundary condition variations is the intended purpose of this study.
In CFD codes different types of boundary conditions can be defined and the advantages of one over the other are problem-dependent and not always immediately apparent. Another constraining factor is that boundary conditions need to be well defined and often particular numerical values need to be known. In order to achieve meaningful results modelling approaches need to be adapted depending on the data availability and the location of the vessels of interest. In their approach Taylor et al [18] took advantage of allometric scaling laws in order to determine myocardial flow as a function of the myocardial mass. This enables estimation of boundary conditions through using image data, since myocardial volume can be measured and used to estimate myocardial mass. From that, myocardial flow can also be approximated, and the expected distribution for each coronary can be calculated based on Murray's law [18]. Appropriate boundary conditions can then be picked based on these flow estimations and brachial artery pressure measurement [18].
Research that focuses on the other vulnerable areas mentioned above, however, is limited despite the great potential it can offer. Feasibility of computationally derived pressure gradients was demonstrated for iliac artery stenosis by Heinen et al [21], however their approach was limited to 2D simulations of small segments of vessels, which do not include 3D flow effects and geometries with bifurcations. The scarcity of research in this field is perhaps due to the difficulties associated with choosing the optimal boundary conditions or parameters. For example, the same approach of using allometric scaling laws cannot be directly translated from the coronary to the iliac arteries, since the outlet boundary of an iliac artery model does not end in a single muscle mass whose volume can be measured, but rather coincides with further downstream vessel structures. In turn this makes it more difficult to determine resistance values as in the approach used by Taylor et al [18]. Nevertheless, there have been studies that have adopted a similar approach. In one of the first studies to investigate FFR in the peripheral vessels, Ward et al used CT scans to reconstruct a 3D model of the aorta, renal, mesenteric and iliac arteries and used a modification Murray's law to estimate resistance distribution at each outlet [22]. In their study inlet boundary conditions were estimated based on cardiac output [22]. Changing the boundary condition type to take advantage of other data that may be available is also not trivial. For example, in their study Vignon-Clementel et al [23] demonstrated on a simplified model of an iliac artery bifurcation that using constant pressure boundary conditions produces significantly different distribution of flow in both arteries compared to an impedance type boundary condition. In addition, while patient-specific modelling is seen as the ultimate approach to obtain the most accurate results, it also has the disadvantage on relying on patient specific data. However, often not all patient-specific data required to derive these boundary conditions is available. This may be due to insufficient time to make these measurements, lack of appropriate equipment or due to measurement inaccuracies [24]. In such scenarios the use of generalised data and boundary conditions becomes beneficial, since it can offer the benefits of non-invasively derived haemodynamic data to patients who may not otherwise be able to take advantage of these new techniques, despite the reduction in accuracy.
Nevertheless, CFD analysis is an extremely useful tool that can be performed for a wide range of vessels extending its applications to vessels where conventional catheterisation may not be viable. This includes vessels that may be too small, difficult to access or are not healthy enough for safe catheterisation. In addition, CFD can enable a fully objective, non-invasive vascular imaging-derived diagnosis and eliminate the subjective aspect of making a diagnosis based on invasive arteriographic data where for example an operator might be tempted to stent segments of disease that may not be the culprit of symptoms. Having non-invasive vascular imaging presented in a multidisciplinary team meeting also engenders exploration of all viable alternative strategies and improves clinical governance for consensus based decisions. Furthermore, CFD results can provide a much wider spectrum of data beyond pressure, such as velocity fields and derived quantities such as wall shear stress (WSS), oscillatory shear index (OSI) etc., which can be useful not only in diagnosing already diseased vessels but also as predictors of possible locations where disease may develop. Some authors have suggested, for example, that regions exhibiting low wall shear stress can be identified as having the potential for aneurysm development and rupture [25]. Regions of low WSS are also associated with the formation of plaque accumulations that lead to stenosis [26].
The main purpose of this study was to investigate the CFD techniques for deriving realistic pressure fields on patient specific models of the iliac arteries. The paper outlines some of the numerical techniques used for obtaining a computational hemodynamic solution of a patient specific model of the aorta and both iliac arteries in the presence of stenosis in one of the iliac branch arteries. Different types of boundary conditions are tested and their performance is evaluated in comparison to in-vivo measured values from 4D flow MRI and invasive catheter measurements.
2 METHODOLOGY
2.1 Image acquisition and processing
Contrast-enhanced magnetic resonance angiography scan (CE-MRA) was acquired on a 3T Siemens Prisma scanner (Siemens Healthineers, Erlangen, Germany, Gadovist contrast agent, Bayer AG, Berlin, Germany). CE-MRA parameters were acquired with an output spatial resolution of 1.3 × 1.3 × 1.3 mm in an acquisition time of 17 seconds. 3D Phase-contrast magnetic resonance imaging (4D Flow MRI) was acquired using a research sequence (785AK, from Siemens) with a spatial resolution of 1.5 × 1.5 × 1.5 mm, VENC setting of 115 cm/s and 20 cardiac phases. Retrospective ECG gating was used and the total acquisition time was 12 minutes.
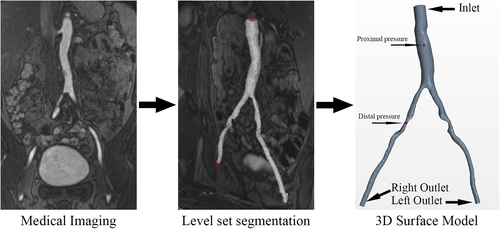
The morphological 3D geometry of the abdominal aorta and both iliac arteries were reconstructed form the CE-MRA data using a semi-automated level-set segmentation algorithm guided by markers applied at each vessel end followed by a marching cubes algorithm for converting the level-sets into a surface model. These operations were performed using the Vascular Modelling Toolkit (www.vmtk.org). In the process level-sets for each vessel were generated individually by placing markers at the aorta and the corresponding iliac artery and using the “colliding fronts” method, guided by a manually selected image intensity threshold. The resulting surface model was clipped at each end, cylindrical flow extensions were added and flat caps were added normal to the extension centrelines. The final surface model was saved in standard stereolithography file format (.STL) before it was imported into the CFD software. The stenosis severity in the right iliac artery (appearing on the left hand side in Figure 1) was 77% area reduction (>50% focal diameter reduction) in its narrowest section. Due to the length of the stenosis and its proximity to the iliac artery bifurcation the healthy cross-sectional area was assumed to be the same as the healthy cross sectional area of the left iliac artery. In addition another focal narrowing of much smaller length can be seen in the left iliac artery (appearing on the right hand side in Figure 1), with the throat being roughly at the same distance away from the bifurcation as the narrowest section in the right artery.
2.2 Meshing
Three successively finer meshes were generated to test if the solution is grid independent. Details about the three grids are shown in Table 1. In order to examine and quantify whether the solution was mesh independent, the grid convergence index (GCI) was calculated as proposed by Roache [27]. The grid convergence index is a measure of how close the computational solution is to the asymptotic solution, a small value of GCI meaning that the solution is within that range. The method takes into account the non-equal grid refinement of the three meshes. The higher order estimate of the asymptotic solution is obtained using Richardson extrapolation. Grid sizes, refinement ratios, values of interest and computational cost for each mesh are summarised in Table 2. Finally, the resulting order of convergence, GCIs and asymptotic solutions are presented in Table 3. Taking into account the computational expense for each mesh and their respective level of accuracy, mesh M1 was used for all subsequent simulations.
| Mesh | Base size [mm] | No. Cells | No. Prism layers | Wall distance y [mm] |
|---|---|---|---|---|
| M1 | 1.00 | 743,385 | 7 | 0.0045 |
| M2 | 0.75 | 1,361,511 | 10 | 0.0043 |
| M3 | 0.50 | 2,374,316 | 12 | 0.0026 |
| Mesh | Mesh size [No. Cells] | Refinement ratio r | Pd [mmHg] | Pp [mmHg] | CPU time [core-hours] |
|---|---|---|---|---|---|
| M1 (Coarse) | 743,385 | 124.1 | 135.8 | 137 | |
| M2 (Medium) | 1,361,511 | 1.22 | 124.3 | 135.9 | 380 |
| M3 (Fine) | 2,374,316 | 1.20 | 124.4 | 136.1 | 1531 |
| Order of convergence p | GCI12 [%] | GCI23 [%] | rpGCI12/GCI23 | Asymptotic Solution for Pd [mmHg] | Asymptotic Solution for Pp [mmHg] |
|---|---|---|---|---|---|
| 3.581 | 0.1067 | 0.1899 | 0.8902 | 124.5 | 135.7 |
2.3 Fluid and vessel properties
It is well known that due to its complex composition blood exhibits viscoelastic and shear-thinning behaviour. In practice this behaviour is mainly observed in low shear rate flow conditions and in small arteries [28]. In large arteries, however, it can be approximated that blood exhibits incompressible Newtonian behaviour with a constant dynamic viscosity of 4 mPas and density of 1060 kg/m3 [28-30], therefore this assumption was used for all simulations presented in this paper.
2.4 Numerical methods
Equation (3) is the continuity equation. While the Reynolds number (Re) in most small vessels is sufficiently low to guarantee laminar flow, transitional and turbulent flow behaviours can be observed in larger arteries such as the aorta where Re can be in the range from 2000 to 4000. In our simulations Re in the aorta is 660, however this increases to 1300 (or 5500 if the original reference diameter is used) in the region of the stenosis. In addition, flow separation can be caused by the jet flow observed after a stenosis. Furthermore, multi-centre CFD studies have shown that for simple flows where the throat Re is between 3500 and 6500 results from laminar simulations do not agree with experimental data in the regions downstream of the throat [31]. This makes the laminar flow assumption invalid and requires an appropriate turbulence modelling approach to be used. In this study the unsteady Reynolds Averaged Navier–Stokes Equations (URANS) equations, as shown in (4), coupled with the two-equation k-ω SST turbulence model of Menter [32] was used for turbulence modelling. This version of the k-ω was chosen over the standard k-ω formulation of Wilcox [33] which has been used extensively in previous studies [30, 34-36] and has shown good performance in predicting velocity profiles, pressure and turbulence intensity. Nevertheless, Menter suggested the Shear Stress Transport (SST) formation of the k-ω model which takes the “best of both worlds” approach by using a blending function for transitioning between the standard k-ω near in the sublayer and logarithmic part of the boundary layer and will be gradually switched, to the k-ɛ model which has shown better performance in the free shear part of the flow (freestream) [32]. The SST version of the Menter's model also utilises a turbulence viscosity limiter which makes the model significantly more accurate in flows where an adverse pressure gradient is present (eg, recirculation area after a stenosis), and has superior performance in predicting the wall shear stress [32].
2.5 Boundary conditions
Naturally when reconstructing the patient specific model of the blood vessels, only a tiny part of the circulatory systems is represented in the 3D domain while all smaller vessels in the volume of interest as well as all vessels outside of it are excluded from the segmentation. On the one hand this truncation is necessary due to the limited resolution of the image data making it difficult to accurately reconstruct smaller vessels and, on the other hand, because modelling the entire human circulatory system will require an inconceivable amount of computational power which is not readily available to most researchers. Because of that the system becomes sensitive to applying appropriate boundary conditions to the inlet and outlet boundaries in order to take into account the parts of the circulatory system not included in the 3D domain. The right choice of boundary conditions, therefore, is crucial for obtaining accurate predictions of flow behaviour in the vessels. Ideally that would constitute prescribing known, patient-specific numerical values that best represent the real flow conditions. This, however, is not always possible since flow rates and/or pressures waveforms are not always known. This makes it necessary to find alternative ways of prescribing boundary conditions that would lead to realistic flow calculations, which is not trivial. Investigating the effects of different boundary conditions and validating them against patient specific data has been the main focus of this study. A description of the different boundary conditions used in this work is presented in the sections below. Furthermore, the model names, boundary condition types, parameter values and fluid model used for each simulation are summarised in Table 4.
| Model | BC Type | Stenosed BC | Healthy BC | Pinitial [mmHg] | Rea |
|---|---|---|---|---|---|
| Resistance [Nsm−5 × 10⁸] | Resistance [Nms−5 × 10⁸] | ||||
| A1 | Windkessel | R = 12 | R = 12 | 0 | 660 |
| A2 | Windkessel | R = 13 | R = 13 | 0 | 660 |
| A3 | Windkessel | R = 14 | R = 14 | 0 | 660 |
| A4 | Windkessel | R = 15 | R = 15 | 0 | 660 |
| B1 | Windkessel | R = 12 | R = 15 | 0 | 660 |
| B2 | Windkessel | R = 13 | R = 15 | 0 | 660 |
| B3 | Windkessel | R = 14 | R = 15 | 0 | 660 |
| B4 | Windkessel | R = 13 | R = 12 | 0 | 660 |
| B5 | Windkessel | R = 14 | R = 12 | 0 | 660 |
| B6 | Windkessel | R = 15 | R = 12 | 0 | 660 |
| C1 | Flow Split | 38.3 [%] | 61.7 [%] | 120 | 660 |
| C2 | Flow Split | 38.3 [%] | 61.7 [%] | 130 | 660 |
| D1 | Constant Pressure | 130 [mmHg] | 130 [mmHg] | 0 | 660 |
| D2 | Constant Pressure | 128 [mmHg] | 137 [mmHg] | 0 | 660 |
- a Re is calculated using the average velocity at the inlet and the inlet diameter as a reference length.
2.5.1 Inlet boundary condition
At the inlet boundary, located at the abdominal aorta cap of the model as shown in Figure 1, a steady, bulk mass flow rate boundary condition was used. The value was based on the systolic patient specific volume flow rate measurement of 25.8 mL/s obtained from the 4D flow MRI scan, multiplied by the density. Systolic values were selected since the represent the maximum flow conditions where the biggest pressure drop can be expected.
2.5.2 Constant pressure outlet boundary conditions
One of the standard types of boundary conditions used in CFD modelling of internal flows is prescribing a pressure outlet boundary condition. This is relatively easy to do for industrial applications where the conditions at the outlet are known, can be easily measured or can be accurately approximated. In the framework of blood flow modelling, however, this is not so easy to achieve as knowing the exact pressure in a blood vessel requires invasive measurements, which are not taken routinely, and generally defeats the purpose of non-invasive pressure prediction techniques. Since in this case the approximate pressures are known, two simulations were performed with this type of boundary condition in order to evaluate its performance out with the discussed limitations. As described in Table 4, model D1 uses a constant pressure boundary condition that is equal for the stenosed and healthy outlets and has a value of 130 mmHg, equivalent to roughly the average of pressures measured distal and proximal to the stenosis. Model D2 on the other hand prescribes different pressure values to each outlet, 128 and 137 mmHg at the stenosed and healthy vessel boundary respectively, reflecting the measured pressure drop.
2.5.3 Flow split outlet boundary condition
Another classical approach for prescribing boundary conditions for internal flows with multiple outlets is to use the flows split outlet type boundary condition. This formulation allows for a specific outflow rate to be prescribed at each outlet boundary, or alternatively for the outlet flow to be defined as a percentage of the total flow going out of the system. The latter approach was used in this study with flow split defined as 38.3% out of the vessel with stenosis and 61.7% out of the healthy vessel, as measured by 4D flow MRI. Prescribing a flow split boundary condition enables the solver to calculate the relative pressure distribution and therefore pressure drop in the 3D domain. The overall pressure magnitude, however, is not automatically evaluated and becomes a function of the obtained pressure drop and the initial conditions. Therefore, similarity to the constant pressure boundary conditions, this approach has the limitation that some sort of pressure value must be known or assumed. To test the viability of this approach, models C1 and C2 were defined using the flow split values mentioned above. The pressure field in the 3D domain was then initialised to a value of 120 and 130 mmHg respectively, the former representing the “standard” average systolic blood pressure in the vessels, while the latter representing the catheter measured average blood patient specific pressure.
2.5.4 Resistance outlet boundary conditions
2.5.5 Two-element Windkessel model for outlet boundary condition
2.6 Validation
For validation purposes, the patient's blood pressure was invasively measured using a catheter before the stenosis was stented at the Queen Elizabeth University Hospital, Glasgow, UK. Measurements were taken at different points in the aorta and in both iliac arteries. No vasodilators was administered prior to taking the measurements in order to ensure that the flow conditions were similar to those during the 4D flow scan in order to allow for a reasonable comparison. The catheter measured peak pressure drop, proximal pressure and distal pressure were 9, 137 and 128 mmHg, resulting in FFR = 0.93.
3 RESULTS AND DISCUSSION
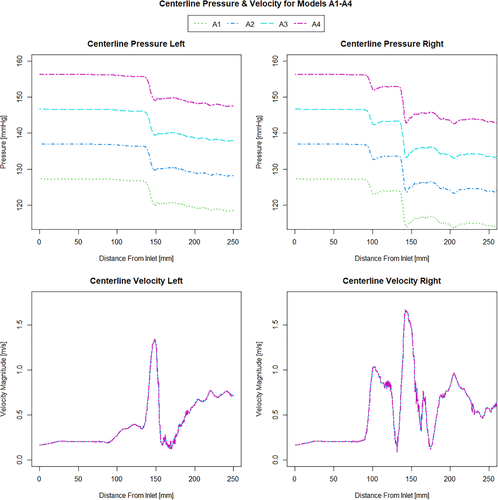
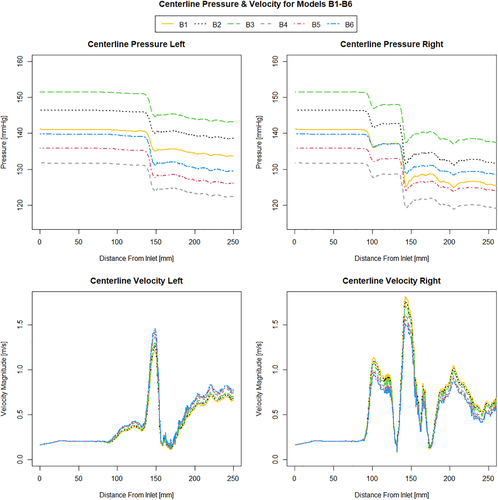
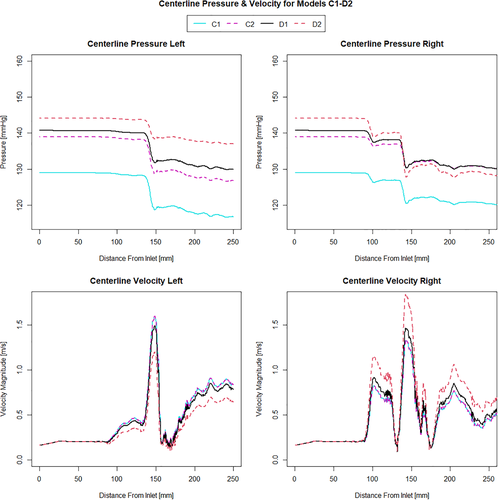
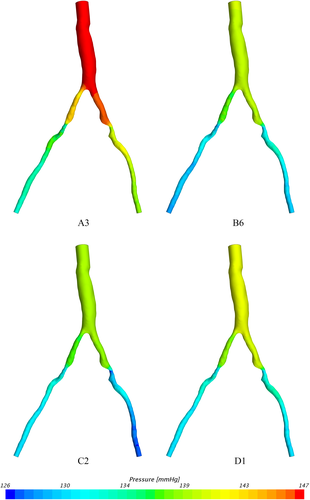
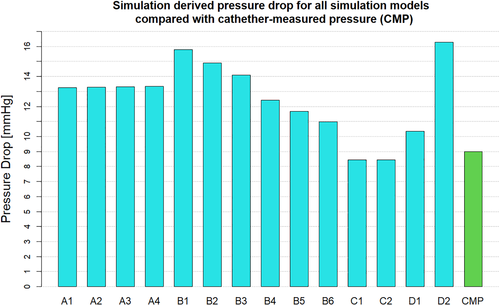
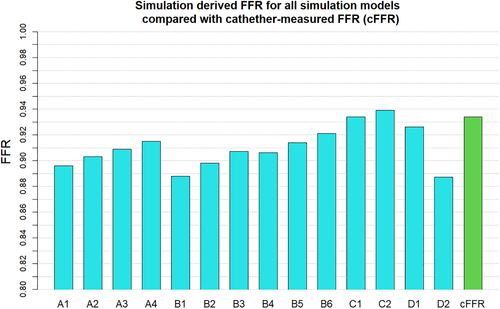
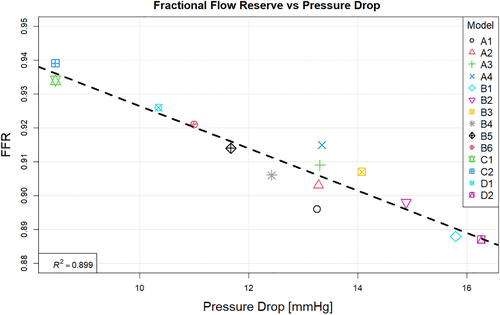
When investigating which model best represents the flow conditions in the vessel it is important to consider multiple flow variables. The computationally derived centreline pressure and velocity for the simulations using the Windkessel model with equal resistance values on both the outlets (Figure 2) are compared with the simulations using the Windkessel model with different resistances for the outlets of the stenosed and healthier vessel (Figure 3) and those using the constant pressure and flow split outlet boundary conditions (Figure 4). Wall pressure distribution is shown in Figure 5 for selected models of each boundary condition group. Furthermore, a summary of the pressure drop for each model and the pressure drop measured via catheter are presented in Figure 6. Similarly, Figure 7 summarises the FFR from each computational model and compares it to the in-vivo data. Finally, Figure 8 shows the correlation between the pressure drop and FFR obtained from the simulations.
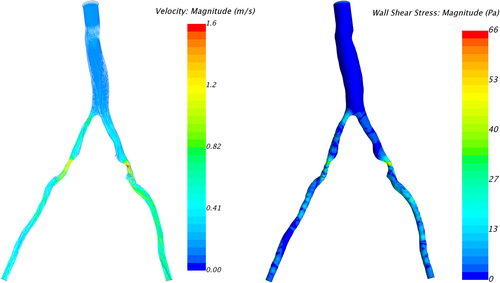
In order to gain better overall understanding of the flow conditions, the velocity streamlines and wall shear stress distribution for model C2 are presented in Figure 9.
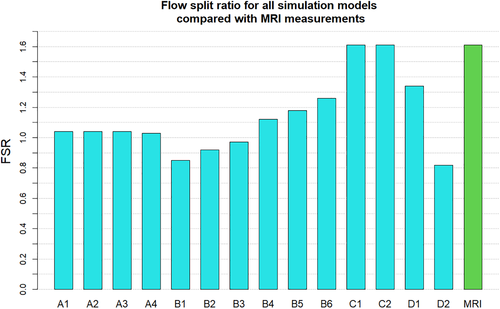
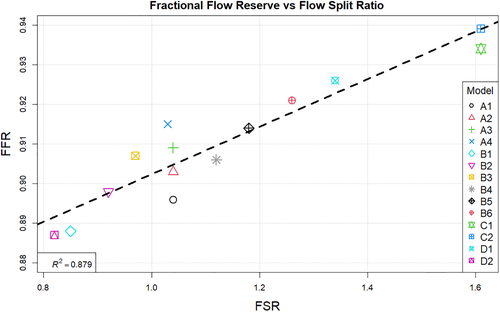
The FSR for all simulations is plotted and compared to the 4D flow measurements in Figure 10. In addition the fractional flow reserve change with flow split ration is shown in Figure 11.
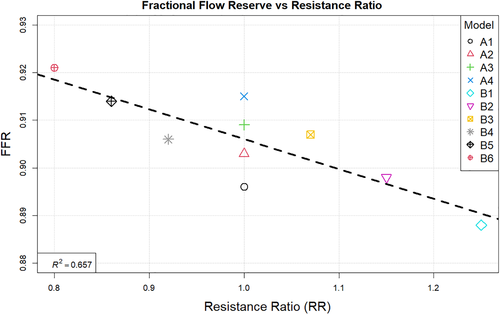
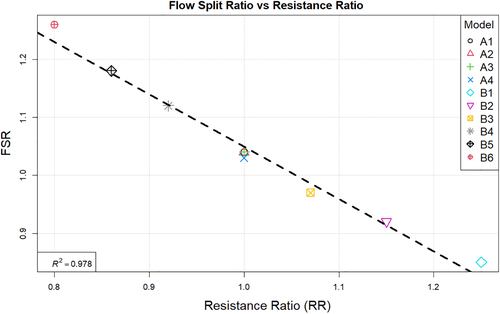
The correlation between the fractional flow reserve and resistance ratio is shown in Figure 12. Finally Figure 13 summarises the relation between resistance ratio and flow split ratio.
3.1 Pressure
Looking at Figure 2 it can be seen that increasing the resistance magnitude consistently increases the mean pressure in the 3D domain by approximately 10 mmHg per 1 Nsm−5 × 10⁸ increment resistance increase, while the overall pressure profile for simulations A1-A4 remains identical along the length of the vessel. This observation is additionally confirmed by the fact that pressure drop for these models А1-А4 remains constant for all four of them as seen in Figure 6. In turn, the combination of higher pressure values and equal pressure drop results in a gradually increasing value of FFR as seen in Figure 7. Models B1-B3 where the resistance is kept constant and with higher value at the healthy vessel outlet while the resistance on the stenosed vessel outlet is gradually increased, results in a gradual decrease in pressure drop as the difference between the two resistances becomes smaller. In all the three models (B1-B3), however, the pressure drop is still larger than that which is observed in the equal resistance models (A1-A4). It can be noted that the pressure profile in models B1-B3 remains somewhat similar in shape but is different for each simulation in terms of the magnitude of the pressure changes. Furthermore it can be noted that increasing the resistance at the stenosed vessel outlet also affects the pressure further upstream and along the healthy vessel.
Although at a smaller rate of 6 mmHg/Nsm−5 × 108, an incremental increase in the resistance on the stenosed vessel outlet still results in a linear increase of mean pressure in the domain. Once again FFR values increase with higher resistance and pressure values. Models B4-B6 exhibit similar behaviour, with an even lower linear rate of increase of mean pressure in the domain of 4.5 mmHg/Nsm−5 × 108. Again, changing the resistance on the outlet of the stenosed vessel affects the overall pressure distribution in all parts of the domain, and leads to an increase in FFR. Furthermore, in all of the models B1-B6, increasing the resistance on the stenosed vessel outlet results in a relative reduction of pressure in the healthy vessel compared to the stenosed vessel. Comparing these results to models C1 and C2, where the flow split boundary condition was used, it is immediately apparent that the two types of boundary conditions produce dramatically different results in terms of pressure drop. While the pressure profile in the two cases is identical except a variation in the mean pressure, similar to models A1-B4, in models C1 and C2 this is caused by the different initial conditions rather than a change in the boundary conditions. Furthermore, the resulting pressure field obtained from the latter is in stark contrast to any of the other models since the predicted pressure drop is in fact higher in the healthy vessel than it is in the stenosed vessel. As a consequence models C1 and C2 also have the highest FFR values out of all simulations, as seen in Figure 7.
Finally looking at models D1 and D2 we can see that they differ from each other in terms of the pressure profile along the vessels centreline, the overall pressure drop and therefore also in the predicted FFR values. While model D1 shows a significant pressure drop and somewhat similar distribution in both iliac arteries, model D2 results in a dramatic pressure drop in the stenosed iliac artery, a relatively lower pressure drop in the healthy artery and significant differences in the pressure distribution in the two arteries. This is the consequence of prescribing a constant value boundary condition that is not dependent on any other variable in the 3D domain, thus “forcing” the pressure field to take a form that satisfies the pressure constraint at both boundaries. Comparing these two models with all other simulations in terms of pressure distribution, we see that the results produced by D1 have the most similarity with model B6, while model D2 resembles the results of B1. The pressure drop of 16.3 mmHg in model D2 is similar than the pressure drop of 15.6 mmHg in model B1, however both being significantly higher that the catheter-measured value of 9 mmHg. This also results in the significant underestimation of FFR in both models. On the other hand, the pressure drop of 10.3 mmHg in model D1 is relatively close to that of 11 mmHg in model B6 and both are much closer to the in-vivo value and in turn to a much better FFR estimate. Nevertheless, the closest pressure drop estimation comes from models C1 and C2, both producing a ΔP of 8.5 mmHg, followed by model D1 which results in 10.3 mmHg drop in pressure. Furthermore, the best FFR result is found by model C1 which is in perfect agreement with the FFR = 0.934 calculated from catheter pressure measurements. The correlation between FFR and pressure drop is presented in Figure 8. As it might be expected FFR is inversely proportional to the drop in pressure, and the results show good, almost linear correlation with an R2 = 0.899. The most notable exception to this, as previously mentioned, is the change in FFR in models A1-A4 due to the little change in pressure drop compared to the change in absolute pressure in the domain. Finally, a visual overview of the pressure distribution on the vessel wall is presented in Figure 5 for a selection of models from each boundary condition type. These have been chosen on the basis of having pressures in the same range for easier visualisation rather than how well they represent in-vivo data.
3.2 Velocity, mass flow rate and wall shear stress
Observing the centreline velocity plots for models A1-A4 in Figure 2 it is apparent that there is no difference in the velocity field which is also confirmed by the negligible change in FSR seen in Figure 10. These results are consistent with the pressure fields which show no change in pressure drop as discussed above. Conversely in models B1-B6 there is an apparent shift in the flow distribution with changing resistance values and ratios. The peak velocity in B1 is 1.8 m/s and can be observed at the narrowest section of the stenosed iliac artery. As seen in Figure 13, as the resistance ratio increases, the flow split ratio gradually decreases, resulting in a slight decrease in the velocity in the right artery complemented by a slight increase in velocity in the left artery. Furthermore, looking at Figures 10 and 13 it becomes apparent that for cases where RR > 1 more flow is going through the vessel with a stenosis than the healthy vessel, which is not physiologically realistic and easily confirmed to be incorrect by the 4D Flow data. For RR ≥ 1 the physiologically realistic flow split is restored and starts approaching the measured values as RR grows, resulting in model B6 having FSR closest to the actual value among models B1-B6. Since the pressure boundary condition calculated from the Windkessel model is proportional to the magnitude of the resistance, it might be tempting to assign a higher resistance value to the healthy vessel outlet, where the pressure can generally be expected to be higher. This observation, however, leads to the important conclusion that the pressure increasing effects of any such increase of resistance on the healthy side are negated by the resulting flow distribution. In that sense, applying the assumption that the flow will experience higher resistance in the diseased vessel not only due to the stenosis which is included in the 3D domain, but also due to the downstream vasculature, yields more accurate results for both pressure and flow split. A similar result can be seen in Figure 10 for models D1 and D2. In the latter case where a higher constant pressure is applied on the healthy vessel the FSR drops well below unity to a much lower value than any of the other models. In this configuration the flow becomes pressure-driven and the blood is forced out of the stenosed vessel due to the adverse pressure gradient. This is particularly well accentuated in model D2 since the pressure is directly prescribed at the outlet, while in the models using the Windkessel boundary condition, the pressure and flow rate at each outlet are iteratively adjusted until an equilibrium is reached for the given parameters. For case D1 a realistic FSR > 1 is restored, since equal pressure is used at both outlets which allows for the pressure to be distributed solely based on the 3D geometry, which allows blood to flow more freely through the wider healthy vessel. Unsurprisingly, models C1 and C2 yield flow split ratio that matches exactly the MRI data since this is dictated by the boundary conditions. The correlation between FFR and FSR is further illustrated in Figure 11, where it can be seen that once again there is a linear variation in FFR with changing FSR with a R2 = 0.879. Furthermore we can observe that a realistic FSR > 1 also positively affects the FFR prediction as the results in these models are much closer to the in-vivo measured data. Finally the correlation between flow split ratio and resistance ratio is shown in Figure 13. The results show good linear relation between the two parameters with an R2 = 0.978, showing that the flow distribution can be directly associated with the resistance parameter. These results also emphasise an important point that while a correct flow distribution is not a sufficient conditions for determining whether the simulations derived pressure drop and vFFR are accurate, it is certainly a necessary condition. This can be most clearly seen in cases with FSR < 1 (ie, B1, B2, B3 and D2), where non-coincidentally also the highest pressure drops are observed. While at first glance this result might seem plausible it is clearly an overestimation. This is caused by the fact that more flow is forced through the diseased vessel, resulting in a higher peak velocities at the narrowest section of the stenosis, which in turn leads to an overestimation of the pressure drop. Resistances should, therefore be assigned with care, since our results clearly show that the approach of applying different resistance parameters to each outlet can lead to better results if assigned correctly as well as significantly degrade the results if used incorrectly.
4 CONCLUSION
The computational accuracy of hemodynamic CFD simulations is highly dependent on the boundary conditions used. Different types of boundary conditions and parameters were tested and the results were compared to patient specific in-vivo measurements. The study shows that some types of boundary conditions such as constant pressure boundary condition are inappropriate since they have the tendency of producing unrealistic results. Prescribing equal constant pressure on both outlets results in an underestimation of pressure drop and flow split ratio, while prescribing different pressures on each outlet can result in severe overestimation of the pressure drop and physiologically inaccurate flow behaviour. In addition this type of boundary condition relies on either generalised assumptions or prior knowledge of the patient's blood pressure. The flow split boundary conditions show good agreement in terms of flow distribution, and also shows good agreement in predicting pressure drop and FFR. Similar to the constant pressure boundary condition, this is achieved by utilising available patient specific flow and pressure data. While using the 4D flow MRI data perfectly aligns with the idea of obtaining non-invasive FFR, these simulations also relied on pressure filed initialisation based on generic blood pressure assumption (C1) and invasively measured patient specific pressure (C2). Although the best results are obtained from model C1 where “standard” systolic blood pressure was assumed, the lack of further patient cases prevents us from drawing any conclusions whether the good results were achieved because this is the best modelling approach or as a coincidence related to this particular case. Out of the presented cases, the Windkessel model has shown the most promising results in its ability to provide a good representation of both pressure drop and flow split ratio while using minimal patient specific data or assumptions. This type of boundary condition relies on appropriate resistance values, which in our case were estimated using prior knowledge of the patient's blood pressure. Nevertheless, when using a Windkessel model neither pressure nor flow distribution is directly prescribed to any of the boundaries. Therefore, while the correct choice of parameter does have an effect on the results, this is not as direct as with the other types of boundary conditions, resulting in a system that is in a way self-adjusting, and therefore reducing the impact of any of the assumptions on the final result. Wall shear stress is also affected in the same way as the flow distribution, and although no validation data is available in this study, it can be expected that the most accurate prediction of the WSS distribution is also achieved in the models that best depict the flow distribution.
Although these results are promising, they do have their limitations. As mentioned above, the parameters used for the Windkessel model, for example, were determined via calculations based on in-vivo patient-specific data that is not always available, which significantly limits the usefulness of the findings in this study if applied to other patient specific geometries. Similarly, the flow split boundary condition and the constant pressure boundary condition rely on either assumptions or in-vivo data. A desirable outcome of future studies would be to find a robust way of correlating available non-invasive patient-specific data with the model parameters. While flow rates can be measured non-invasively using MRI, crucially an alternative approach is needed to estimate pressure values for initial conditions and/or resistance calculations. As discussed above, the standard go-to non-invasive test for peripheral artery disease is the ankle-brachial index (ABI) [11]. Not without its own limitations, it provides a direction to establishing a protocol that could solve the problem. This can be done by working with a larger cohort of patients and establishing a robust approach that correlates non-invasive pressures with those in the peripheral vessels: brachial, ankle or even thigh cuff pressures for example can be used to estimate the pressure in the aorta or the iliac/femoral arteries.
An additional limitation of the current study is that the flow is assumed to be steady which is a simplification of the actual conditions in the circulatory system. Therefore, it is necessary to further examine the behaviour of these, and other models, in a pulsatile flow environment and observe additional transient flow properties. Furthermore, the conventional definition of FFR in the coronaries implies that pressure measurements should be obtained in hyperaemic flow conditions, due to the fact that the downstream resistances can only be considered constant in this flow regime. It is to be determined whether this is true for larger arteries in the abdominal and leg area and how much effect this assumption can have on the final results. In this study we have analysed resting conditions as the goal was use patient specific flow rates from MRI which were naturally obtained with the patient lying supine and resting in the MRI system. The in-vivo pressures measured for validation were also taken while the patient was at rest to allow for a realistic comparison. While hyperaemia can be induced in the angiography lab using medication (eg, with papaverine or nitrate infusion) this is only done when resting pressures are normal or equivocal. On the other hand, inducing hyperaemia in the MRI suite would be more challenging but could be achieved through exercise or using rebound hyperaemia after a period of relative rest following tourniquet application, however the latter might be physiologically different from exercise induced hyperaemia. This problem could be the focus of future research. Finally, although the Newtonian behaviour of blood might be a reasonable assumption for some situations, the complex flow in a model that has both very large vessels and very narrow sections due to the stenosis might make this approximation inaccurate. Further evaluation of how a non-Newtonian blood model might affect the computational results might be advantageous.
As a result of the limitations and considerations of each boundary condition model presented above, as well as the study limitations, we can conclude that both the flow split and Windkessel boundary conditions offer promising results and can be useful in particular scenarios, while the constant pressure boundary condition provides the worst results. The best results overall are offered by the flow split boundary condition, which only shows small variations depending on the initial conditions. However, further studies need to be carried out to establish it sensibility on the flow split percentage. It is also unknown if this approach would be more difficult to scale to a larger cohort of patients or in models with more outlets. In that sense, the second best option presented in this study, the Windkessel model, should not be completely disregarded as it may still have a good application in some scenarios. Since the resistance parameter, for example, does not affect the results as directly as the parameters in the other boundary conditions and have some flow balancing effect, a generic set of Windkessel parameters averaged over a larger cohort can produce meaningful results, despite the reduction in accuracy compared to fully patient-specific values as shown in some studies on FFRCT [6, 40-42]. Resistances can potentially be estimated using form-function relationships such as Murray's law, and the method applied to cases where there might not be enough patient-specific data to apply other boundary conditions, thus providing results for patients who might not otherwise be able to get the non-invasive diagnosis. Ultimately, while this needs to be proven in a larger study, both approaches remain useful tools in our toolkit that can be used depending on available data and with a clear understanding of their individual limitations.
ACKNOWLEDGEMENTS
This work is kindly funded by Medical Research Scotland (grant PhD-888-2015) and Canon Medical Research Europe Ltd. The authors would like to thank Dr Peter Douglas for his help in obtaining the in-vivo pressure measurements. Computational results were obtained using ARCHIE-WeSt High Performance Computer (www.archie-west.ac.uk).


