Adsorption of Biogenic Amines from Synthetic and Real Wastewater using a Zwitterion-Functionalized Blast Furnace Slag
Abstract
Blast furnace slag functionalized with sulfamic acid (zwitterion) shows an extraordinary potential for the removal of biogenic amines from spiked water and real wastewater samples. The functionalized slag is characterized using scanning electron microscopy-energy dispersive spectroscopy (SEM/EDS), Fourier transform infrared spectroscopy (FTIR), and acid site density test. Its performance toward the removal of selected biogenic amines (putrescine, tyramine, and 2-phenylethylamine) is evaluated at different experimental conditions that include pH, contact time, adsorbent dosage, and initial concentration. The central composite experimental design is employed in investigating the effect of these individual factors and their interactions. The adsorption experiment results fit both the Langmuir isotherm model and pseudo-second-order kinetic model based on the computed high coefficient of determination (R2) values. Maximum adsorption capacity values of 80.64 mg g−1 for 2-phenylethylamine, 12.5 mg g−1 for putrescine, and 64.52 mg g−1 for tyramine are estimated from the Langmuir isotherm model. Hydrogen bonding interaction between the S═O groups of the functionalized slag and protonated amino groups of biogenic amines is speculated as the possible mechanism of adsorption. The prepared functionalized slag also exhibits good adsorptive removal of biogenic amines in a date palm fruit processing industrial wastewater sample.
1 Introduction
The pervasive nature of biogenic amines (BAs) formation in fermented food products and their potential toxicity to humans has led to their extensive investigation in recent years.[1-3] BAs are simple base low molecular weight nitrogenous compounds formed in food products such as dairy product, meat, fish, fruit juice, and wine during microbial degradation of amino acid.[4] Typically, BAs accumulation in these food products were reported in a concentration range of few mg L−1 to 2000 mg L−1 depending on the food conditions.[5-7]
BAs accumulation in foods and their intake by humans have been correlated with cases of food poisoning involving allergic symptoms such as psychoactive, vasoactive, and gastrointestinal symptoms.[8-11] Moreover, reports have shown that excessive BAs consumption by humans of more than 40 mg per meal can lead to an elevated risk of food poisoning.[12] The important BAs implicated in food poisoning are histamine (HIS), putrescine (PUT), tyramine (TYA), tryptamine (TRY), cadaverine (CAD), and 2-phenylethylamine (PEA). Histamine and tyramine are the two most toxic of these amines and are currently regulated as an essential biomarker for food freshness and quality.[9, 13] In contrast to these two amines, PUT and CAD were shown not to induce toxic response whenever they exist individually, however, their presence in conjunction with HIS and TRY was found to increase the toxicity of the latter by a great magnitude.
Besides the toxicity posed by BAs to humans in food products, there are reports of them impacting unaesthetic conditions to surface water and groundwater whenever they are discharged or formed (food waste or/and animal remains) in these water bodies.[4]
For example, TYA often undergoes a slow degradation rate in surface water, which can lead to its significant accumulation and in the process impacting on oxygen availability to aquatic lives.[4] Hence, this suggests that BAs do not only pose a toxic threat to humans but can also affect water quality in the environment. Food processing industries are among the principal contributors of BAs to the environment, as they generate these amines as part of their wastewater constituents. For example, a concentration >100 mg L−1 for all the biogenic amines was reported for dairy industry wastewater.[14]
The significant water consumption by these food industries often necessitates the adoption of water conservation measures to limit wastewater generation. Hence, for these industries, the reuse of BAs contaminated water can lead to unintended consequences when it is reused without treatment. Furthermore, it was shown that most of the BAs undergo a slow biodegradation process,[15] and as such, the conventional biological treatment process will not suffice for their adequate removal. Considering this limitation, an appropriate treatment method must be selected to abate BAs from such wastewater before reuse or discharge.
Research focus on BAs over the years has been toward their removal, control, and detection in fermented foods products.[16–19] These studies on BAs removal from foods such as wine and dairy products have been geared toward the development of specific adsorbent materials. Different adsorbents such as albumin-modified silica,[20] carbon nanotubes,[21] modified zirconium phosphate,[22] calcium-montmorillonite,[4] crown ether ligands,[23] and sulfonic acid-modified silica,[24] have all been assessed for the removal of BAs from aqueous phase or wines solution as reported in the literature. Moreover, it was observed from the literature search that no study has reported BAs removal from wastewater using a low-cost adsorbent material.
Based on this, our study was focused on the removal of selected BAs from synthetic wastewater (spiked water) and a real BAs contaminated wastewater sourced from a date fruit industry in the Kingdom of Saudi Arabia, using a cheap industrial waste material (blast furnace slag, BFS) as an adsorbent. BFS was chosen as an adsorbent because of its excellent binding ability to aqueous organic pollutants.[25-27] Moreover, as a waste material, it will offset the treatment costs process. Generally, BAs dissociate to positively charged ions in the aqueous phase. Hence, an attempt was made at functionalizing the surface of the slag with a sulfamic acid-aided zwitterion group to further enhance its binding to the positively charged amines.
2 Experimental Section
2.1 Raw Material and Chemicals
All chemical reagents used in this study were of analytical grade (>97%) and were supplied by Sigma-Aldrich (Bellefonte, PA, USA) except otherwise indicated. BFS sourced from an iron processing plant in the Kingdom of Saudi Arabia was modified with sulfamic acid (NH3-SO3) and used as an adsorbent in this study. Three model biogenic amines (tyramine, putrescine, and 2-phenylethylamine) compounds shown in Table S1 in the Supporting Information were selected for the adsorption experiments. A stock solution of the BAs (mixed solution) was prepared from their respective standards. High purity deionized water produced from the Milli-Q system was used in the preparation of stock and working solutions. pH adjustment was performed using 0.1 N solutions of NaOH and HCl.
2.2 Surface Functionalization of Slag with Sulfamic Acid
A simple wet impregnation process was adopted for the slag surface functionalization or modification as discussed as follows. Briefly, 5 g of the collected slag was pre-mixed with 2 g of sulfamic acid and to this 50 mL of deionized water was added to give a mixture of the desired reactants ratios. Afterward, the resulting mixture was sonicated for 15 min and then stirred at a specified temperature of 45 °C and reaction time of 30 min. After that, the final product was filtered, washed thoroughly with deionized water, and dried in an oven at 110 °C for 12 h. The obtained product was named Z-BFS (zwitterion-functionalized blast furnace slag).
2.3 Characterization of Unmodified and Modified Slags
2.4 Analytical Method and Instrumentation
BAs were quantitated using ultra-high-performance liquid chromatography coupled with a Triple Quadrupole Mass Spectrometer LCMS-8050 (Shimadzu). The LCMS-8050 was operated based on the following conditions: The mobile phase was composed of A) 15 × 10−3 m ammonium formate, formic acid in water (pH 3.3), and B) methanol, which was applied at a flow rate of 0.5 mL min−1. The gradient program was: 0 min 30% B, 0–15 min 90% B, 15–20 min 30% B, 20–25 min 30% B. The injection volume was 20 µL. A Phenomenex (Torrance, CA, USA) column Synergi Hydro (250 × 4.0 mm I.D., 5 µm) was used for the separation of the BAs. After each of the adsorption processes, samples were collected and filtered using a 0.2 µm Millipore filter to eliminate the adsorbent particles. Afterward, the filtered samples were transferred into 2 mL vials and analyzed using the LCMS-8050. The detection limit for the biogenic amines in this study was in the range of 0.0075–0.030 µg mL−1 according to the previously developed method.[29]
2.5 Adsorption Experiments
A multicomponent batch adsorption experiment for the three selected BAs was conducted to investigate the adsorption performance of the Z-BFS. At first, the effect of initial pH variation (pH 2 to 10) on the removal of each of the amines in the mixed solution was conducted. For these experiments, 20 mL of 10 mg L−1 mixed solutions of the BAs (0.113 × 10⁻³ m PUT, 0.073 × 10⁻³ m TYA, and 0.082 × 10⁻³ m PEA) was prepared at different pH values (2, 4.78, 6, 8, 10) and to these solutions, 100 mg (5 g L−1) of the Z-BFS was added. The resulting mixtures were agitated on a shaker at 200 rpm for 2 h and thereafter samples were collected, filtered, and analyzed.
In the next stage, an adsorption kinetic study was performed to ascertain the rate-limiting step and minimum time needed to achieve thermodynamic equilibrium for the adsorption process. For this study, 100 mL of initial concentrations of 10 and 20 mg L−1 mixed solutions of the BAs were employed. The prepared solutions were maintained at pH values in the range of 6–7 (optimum pH value), and adsorbent dosage of 500 mg was used. During the agitation process, 2 mL samples were withdrawn from the solutions at a different time (5, 15, 30, 60, 120, 240, 480, 720, 1440 min) and were filtered and analyzed for each of the BAs constituents.
Further, an adsorption isotherm study was conducted to evaluate the adsorption capacity of the BAs by the Z-BFS. For this study, different initial concentrations of the mixed BAs solution ranging from 1 to 20 mg L−1 were investigated. A solution volume of 20 mL was employed, and adsorbent dosage and time were fixed at 100 mg and 2 h, respectively. Moreover, the pH value of the prepared solutions was kept at neutral (≈7) being the optimum.
Furthermore, to investigate the effect of other significant parameters on the removal of the BAs, a central composite experimental design (CCD) based on response surface methodology was adopted for this purpose. CCD, which was an efficient (few experimental runs) statistical experiment design, allowed for the evaluation of the effect of individual factors and their interactions (synergistic) on a studied response. In this study, the chosen factors were the adsorbent amount (A), initial concentration of the BAs (B), and the adsorption time (C), and the responses (Y1, Y2, and Y3) in which the effect of these factors investigated are the percentage removal of each of the BAs. Based on the chosen standard CCD, a total number of 20 experimental trials were created using the statistical software Design Expert V11. The CCD resulted in an experimental run with eight cube points, six axial points, and six replicated center points. The corresponding CCD design matrix showing each of the factors and their levels are presented in Table 1. The selected levels were based on the outcomes of previous adsorption experiments (adsorption kinetic and isotherm studies) conducted for the BAs.
| Factor | Code level | Value of coded levelsa) | ||||
|---|---|---|---|---|---|---|
| a | −1 | 0 | 1 | A | ||
| Adsorbent dosage (g L−1) (A) | X1 | 1 | 2 | 3 | 4 | 5 |
| Initial concentration (mg L−1) (B) | X2 | 1 | 6 | 10.5 | 15 | 20 |
| Contact time (min) (C) | X3 | 30 | 60 | 105 | 150 | 180 |
- a) a: extreme low star point, −1: lower point, 0: centerpoint, 1: upper point, and A: extreme upper star point.
For this expression, βo, βi, βii, βij, represents the constant, linear, square, and interaction coefficients, respectively, while xi and xj denote the factors considered and y is the percent removal of each of the BAs. Analysis of variance tests were performed to evaluate the adequacy of the fitted models and the significance of each of the factors on the studied responses.
Lastly, the prepared Z-BFS was applied for the treatment of real biogenic amines contaminated wastewater sourced from a date palm fruit industry in the Kingdom of Saudi Arabia.
3 Results and Discussion
3.1 Material Characterization
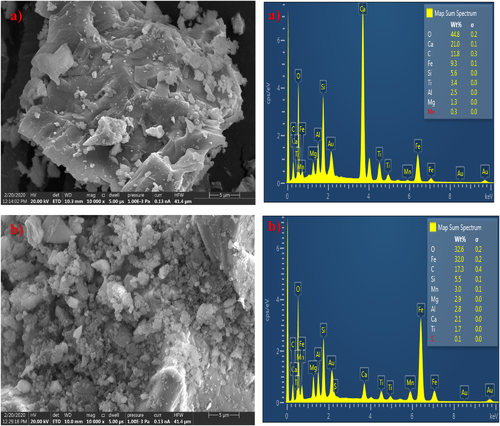
Figure 1A,B shows the surface morphology and the energy dispersive spectroscopy (EDS) surface mapping of the elemental composition of the raw slag and Z-BFS samples as acquired from the SEM-EDS analysis. As shown, the unmodified slag (Figure 1A) exhibits a reasonably smooth surface with no cavity. Moreover, its EDS spectrum shows the presence of oxygen, iron, calcium, and aluminium as the significant elements, which denotes the characteristics of steel slag. In the case of the modified slag (Figure 1A), the appearance of a roughened surface with cavities suggests the interaction of sulfamic acid with the surface during the functionalization process. The acid treatment was able to etch the slag surface via interactions with the identified mineral constituents. Besides, the reduction in the elemental composition of Z-BFS (EDS spectra) when compared with that of the raw slag confirm the above interactions during the modification process.
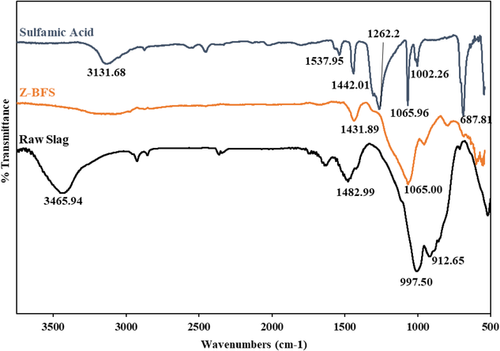
FTIR spectra acquired for sulfamic acid, Z-BFS, and raw slag are presented in Figure 2. In the case of sulfamic acid (SA) and Z-BFS spectra, the peaks at (1442 cm−1, SA) 1432 cm−1 and (1067 cm−1, SA) 1063 cm−1 were assigned to S═O asymmetric and S─O stretching vibrations due to sulfonic groups of sulfamic acid.[28] The appearance of sulfonic groups confirms the successful loading of sulfamic acid on the slag surface. It is worth noting that other reports have ascribed similar bands for sulfamic acid-functionalized materials.[30-33] Besides, the absence of these peaks on the raw slag spectra further confirms the successful functionalization process.
In addition, the XPS analysis performed to confirm the loading of sulfamic acid on the slag surface shows the presence of sulfonic and amino groups. The XPS survey scan and high-resolution spectra are provided in Figure S1 in the Supporting Information. In the high-resolution spectra data, the N 1s spectrum with an asymmetric peak at 403 eV binding energy indicates a single nitrogen environment on the Z-BFS surface that was attributed to the protonated amino group of sulfamic acid (NH3-SO3). The high-resolution S 2p spectrum with a peak at 171 eV binding energy was attributed to the sulfonic group (S═O) of the acid.
The amount of sulfamic acid loaded on the Z-BFS during the functionalization process was estimated by determining the acid sites density of the Z-BFS by weight. The estimation was based on the assumption that all the acidic sites were due to the sulfamic acid treatment and were readily accessible. The acidic sites density of the Z-BFS by the ion exchange titration procedure was found to be 0.167 mmol of H+ g−1.
As illustrated in Figure S2 in the Supporting Information, the functionalized slag exhibits higher uptake of BAs than the raw slag, indicating the loaded zwitterion functional groups played a role in the binding of the BAs to the slag surface.
3.2 Effect of Initial pH on BAs Removal
The result of initial solution pH variation on the BAs removal by the Z-BFS is presented in Figure 3. As illustrated, PEA shows the highest removal by the Z-BFS for all the pH values studied. A constant uptake of >96 and 30% was achieved for PEA and TYA, respectively, for all pH values. However, for PUT, an uptake of 80% was noted as the initial solution pH was raised from 2 to 8, which decreased to 10% at pH 10. These results suggest that PUT in the mixed BAs solution exhibits a pH-dependent removal by the Z-BFS, while PEA and TYA are pH independents. Moreover, for all the pH points investigated, a slight increase in the pH was observed at the end of adsorption (Figure S3, Supporting Information), indicating the hydrolysis of the Z-BFS constituents.
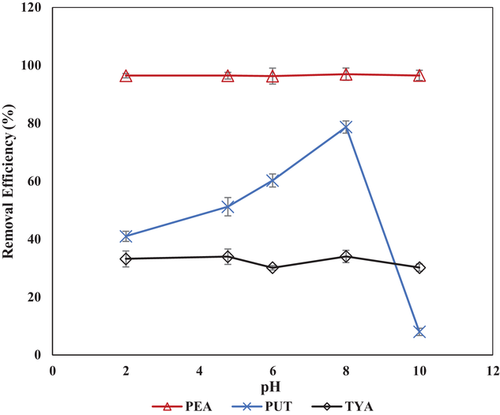
At lower pH values (pH 2–5), amino groups (NH2+) of the BAs are protonated (based on their high pKa values) and can easily bind with the sulfonic groups of the Z-BFS via hydrogen bonding interaction. Besides, a study has shown that for an amino-alkyl group bonding as depicted for the investigated amines (Table S1, Supporting Information), the alkyl group serves as an electron density donor to the nitrogen atom of the amines via an inductive effect.[34] The donated electron being readily available serves to keep the amino groups protonated because it is being shared with a Lewis acid (H+). Based on this explanation, it was averred that the appreciable removal noted for the BAs was due to their protonation and their subsequent interaction with the Z-BFS sulfonic groups at all the pH values. An exception to this was PUT, which shows an insignificant removal at the pH range of 8–10 that can be ascribed to the deprotonation of its amino groups. As shown in Table S1 in the Supporting Information, PUT exhibits two pKa values of 9.4 and 10.8, which implies that at this pH range (9.4–10.8), its amino groups will dissociate to a zwitterionic species, and therefore, its interaction with the Z-BFS functional groups will be impeded due to electrostatic repulsion, as noticed in Figure 3.
The measured zeta potentials of the Z-BFS (Figure S4, Supporting Information) depict its net surface charge as negative at pH > 4.6. This suggests the sulfonic group (S═O) of sulfamic acid is the dominant functional group at such pH values. Based on this, it was concluded that the uptake of the BAs was based on the electrostatic interactions (hydrogen bonding) between the protonated amino groups of the BAs and the sulfonic group of the Z-BFS.
3.3 Adsorption Kinetic Study of the BAs
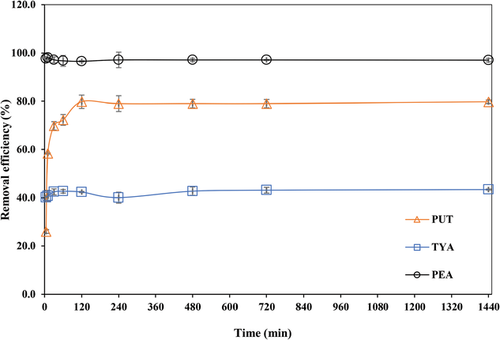
The result of adsorption kinetic studies for the multicomponent removal of the three BAs is illustrated in Figure 4. The BAs uptake was instantaneous following the addition of the Z-BFS, and the equilibrium conditions were attained after 4 h of adsorption time. PEA exhibits a stronger affinity for the Z-BFS than all other BAs with a near complete removal (97%) at 5 min of adsorption time. More so, its kinetic curve displayed a fast uptake rate that was approximately constant over the entire period. PUT, on the other hand, also exhibited fast uptake kinetics (lower than PEA) with its curves displaying an initial uptake zone, which was followed by a zone of constant removal that indicates the attainment of equilibrium condition. As for TYA, its kinetic curve exhibits similar characteristics as PUT. However, its uptake rate was much slower than all other BAs.
The experimental kinetic data were fitted to three kinetic models (pseudo-first order, pseudo-second order, and Elovich models) presented in Table 2. The pseudo-first-order model is widely used for the description of the physical adsorption process, while the pseudo-second-order model is mostly employed for the description of the adsorption process involving chemical interaction.[35] The Elovich model, on the other hand, is used in describing the chemical adsorption process occurring on heterogenous surfaces.[36] The linear forms of these models were fitted to the kinetic data and the corresponding parameters and the determination coefficient values (R2) were calculated as presented in Table 3.
| Kinetic model | Equation | Parameter description | Reference |
|---|---|---|---|
| Pseudo-first-order model | qt = qe [1 − exp ( − k1 t )] | qt: adsorbed amount (mg g−1) at time t (min);qe: equilibrium adsorption capacity (mg g−1);k1 (min−1) and k2 (g mg−1 min−1): pseudo-first-order and pseudo-second-order rate constant, respectively;a: initial uptake rate (mg min−1) andb: Elovich constant (g mg−1) | [4] |
| Pseudo-second-order model | |||
| Elovich model |
| Component | Pseudo-first order | Pseudo-second order | Elovich model | ||||||
|---|---|---|---|---|---|---|---|---|---|
| k1[min−1] | qe [mg g−1] | R2 | k2[L g−1 min−1] | qe[mg g−1] | R2 | a[mg min−1] | B[g mg−1] | R2 | |
| PEA | 2 × 10⁻⁵ | 0.278 | 0.046 | 24.09 | 2.040 | 0.9999 | 0.003 | 2.053 | 0.306 |
| PUT | 9 × 10⁻⁴ | 0.366 | 0.319 | 0.116 | 1.680 | 0.9999 | 0.157 | 0.728 | 0.671 |
| TYA | 2 × 10⁻⁴ | 0.149 | 0.395 | 0.252 | 0.910 | 0.9998 | 0.009 | 0.839 | 0.418 |
The pseudo-second-order model provided the most suitable description of the kinetic data based on its R2 values (>0.999) for each of the BAs. PEA's second-order rate constant (k2) of 24.09 g (mg min)−1 and theoretical equilibrium adsorption capacity (qe) of 2.038 as calculated were observed to be higher than those for PUT (k2: 0.1157; qe: 1.679) and TYA (k2: 0.2522; qe: 0.911). Hence, indicating that PEA uptake by the Z-BFS in the mixed solution was highly favored all other BAs.
Based on the suitability of the pseudo-second-order model in providing a satisfactory description of the kinetic data, it was suggested that the rate-limiting step in the uptake of the BAs was due to a chemical interaction process that was aided by the availability of surface binding sites.[37]
3.4 Adsorption Isotherm
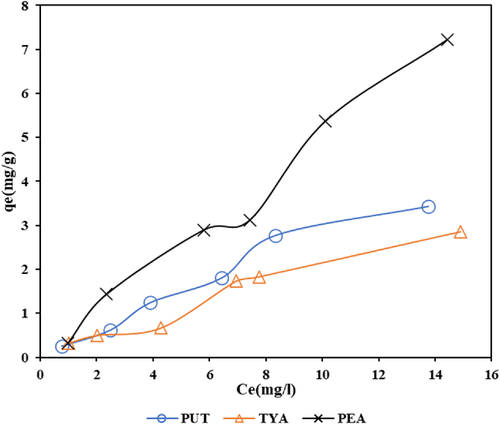
The result of the adsorption isotherm study conducted to evaluate the adsorption capacity of the BAs by the Z-BFS is presented in Figure 5. As displayed, all the BAs presented an L-type isotherm curve based on the conventional classification.[38] An increase in the adsorbed amount (qe) can be noticed with an increase in the initial concentration (Ce) of the BAs. It can be explained that the binding of the BAs occurred progressively on the Z-BFS surface until saturation condition was reached. As illustrated, PEA exhibited a higher adsorbed amount on the Z-BFS, followed by PUT and TYA (least retained).
The adsorption isotherm data were fitted to the two conventional isotherm models, Langmuir and Freundlich, presented in Equations (5) and (6). The Langmuir model is an empirical adsorption relation that assumes the uptake of the adsorbate by the adsorbent occurs as a monolayer with no interaction between the adsorbed species.[39] The Freundlich model, on the other hand, considers a heterogenous adsorbent surface where the adsorbed species interacts with each other in a multilayer form.[40] The linear forms of these models were used in the data fitting as depicted in Figure S5 in the Supporting Information, and the corresponding model parameters and R2 values were computed.
The results of the isotherm model parameters are presented in Table 4. The Langmuir isotherm model was found to fit to the adsorption data based on its high R2 values (PUT: 0.9883, TYA: 0.9249, PEA: 0.9984). Hence, this finding suggests that the uptake of the BAs by the Z-BFS might have occurred via a monolayer sorption process. The computed values of KL (L mg−1) (PEA: 0.004, TYA: 0.005, PUT: 0.0278) and qm (mg g−1) (PEA: 80.64, TYA: 64.52, PUT: 12.5) that relate to the intensity of adsorption and maximum adsorption capacity, respectively, were able to justify this assertion.
| Model | Putrescine | Tyramine | 2-Phenylethylamine |
|---|---|---|---|
| Langmuir isotherm | |||
| qm (mg g−1) | 12.50 | 64.52 | 80.64 |
| KL (L mg−1) | 0.027 | 0.005 | 0.004 |
| R2 | 0.9883 | 0.9249 | 0.9984 |
| Freundlich Isotherm | |||
| N | 1.026 | 1.058 | 1.025 |
| kF (mg g−1) (L mg−1)(1/n) | 0.314 | 0.351 | 0.336 |
| R2 | 0.9835 | 0.9432 | 0.9768 |
A comparison of the adsorption capacity values for the BAs is presented in Table 5, showing that the Z-BFS offered a superior adsorption capacity for the BAs comparable to other adsorbent reported in published literature.
| Adsorbent | Biogenic amines adsorption capacity [qe, mg g−1] | Reference | ||
|---|---|---|---|---|
| Putrescine | Tyramine | 2-Phenylethylamine | ||
| Ca-Montmorillonite | – | 93.55 | – | [4] |
| Modified zirconium phosphate | 25.00 | 2.00 | – | [34] |
| Protein-modified silica | – | 27.50 | – | [20] |
| Carbon nanotubes | – | 25.24 | – | [13] |
| Sulfonic acid-functionalized silica | – | 148.4 | – | [24] |
| Sulfamic acid-functionalized slag | 12.50 | 64.52 | 80.64 | Present study |
3.5 Statistical Analysis and Response Surface Modeling
The results of the CCD design matrix showing the factor combinations and the corresponding responses (actual and predicted) are presented in Table S2 in the Supporting Information. With the aid of the Design Expert Software, the obtained responses were fitted to either a reduced quadratic polynomial or reduced cubic polynomial based on the coded values (A, adsorbent dosage; B, initial BAs concentrations and C, time) as shown in Equations (7)–(9). The response values for the actual experimental data showed the following maximum removal efficiency attained for the BAs: PUT: 90%, TYA: 70%, and PEA: 99%, while the predicted values derived from the fitted models showed a removal efficiency for PUT: 98%, TYA: 71%, and PEA: 99%.
Evaluation of the normality of the responses was carried out through the standard probability plots of the residuals displayed in Figure 6. As illustrated, the experimental responses were approximately normally distributed based on their residuals plot depicting a nearly straight line. Figure 6 also displays the plots of predicted values (based on fitted model) versus the actual response values for each of the BAs. These plots indicate the existence of a good correlation between the actual and predicted responses data.

The results of the ANOVA test are presented in Tables S3–S5 in the Supporting Information. The significance level of each of the factors and their interaction were assessed based on the corresponding p-values at 95% confidence interval. p-Value > 0.05 for a factor signifies the statistical insignificance of the factor to the response, while p-values < 0.05 indicate the significance of the parameter to the response.[41] As shown in Tables S3–S5 in the Supporting Information for all the responses (PUT, TYA, and PEA), the individual factors, A (adsorbent dosage), B (initial BAs concentration), and C (contact time), were found to be statistically significant (p-values < 0.05).
The results of the ANOVA test for the fitted models are presented in Table 6. p-Values of the models were found to be <0.05 (p-value < 0.0001), which signify their statistical significance. The lack of fit tests for each of the models was observed to be insignificant based on their p-values > 0.05. Thus, proving the models can provide a satisfactory prediction of the responses.
| Source | Sum of squares | dfa) | Mean square | F-value | p-Value | Comment |
|---|---|---|---|---|---|---|
| PUT | ||||||
| Model | 5598 | 9 | 622.0 | 29.57 | <1 × 10⁻⁴ | Significant |
| Residual | 210.4 | 110 | 21.04 | |||
| Lack of fit | 155.4 | 5 | 31.09 | 2.830 | 0.1391 | Not significant |
| Pure error | 54.93 | 5 | 10.99 | |||
| Cor totala) | 5808 | 19 | ||||
| TYA | ||||||
| Model | 8074 | 12 | 672.8 | 160.7 | < 1 × 10⁻⁴ | Significant |
| Residual | 29.30 | 7 | 4.190 | |||
| Lack of fit | 19.60 | 2 | 9.800 | 5.050 | 0.0632 | Not significant |
| Pure error | 9.710 | 5 | 1.940 | |||
| Cor total | 8103 | 19 | ||||
| PEA | ||||||
| Model | 643.5 | 11 | 58.50 | 7.350 | 4.5 × 10⁻³ | Significant |
| Residual | 63.70 | 8 | 7.960 | |||
| Lack of fit | 2.250 | 3 | 0.750 | 0.061 | 0.9782 | Not significant |
| Pure error | 61.45 | 5 | 12.29 | |||
| Cor total | 707 | 19 |
- a) df, degree of freedom; Cor total, corrected sum of squares total.
The obtained R2 and adjusted R2 values for all the models (Table 7) were close to unity (1). In addition, a good agreement between the adjusted R2 and the predicted R2 for all the models was also observed (occurs when their difference is <0.2). Adequate precision which measures the signal-to-noise ratio of the predicted values to the average predicted error was computed. An adequate precision value >4 indicates a good model with an adequate predictive capability. The adequate precision values for all the models were >4. In summary, all the above analyses were able to provide considerable proof of the adequacy of the models and indicate their good predictive capability for the experiment responses.
| Parameter | PUT | TYA | PEA |
|---|---|---|---|
| Standard deviation | 5.270 | 2.05 | 2.82 |
| Mean | 72.52 | 45.84 | 91.23 |
| C.V. %a) | 7.27 | 4.46 | 3.09 |
| R²a) | 0.9426 | 0.9964 | 0.9099 |
| Adjusted R² | 0.9091 | 0.9902 | 0.7861 |
| Predicted R² | 0.7846 | 0.8069 | 0.7550 |
| Adequate precision | 19.33 | 34.72 | 8.657 |
- a) C.V., coefficient of variation; R2, coefficient of determination.
3.6 Effect of Adsorption Parameters on the Removal of the BAs
The effect of each of the factors and their interaction on the removal of the BAs was evaluated through the 3D response surface plots, presented in Figure 7. The 3D plots allow for the graphical representation of the factor's interactions, from which valuable information about them can be deduced. As depicted in Figure 7, adsorbent dosage (A), initial concentration (B), and contact time (C) displayed a significant effect on the percent removal efficiency of PUT, TYA, and PEA (responses). For example, in the case of PUT, a simultaneous increase in A (from 2 to 4 g L−1) and C (60–150 min) facilitated its enhanced removal up to the optimum value. Similarly, enhanced removal of TYA and PEA was noted at high values of A and C. On the other hand, factor B displayed an antagonistic effect on the BAs removal, except for PEA. As depicted, an increase in B led to a significant decrease in the removal of PUT and TYA. However, in the case of PEA, an enhanced removal was noticed at higher values of B, which implies that PEA was highly favored compared to the other BAs. A probable explanation for the reduction of PUT and TYA might be due to the occurrence of competition in the mixed BAs solution for surface binding sites on the Z-BFS, with PEA being more favorably adsorbed.
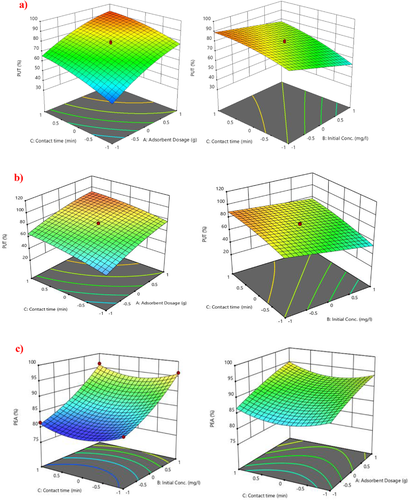
The enhanced removal efficiencies noted at high values of A and C can be attributed to the increased availability of surface functional groups, and extended interaction time between the Z-BFS and BAs in solution. On the contrary, the lower removal efficiencies observed at higher values of B could be due to the quick saturation of the Z-BFS surface sites by the BAs which led to the exhaustion of the surface sites.
3.7 Adsorption of BAs from a Real Wastewater
To evaluate the capability of the Z-BFS for the removal of BAs from a real wastewater sample, batch adsorption experiments were conducted using date palm fruit wastewater. The composition of the wastewater sample is presented in Table 8. As shown, the wastewater sample contained the investigated biogenic amines in low concentration in addition to inorganic ions, total dissolved solids (TDS), and suspended solids (TSS) that could interfere during the adsorption process. Hence, the selectivity of the Z-BFS toward the BAs is of immense importance in its use for industrial application purposes.
| Parameter | Value | |
|---|---|---|
| pH | 6.3 | |
| TDSa) | 538.8 mg L−1 | |
| TSSa) | 223 mg L−1 | |
| Cl− | 185 mg L−1 | |
| SO42− | 234 mg L−1 | |
| Biogenic amines | Putrescine | 0.56 mg L−1 |
| Tyramine | 0.12 mg L−1 | |
| 2-Phenylethylamine | 0.23 mg L−1 | |
- a) TDS, total dissolved solid; TSS, total suspended solid.
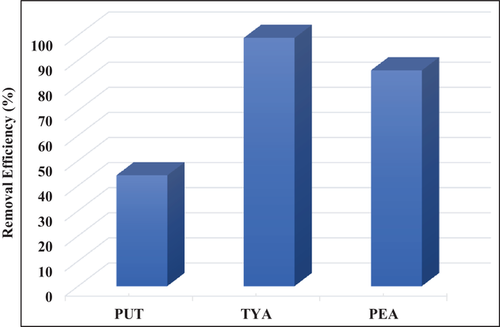
The result of the batch adsorption experiment in Figure 8 showed the Z-BFS exhibited high selectivity for the BAs with a notable removal efficiency. As illustrated, TYA exhibited the most significant removal (>98%) due to its lower concentration which is followed by PEA (86%) and PUT (44%).
3.8 Proposed Adsorption Mechanism
To confirm the role played by the loaded functional groups and the possible adsorption mechanism, an additional FTIR spectrum of the BAs-loaded Z-BFS was acquired as illustrated in Figure S6 in the Supporting Information. The formation of new bands at 1049, 937.72, and 603 cm−1 which were attributed to C─N stretching of aliphatic and aromatic amines, respectively, is indicative of the effectiveness of Z-BFS for the BAs removal. It should be noted that in the FTIR spectra of the Z-BFS the peak at 1432 cm−1 previously assigned to S═O stretching of sulfonic groups shifted to 1049 cm−1 of C─N stretch of amines. This suggests the participation of S═O groups in the uptake of the BAs.
Considering the above, the mechanism of the BAs interaction with Z-BFS was assigned to hydrogen bonding interaction between the S═O groups (acidic sites) of the Z-BFS and the protonated species (basic) of the BAs as discussed earlier. Moreover, the Z-BFS has been shown to contain cationic elements such as aluminium, calcium, and magnesium as illustrated in the EDS spectra (Figure 1A). Based on this, it is suspected that ionic exchange between these elements and the protonated amino groups of the BAs might have also contributed to the removal of the BAs from the solution via hydrogen bonding interactions.
4 Conclusion
Surface functionalization of BFS with sulfamic acid was shown to enhance its adsorptive removal of selected biogenic amines (putrescine, tyramine, 2-phenylethylamine) from water samples. Surface characterization tests conducted (SEM-EDS, FTIR, XRD) revealed an improvement in the surface properties of the slag and the introduction of sulfonic groups (S═O). Evaluation of the Z-BFS for the removal of biogenic amines in mixed solution revealed that 2-phenylethylamine and tyramine removal was not significantly affected by pH variation (pH 2–10). On the contrary, putrescine exhibited a pH-dependent removal, as it displayed increased removal from pH 2 to 8, followed by a decreased removal at pH > 8. The effect of the process parameters investigated via a central composite design showed that all the parameters (adsorbent dosage, initial concentration, and contact time) displayed a significant effect on the removal of each of the biogenic amines. The result from the isotherm and kinetic studies conducted shows that 2-phenylethylamine was highly favored by the Z-BFS, followed by putrescine and lastly tyramine. Maximum adsorption capacity values of 80.64 mg g−1 (2-phenylethylamine), 12.5 mg g−1 (putrescine), and 64.52 mg g−1 (tyramine) were estimated from the Langmuir isotherm model fitting. The proposed mechanism of adsorption was attributed to hydrogen bonding interaction between the S═O groups of the Z-BFS and the amino groups of the biogenic amines. It was observed that the Z-BFS offered good selectivity for the biogenic amines in date palm fruit wastewater. Building upon findings from this research work, it is recommended that a study of these biogenic amine removals with a flow-through column packed with Z-BFS should be conducted to ascertain the industrial feasibility of this treatment approach.
Acknowledgements
The authors express their gratitude to King Fahd University of Petroleum & Minerals (Dhahran, Saudi Arabia) for the technical and financial support provided. C.B. thanks the deanship of scientific research for the financial support through project no.: DF181034.
Conflict of Interest
The authors declare no conflict of interest.
Open Research
Data Availability Statement
The data that support the findings of this study are available on request from the corresponding author.


