Continuous Trichloroethylene Removal in Internally Recirculating Fluidized Bed of Activated Carbon
Abstract
Internally recirculating fluidized bed (IRFB) technology has the potential to offer a compact and efficient solution for continuous removal of volatile organic compounds (VOCs) owing to its unique capability to integrate fluidized bed desorption and moving bed adsorption processes in one-unit operation. The IRFB prototype developed in the present work employs activated carbon for continuous removal of trichloroethylene (TCE), a hazardous halogenated hydrocarbon and suspected carcinogen. A mathematical model has been developed by using open-source computational solvers to study the steady-state performance of IRFB. Borescope and VOC sensing techniques are used for experimental validation of the mathematical model. The solid recirculation rate, average TCE retention on activated carbon particles, and TCE removal efficiency up to 70 g s−1, 454 mg(TCE) g−1(AC), and 98 %, respectively, have been attained at steady-state IRFB operation for the set of operating and design parameters used in the present work.
1 Introduction
Industrial-scale adsorption processes typically employ cyclic operation of fixed or moving bed systems. A significant portion of the total operational time is spent for regeneration of adsorbent material in such systems [1-4]. Recirculating fluidized beds can be utilized to overcome this limitation. Recirculating fluidized beds consist of two separate zones operating at different fluidization regimes, one for reaction and the other for regeneration [5]. These two zones are connected by material transport from one zone to another and therefore can be operated simultaneously. The unique aspect of the recirculating fluidized beds is their flexibility to allow the gas entering the reaction zone to be at different operating conditions than the gas entering the regeneration zone and therefore allowing independent control of the composition, temperature, pressure, and velocity of the gases entering the respective zones [6]. To date, recirculating fluidized beds have been designed to increase the throughput as well as the efficiency of several industrial processes such as combustion, coal gasification, solid granulation, coating, and drying [6-8]. Thus far, several researchers have studied the hydrodynamics, heat, and mass transport characteristics of recirculating fluidized beds of Geldart “A” and “B” class particles [8-12]. Abdelghany et al. studied the effect of ultrafine and superfine power loading on solid recirculation rates [10]. Boonprasop et al. established that riser height is the key parameter required to design circulating fluidized beds with a single-feed system [11]. Ying Ma et al. observed that solid concentration has the most dominant effect on gas–solid heat transfer characteristics in riser and down-comer sections [12], whereas Joachim Vollert et al. observed that an increase in solid concentration leads to a decrease in gas–solid mass transfer characteristics [13]. Shagyi Yin et al. established that uniformity of axial solid distribution in recirculating fluidized bed at elevated pressure decreases with a decrease in solid mass flux and an increase in gas superficial velocity [14]. Generally, the recirculating fluidized beds are designed either as an externally recirculating fluidized bed or as an internally recirculating fluidized bed (IRFB).
IRFB systems are more compact and energy efficient as they do not require separate heat exchangers, loop seals, riser tubes, and cyclone separators, which are otherwise necessary for the operation of externally recirculating fluidized bed systems [15, 16]. The IRFB integrates the reaction and regeneration zones into a single-process equipment by incorporating an internal draft tube, which divides the bed into a high-velocity region inside the draft tube to facilitate upward transport of solids and a low-velocity region in the annulus region of the bed to serve as down-comer for the solids exiting the top of draft tube. The IRFB technology is still in the developing stage due to the complex simultaneous transport phenomena occurring inside the bed. To date, several researchers have either designed IRFB systems to overcome the limitations present in conventional gas–solid operations or have studied various aspects of IRFB systems to gain insight into their internal working mechanisms [17-27]. Milne et al. developed the IRFB to overcome the limitation of gas bypassing in fluidized beds of Geldart D class sand particles and polystyrene beads [19]. Song et al. reduced the gas bypassing in draft tube by elevating the draft tube height and incorporating conical gas distributors [20]. Kim et al. studied the performance of IRFB systems for coal gasification and developed a model to predict the composition of product gas from IRFB [21]. Chandel et al. developed a mathematical equation to predict solid recirculation rate for specified design and operating parameters for Geldart B and D class particles [22]. They found that among the design and operating process parameters, the effect of superficial gas velocity to draft tube, particle size, and area ratio of draft tube to down-comer is most dominant on solid recirculation rate in IRFB. Furthermore, they established that the solid recirculation velocity in IRFB increases with an increase in initial bed inventory, decreases with an increase in the length of draft tube, and is higher for fine particles than coarse particles. Meanwhile, they also found out that there exists an optimum value for spacing between the bottom of draft tube and the gas distributor plate that maximizes the solid recirculation rate for specified operating parameters. Hassan et al. established that the solid recirculation occurs due to pressure differences in the draft tube and down-comer zones; meanwhile, the solid recirculation rate in IRFB increases with an increase in the superficial velocity of the gas inlet to draft tube, whereas it decreases with an increase in the diameter of fluidizing particles [23]. They developed an internally circulating elevated fluidized bed, which gave better recirculation than conventional IRFB systems. Chourasiya et al. established that attrition due to abrasion is more prominent than fragmentation in IRFB based on Geldart B class particles [24]. It was observed that even though recirculating fluidized bed technologies have been studied thoroughly for reactive systems and resolving operational difficulties in spouted bed regimes, their application for continuous removal of volatile organic compounds (VOCs) has not been investigated so far.
Activated carbon is a versatile adsorbent material for VOCs because of many favorable properties, such as high surface area and pore volume per unit mass, easy availability, several raw materials for mass production, and high mass transfer rates for adsorption and desorption [28-36]. Due to strict emission norms for industrial off-gases in several countries, the removal of VOCs is a major challenge in the chemical engineering field. However, VOCs find significant application as cleaning and dissolving agents for film coats and magnetic and electronic chips and have industrial applications in metal finishing and dry-cleaning works [37-44]. Therefore, VOC recovery after removal from a gaseous stream can also generate revenue. One of the VOCs commonly used for the production of separator material in lithium-ion battery industry is trichloroethylene (TCE). TCE is a hazardous halogenated hydrocarbon VOC that is not only mutagenic but also a suspected carcinogen [27]. TCE is a known groundwater contaminant, and its removal in drinking water is imperative [45, 46]. Many processes apart from adsorption provide industrially feasible solutions for TCE removal, such as thermal oxidation, photocatalytic oxidation, cryogenic condensation, biological degradation, pervaporation, and plasma technology. Application of packed bed adsorption using activated carbon particles has been established for TCE removal previously [47-51].
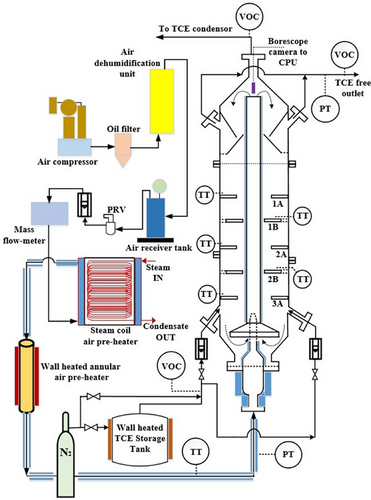
The application of IRFB technology for continuous removal of TCE has not been reported anywhere previously and is therefore being explored for the first time in the present work. The present work integrates moving bed adsorption and fluidized bed desorption processes in an in-house-designed activated carbon-based IRFB prototype and assesses its performance for continuous removal of TCE. The IRFB prototype achieves continuous removal and simultaneous recovery of the VOCs by using the draft tube region for the fluidized bed desorption process and the down-comer region for the moving bed adsorption process, respectively. Parallelly, a mathematical model has been developed using open-source computational solvers to obtain the solid recirculation rate, average TCE retention on activated carbon particles, and overall TCE removal efficiency at steady-state operating conditions in IRFB. In our previous work, a mathematical model based on the linear driving force (LDF) framework was implemented by in-house developed open-source computational solvers to study the dependence of operating parameters on the performance of fixed and fluidized bed processes for one-cycle removal of TCE with activated carbon particles as the adsorbent material [52]. The present study uses modified versions of the solvers developed previously for energy and species’ mass balance equations. However, contrary to the Lagrangian–Eulerian solver used for obtaining fluidized bed hydrodynamics in previous work, the present study employs an Eulerian–Eulerian solver for obtaining the fluidized bed hydrodynamics in the draft tube region. The ability of the Eulerian–Eulerian two-fluid model based on the kinetic theory of granular flow to model recirculating fluidized beds has been ascertained previously by Min Wang et al. [53]. VOC area monitors are used to experimentally obtain TCE concentration in outlet gases from fluidized bed desorption zone (draft tube region) and moving bed adsorption zone (down-comer region). Hitherto, many works have used the stained particle tracking method and iterative procedures based on pressure drop measurements to experimentally obtain solid recirculation rates. Borescope technique has proved to be effective for run-time analysis in gas–solid systems [54, 55] and has been used to obtain the voidage at the top of fluidized bed desorption zone. The details of the experimental method and mathematical model are described in the subsequent sections.
2 Experimental Method
| Fluidized bed desorption zone (draft tube) | Desorption column diameter | 0.1 m |
| Desorption column height | 2 m | |
| Desorption column wall thickness | 5 mm | |
| Tip diameter of gas inlet nozzle | 3 mm | |
| Gap between draft tube bottom and tip of gas inlet nozzle | 75 mm | |
| Elevation of draft tube from bottom flange of down comer | 150 mm | |
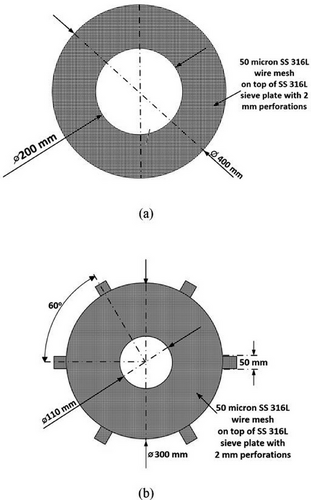
| Moving bed adsorption zone (down-comer) | Inner diameter of Trays 1A, 2A, and 3A | 200 mm |
| Outer diameter of Trays 1A, 2A, and 3A | 400 mm | |
| Inner diameter of Trays 1B and 2B | 110 mm | |
| Outer diameter of Trays 1B and 2B | 300 mm | |
| Perforation size of sieve plate of trays | 2 mm | |
| Perforation size of wire-mesh of trays | 50 µm | |
| Tray thickness | 5 mm | |
| Elevation of Tray 1A from bottom flange of down comer | 1100 mm | |
| Elevation of Tray 1B from bottom flange of down comer | 925 mm | |
| Elevation of Tray 2A from bottom flange of down comer | 800 mm | |
| Elevation of Tray 1B from bottom flange of down comer | 625 mm | |
| Elevation of Tray 3A from bottom flange of down comer | 450 mm | |
| Total inlet flow rate of nitrogen gas | 3 m3 h−1 |
The operating parameters of IRFB experiments are particle diameter dP = [355, 500, 710 µm], feed gas TCE concentration = [0.3.0.6.1.2,2.4 g (TCE)] L−1 (N2) and ratio of fluidization velocity to minimum fluidization velocity in desorption column udes/umf = [7.5, 15, 30]. The particle size range is selected such that only Geldart “B” class granular activated carbon particles with wide commercial availability are employed for application in IRFB. Geldart “B” class granular activated carbon particles show good fluidization characteristics, have good commercial availability, and have low particle–particle cohesive behavior. Owing to the lower particle-to-particle cohesive behavior, the particle agglomeration is lower than that compared to Geldart “A” particles [56]. The BET surface area, micropore volume, and skeletal density of the activated carbon particles are tabulated in the work of Nikam et al. [57]. The operation of the experiment is as follows. Before initiating the experimental run for a specified set of parameters, the desorption column is loaded with 5.5 kg of fresh activated carbon particles having the desired particle diameter dP. The TCE storage tank of 35 L capacity (internal diameter: 0.25 m, height: 0.7 m) is loaded with 30 L of TCE. The upper limit of TCE concentration in feed gas is kept at 2.4 g (TCE)] L−1 (N2) to keep the TCE concentration in the headspace of the TCE storage tank below the lower explosive limit (8 % vol vol−1) in case any leakage exists in piping or body of TCE storage tank. The lower limit of TCE concentration in feed gas is kept at 0.3 g (TCE) L−1(N2) to maintain sufficient driving force in the moving bed adsorption zone of IRFB while optimizing the time required to reach steady state. The air flow to the desorption column is initiated at 3 m3 h−1, and pre-heaters are allowed to reach their respective discharge air temperatures. The pressure drop across the desorption column is continuously monitored, and flow is steadily increased, and the point of incipient fluidization is noted for the particular particle size to obtain umf. This is done while maintaining the discharge air temperature from steam and electrical heaters. Once umf is obtained, the flow is increased to get desired udes/umf. The lower limit of udes/umf is kept at 7.5 so that the gas velocity in the desorption column is always greater than the transition velocity required for transition from bubbling fluidization regime to turbulent fluidization regime with respect to Geldart “B” class granular activated carbon particles [58]. The upper limit of udes/umf is kept at 30 to maintain a high rate of recirculation to down-comer region and a low rate of particle carry-over to the outlet of IRFB and also to optimize the TCE removal efficiency with energy consumption by air pre-heaters of IRFB. After 20 min of obtaining the desired flow to the desorption column, the feed gas flow is initiated at 3 m3 h−1 and the wall temperature of TCE storage tank is adjusted to get the desired . The TCE concentration from the outlet of fluidized bed desorption zone and moving bed adsorption zone, along with the pressure drop in desorption, are continuously monitored, and the time instant at which the change in all three measured values becomes trivial is considered as the time taken by IRFB to reach steady state. The borescope readings are initiated once the IRFB reaches steady state and are repeated after every 10 s. The borescope experiments are continued for 30 min, and the data obtained from the borescope are post-processed for the validation of the mathematical model. During the experiments, the safety measures taken are as follows. The personal protective kits used at all times during handling of either TCE or activated carbon, safety goggles, Viton gloves (conforming to EN374 and EN388 standards), and double cartridge filter gas masks were equipped. The IRFB is housed within an enclosure of volume 280 m3 (5 m × 7 m × 8m), wherein 54 air changes per hour are provided by using a 4500 CFM belt-driven centrifugal blower. The minimum number of air changes per hour required as per the OSHA permissible exposure limit of 100 ppm is 44. The measures taken for waste disposal are as follows. The TCE recycled from the outlet of the IRFB is condensed, and the remnant of the outlet gas is passed through water-loaded packed bed scrubber before venting. Small batches of recycled TCE are transported to a dedicated volatile liquid waste disposal facility where a mixture of TCE and commonly available combustible fuel is mixed and incinerated. To minimize the retention of TCE in activated carbon particles after the experimental run, the IRFB is operated for an adequate time without inlet TCE flow, albeit with the fluidized bed desorption process. The used activated carbon is sent to a dedicated solid waste disposal facility where it is disposed of by burying it under an ample quantity of soil isolated from groundwater.
3 Mathematical Model
The algorithm of the mathematical model employed to study continuous fluidized bed desorption and moving bed adsorption in IRFB of activated carbon particles is shown in Fig. 3. The algorithm uses OpenFOAM CFD solver to obtain fluidization hydrodynamics of desorption column and in-house developed solvers based on finite volume method (FVM) to solve coupled energy and species’ mass balance equations corresponding to continuous fluidized bed desorption and moving bed adsorption processes. The details of OpenFOAM CFD solver and in-house FVM solvers are provided in Sects. 3.1 and 3.2, respectively, as follows. The details for estimation of overall model–experimental error are shown in Sect. 3.3.

3.1 OpenFOAM CFD Solver
Post-processing of results from OpenFOAM CFD solver is done to obtain profiles of gas-phase void fraction, temperature, and velocity of gas and solid phases, along with solid recirculation rate at all the time instants, which are then input to in-house FVM solvers of energy and species’ mass balance solvers.
3.2 In-House FVM Solver
The in-house FVM-based computational solvers for energy balance in fluidized bed desorption column and species’ mass balance in both fluidized bed desorption column and the moving bed adsorption zone have been developed using Python v3.7.6 [67]. The solving methodology is LDF model-based parameter optimization, which is described in-depth in our previous work [52]; caveat the initial and boundary conditions along with grid geometry have been modified for modeling continuous adsorption–desorption of TCE on activated carbon in IRFB. On the similar lines of our previous work, the heat of adsorption term couples the solvers of energy balance and species’ mass balance, whereas the energy balance equation of solid and gas phases in desorption column are coupled by the inter-phase heat transfer term.
3.2.1 Energy Balance Solver for Fluidized Bed Desorption Zone
The modified initial and boundary conditions of the energy balance equation in fluidized bed desorption zone are shown by Eq. (3) and Eqs. (4)–(7), respectively. The boundary condition of energy balance equation at the inlet of the desorption column is the same as that depicted in our previous work [52]. Here, is the temperature of inlet gas to desorption column. The temperature of solid particles entering the desorption column from down-comer region is assumed to be the same as that prevailing on Tray 3A. This temperature is experimentally measured and denoted by .
Boundary conditions:
3.2.2 Species’ Mass Balance Solver for Fluidized Bed Desorption Zone
The partial differential equation (PDE) for species’ mass balance used in our previous work [52] is applicable for the desorption column, wherein the driving force is responsible for the removal of TCE from macro- and micropores of particles to the bulk gas phase. The equilibrium data for adsorption and desorption of TCE on/from activated carbon particles are obtained from the work of Nikam et al. [57]. This is due to the boundary condition of Eq. (8), which depicts that gas coming into the desorption column from the bottom is free of TCE. Exiting particles from Tray 3A enter the desorption column at , which sets the boundary condition (Eq. 9).
3.2.3 Species’ Mass Balance Solver for Moving Bed Adsorption Zone
The initial and boundary conditions for species’ mass balance equations on each tray are given by Eqs. (14)–(18) for Tray 3A, Eqs. (19)–(22) for Tray 2B, Eqs. (23)–(26) for Tray 2A, Eqs. (27)–(30) for Tray 1B, and Eqs. (31)–(34) for Tray 1A, respectively.
3.3 Overall Model–Experimental Error Estimation
In Eqs. (35) and (36), is the experimental borescope result and is the OpenFOAM CFD solver result for void fraction at the outlet of the desorption column. In Eqs. (38) and (39), and are the experimental measured and in-house FVM solver results for TCE concentration in the outlet of either the fluidized bed desorption zone or the moving bed adsorption zone. The convergence criteria for twoPhaseEulerFoam solver are and in-house FVM solver is , respectively.
4 Results and Discussion
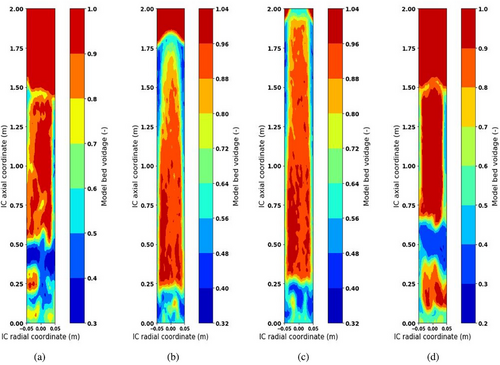
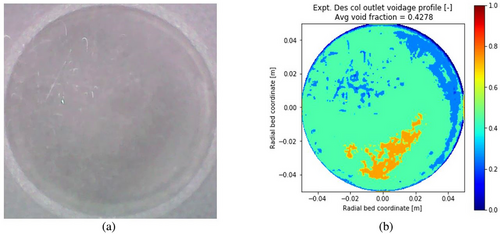
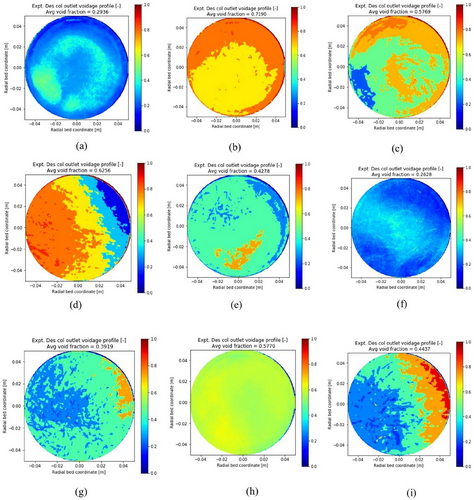
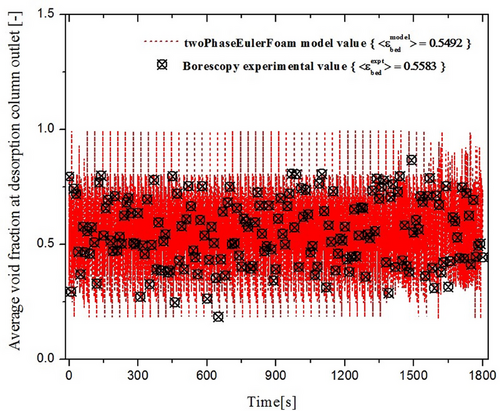
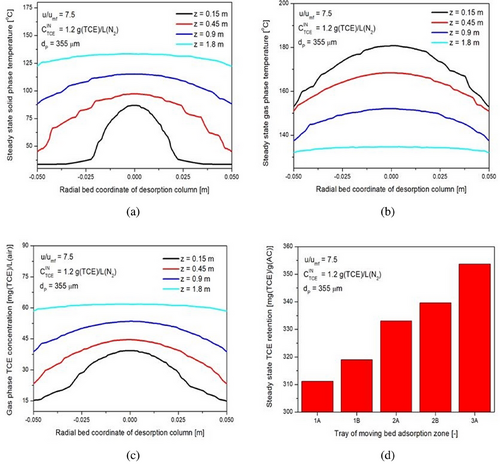
The present study aims to get insight into the internal working mechanism of IRFB being employed for continuous adsorption and desorption of TCE on activated carbon particles. The operating parameters of the process are the feed gas TCE concentration , the ratio of fluidization velocity to minimum fluidization velocity in the desorption column udes/umf, and particle diameter dP. The algorithm of the mathematical model utilizes empirical correlations for steady-state tray and desorption column inventory, the twoPhaseEulerFoam module of OpenFOAM CFD solver, and in-house developed FVM solvers in conjunction with one another. The OpenFOAM CFD solver has been applied with acceptable accuracy to obtain gas-phase void fraction profiles and solid recirculation velocity, whereas the in-house FVM solver has been applied satisfactorily to obtain the steady-state retention of TCE on activated particles residing on the trays in the annular region of IRFB. The model parameters have been successfully optimized to fit experimental data. The optimized parameters of empirical correlations for steady-state adsorbent inventory on trays and desorption columns are tabulated in Tab. 2. The optimized model parameters for the twoPhaseEulerFoam module of OpenFOAM CFD solver and in-house developed FVM solvers are tabulated in Tab. 3. Sample results of OpenFOAM CFD solver for gas-phase void fraction profile at udes/umf = 7.5 and dP = 355 µm for various time instants of t = 150, 300, 600 and 1200 s are shown by Fig. 3. The t = 0 in the model and borescope experiments carried out in IRFB for model validation corresponds to the first time instant after attaining steady state of continuous operation. The total experimental (and simulation time) after IRFB attains steady state is tnet = 1800 s. The TCE concentration from the outlet of the fluidized bed desorption zone and moving bed adsorption zone, along with the pressure drop in desorption, are continuously monitored, and the time instant at which the change in the three measured values becomes trivial is considered as the time taken by IRFB to reach steady state. Fig. 4 shows the borescope experiment photograph of the desorption column outlet and its conversion to the void fraction profile at the time instant of t = 480 s for operating parameters of = [355 µm, 7.5, 1.2 g (TCE) L−1(N2)]. Fig. 5 shows the converted void fraction profile at t = 10, 30, 60, 240, 480, 600, 900, 1200, and 1800 s for above-mentioned operating parameters. Fig. 6 shows the overall temporal variation of average void fraction results for the above-mentioned set of operating parameters at the outlet of desorption column obtained from both the twoPhaseEulerFoam module of OpenFOAM CFD solve and borescope measurements. It can be observed that the parameters of the twoPhaseEulerFoam module and empirical correlation for steady-state inventory in the desorption column have been satisfactorily optimized to fit the experimental results for time-averaged void fraction at the outlet of desorption column. The results of in-house FVM solvers for steady-state spatial variation of solid-phase temperature in desorption column, gas-phase temperature in desorption column, gas-phase TCE concentration in desorption column, and steady-state TCE retention in activated carbon particles residing on Trays 1A–3A are shown in Fig. 7a–d, respectively. The mean and cross-sectional uniformity of solid-phase temperature increases within the axial bed coordinate of desorption column, whereas vice versa holds for gas-phase temperature in desorption column. The spatial profile for gas-phase TCE concentration in desorption column follows a similar trend as that of the solid-phase temperature profile, which implies that the influence of solid-phase temperature on mass transport characteristics of the desorption process is much more dominant than the effect of gas-phase temperature. Higher solid-phase temperature leads to increase in intra-particle diffusivity of TCE accompanied by a decrease in surface barrier and resistance. At the same time, higher gas-phase temperature leads to increased diffusion of TCE in bulk gas phase, which means higher TCE concentration in gas film surrounding the particles and therefore leads to a decrease in the driving force of the desorption process. The results obtained from in-house FVM solvers for the fluidized bed desorption process reveal that the positive effect of solid-phase temperature on TCE desorption from activated carbon particles more than compensates for the negative effect of gas-phase temperature at the above-mentioned set of operating parameters. Lastly, the steady-state TCE retention of activated carbon particles increases from Trays 1A to 3A at the above-mentioned set of operating parameters. The difference in steady-state TCE retention between 2A and 1B trays is significantly higher than the same difference between Trays 1B and 1A. Apart from this, the difference in steady-state TCE retention between 3A and 2B trays is significantly higher than the same difference between Trays 2B and 2A. This is due to lower available cross-sectional area and therefore lower holdup inventory of “B” type trays than “A” type trays. For the set of operating parameters mentioned above, the steady-state TCE retention varies from around 310 mg (TCE) g−1(AC) for Tray 1A to around 350 mg (TCE) g−1(AC) for Tray 3A. Consequently, the mathematical model has been applied for all sets of operating parameters used in the present work.
| Steady-state tray holdup inventory | Packing density (εPF) in adsorption zone for dP = 355 µm | 0.68 |
| Packing density (εPF) in adsorption zone for dP = 500 µm | 0.65 | |
| Packing density (εPF) in adsorption zone for dP = 710 µm | 0.63 | |
| Steady-state desorption column inventory | Fractional tray holdup for tray 1A (ζ1A) | 0.4 |
| Fractional tray holdup for tray 1B (ζ1B) | 0.12 | |
| Fractional tray holdup for tray 2A (ζ2A) | 0.2 | |
| Fractional tray holdup for tray 2B (ζ2B) | 0.08 | |
| Fractional tray holdup for tray 3A (ζ3A) | 0.2 | |
| Coefficients [α,β, γ, δ] | [0.075, −0.25, 0.38, −0.2] |
| OpenFOAM CFD solver (twoPhaseEulerFoam) | Mesh | 2D regular rectangular | |
| Young's modulus | 3 × 10¹⁰ | ||
| Poisson ratio | 0.2 | ||
| Drag force model | Gidaspow/Wen-Yu model for εg > 0.8 [61, 62] | ||
| Ergun model for εg ≤ 0.8 [61, 62] | |||
| Solid phase viscosity and conductivity | Hrenya and Sinclair model [63] | ||
| Radial function | Sinclair and Jackson model [64] | ||
| Frictional stress | Johnson and Jackson model [65] | ||
| Granular pressure | Lun et al. model [66] | ||
| Time-step | 0.005 s | ||
| Grid-size (dp = 355 µm) | 150 × 750 | ||
| Grid-size (dp = 500 µm) | 120 × 350 | ||
| Grid-size (dp = 710 µm) | 90 × 300 | ||
| Solid particle phase | 2D Eulerian | ||
| Gas phase | 2D Eulerian | ||
| Pressure-velocity coupling | PIMPLE | ||
| Effective density of 355 µm TCE-adsorbed particles | 2.05 kg m−3 | ||
| Effective density of 500 µm TCE-adsorbed particles | 2.04 kg m−3 | ||
| Effective density of 710 µm TCE-adsorbed particles | 2.03 kg m−3 | ||
| In-house FVM solver python v3.7.6 | Mesh for fluidized bed desorption zone | 2D regular rectangular | |
| Grid-size for fluidized bed desorption zone | Same as twoPhaseEulerFoam solver | ||
| Mesh for moving bed adsorption zone | 2D regular rectangular | ||
| Discretization scheme | Finite volume | ||
| Grid-size (dp = 355 µm) | 60 × 150 | ||
| Grid-size (dp = 500 µm) | 60 × 110 | ||
| Grid-size (dp = 710 µm) | 50 × 75 | ||
| Time-step | 0.01 s | ||
| Parameter of LDF-based model | 13 s−1 | ||
| Parameter of LDF-based model | 6 × 10⁻⁷ cm2 s−1 | ||
| Parameter of linear driving force model [EaSB,EaMD] | Moving bed adsorption zone | [8.0, 24.5 kJ mol−1] | |
| Fluidized bed desorption zone | : [4.2, 10.5 kJ mol−1] | ||
| : [3.7, 9.8 kJ mol−1] | |||
| : [2.8, 8.3 kJ mol−1] | |||
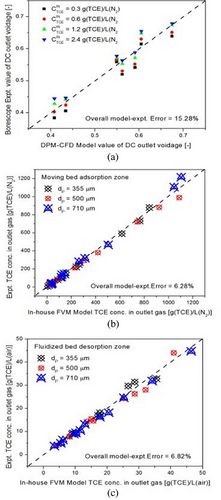
The results of OpenFOAM CFD solver for average void fraction at the outlet of desorption column and average solid recirculation rate, along with borescope experimental results for average void fraction at the outlet of the desorption column, have been tabulated in Tab. 4. The effect of fluidization velocity ratio udes/umf and particle diameter dp on average solid recirculation rate is plotted in Fig. 8. The results of in-house FVM solvers for average TCE concentration in outlet gas from the fluidized bed desorption zone and moving bed adsorption zone, along with the steady-state TCE retention in particles of Trays 1A to 3A, are tabulated in Tabs. 5–7 for 355 µm particles, 500 µm particles, and 710 µm particles, respectively. The TCE removal efficiency of IRFB for all sets of operating parameters based on the model as well as experimental measurements is tabulated in Tab. 8. The effect of variation in operating parameters on variation in solid recirculation rate, steady-state TCE retention on Trays 1A–3A, and overall TCE removal efficiency of IRFB is discussed in Sects. 4.1–4.3, respectively. The mesh sensitivity and grid independency criterion for the mathematical model are discussed in Sect. 4.4.
| Expt no. [−] | Particle size dP [µm] | Fluidization vel. ratio [−] | Borescope expt. average bed voidage at desorption column outlet [−] | Model value of average bed voidage at desorption column outlet [−] | Model value of average solid recirculation rate [] | Overall model–expt error in optimized parameters of OpenFOAM CFD solver [%] | |||
|---|---|---|---|---|---|---|---|---|---|
| Feed concentration of TCE | |||||||||
| 0.3 | 0.6 | 1.2 | 2.4 | ||||||
| 1 | 355 | 7.5 | 0.5283 | 0.5449 | 0.5583 | 0.5671 | 0.5492 | 18.11 | 13.01 |
| 2 | 355 | 15 | 0.4056 | 0.4235 | 0.4415 | 0.4463 | 0.4339 | 34.53 | 13.93 |
| 3 | 355 | 30 | 0.2248 | 0.2297 | 0.2389 | 0.2466 | 0.2428 | 69.77 | 16.88 |
| 4 | 500 | 7.5 | 0.6145 | 0.6302 | 0.6482 | 0.6545 | 0.6049 | 13.58 | 19.84 |
| 5 | 500 | 15 | 0.5411 | 0.5518 | 0.5715 | 0.5881 | 0.5907 | 26.75 | 20.02 |
| 6 | 500 | 30 | 0.3838 | 0.4020 | 0.4281 | 0.4441 | 0.4081 | 53.05 | 20.63 |
| 7 | 710 | 7.5 | 0.7302 | 0.7592 | 0.7712 | 0.7739 | 0.7666 | 10.37 | 7.50 |
| 8 | 710 | 50 | 0.6393 | 0.6507 | 0.6738 | 0.6785 | 0.6744 | 22.06 | 9.83 |
| 9 | 710 | 30 | 0.5197 | 0.5301 | 0.5528 | 0.5630 | 0.5618 | 42.11 | 15.92 |
| Average value | 15.28 % | ||||||||
| Expt no. [−] | Feed conc. of TCE | Fluidization vel. ratio [−] | Avg. steady-state TCE conc. in outlet gas of moving bed adsorption zone [] | Avg. steady-state TCE conc. in outlet gas of fluidized bed desorption zone [] | Model value of time-averaged steady-state retention of TCE per unit adsorbent mass on specified tray in moving bed adsorption zone [] | Overall model–expt error in optimized parameters of in-house FVM solver [%] | ||||||
|---|---|---|---|---|---|---|---|---|---|---|---|---|
| Expt. | Model | Expt. | Model | 1A | 1B | 2A | 2B | 3A | ||||
| 1 | 0.3 | 7.5 | 21.85 | 23.94 | 17.76 | 18.14 | 310.51 | 312.41 | 316.50 | 318.64 | 323.16 | 11.71 |
| 2 | 0.3 | 15 | 15.71 | 16.71 | 10.24 | 9.11 | 336.22 | 336.89 | 337.81 | 338.12 | 342.64 | 17.41 |
| 3 | 0.3 | 30 | 6.15 | 6.24 | 5.46 | 4.83 | 399.02 | 399.68 | 400.45 | 400.79 | 402.38 | 13.00 |
| 4 | 0.6 | 7.5 | 114.74 | 100.14 | 35.51 | 32.85 | 314.37 | 317.49 | 321.68 | 325.88 | 337.20 | 20.21 |
| 5 | 0.6 | 15 | 86.74 | 80.82 | 17.76 | 16.71 | 342.21 | 344.48 | 348.39 | 350.12 | 354.51 | 12.73 |
| 6 | 0.6 | 30 | 46.44 | 42.06 | 8.88 | 8.99 | 406.53 | 407.14 | 409.64 | 410.48 | 412.89 | 10.67 |
| 7 | 1.2 | 7.5 | 262.26 | 248.16 | 55.32 | 62.56 | 311.12 | 318.96 | 333.08 | 339.61 | 353.67 | 18.47 |
| 8 | 1.2 | 15 | 240.4 | 222.72 | 28.68 | 31.44 | 346.90 | 349.41 | 356.11 | 360.73 | 370.40 | 16.97 |
| 9 | 1.2 | 30 | 156.4 | 160.20 | 17.07 | 17.08 | 420.61 | 423.32 | 427.81 | 428.93 | 433.18 | 2.49 |
| 10 | 2.4 | 7.5 | 842.1 | 879.81 | 87.42 | 99.91 | 315.70 | 323.15 | 355.07 | 361.76 | 385.50 | 18.77 |
| 11 | 2.4 | 15 | 763.56 | 732.18 | 50.54 | 53.66 | 365.44 | 373.16 | 385.22 | 393.29 | 405.59 | 10.28 |
| 12 | 2.4 | 30 | 615.35 | 591.97 | 26.64 | 29.71 | 444.27 | 447.70 | 454.37 | 458.03 | 465.84 | 15.32 |
| Average value | 14.00 % | |||||||||||
| Expt no. [−] | Feed conc. of TCE | Fluidization vel. ratio [−] | Avg. steady-state TCE conc. in outlet gas of moving bed adsorption zone [] | Avg. steady-state TCE conc. in outlet gas of fluidized bed desorption zone [] | Model value of time-averaged steady-state retention of TCE per unit adsorbent mass on specified tray in moving bed adsorption zone [] | Overall model–expt error in optimized parameters of in-house FVM solver [%] | ||||||
|---|---|---|---|---|---|---|---|---|---|---|---|---|
| Expt. | Model | Expt. | Model | 1A | 1B | 2A | 2B | 3A | ||||
| 1 | 0.3 | 7.5 | 36.88 | 34.20 | 15.03 | 15.42 | 240.21 | 242.12 | 248.71 | 251.01 | 256.12 | 9.86 |
| 2 | 0.3 | 15 | 30.73 | 28.68 | 8.2 | 7.87 | 293.43 | 294.37 | 297.05 | 298.34 | 301.69 | 10.69 |
| 3 | 0.3 | 30 | 19.12 | 16.92 | 4.1 | 4.10 | 321.64 | 321.85 | 323.44 | 323.81 | 326.17 | 11.51 |
| 4 | 0.6 | 7.5 | 124.3 | 117.56 | 32.1 | 27.98 | 241.67 | 245.91 | 253.70 | 261.08 | 271.14 | 18.25 |
| 5 | 0.6 | 15 | 100.4 | 96.54 | 15.71 | 14.59 | 301.11 | 303.27 | 308.03 | 310.87 | 316.29 | 10.97 |
| 6 | 0.6 | 30 | 64.88 | 67.56 | 8.2 | 7.72 | 330.78 | 331.84 | 334.93 | 336.53 | 339.01 | 9.98 |
| 7 | 1.2 | 7.5 | 418.66 | 381.02 | 51.91 | 47.49 | 232.85 | 245.11 | 259.85 | 268.17 | 283.60 | 17.5 |
| 8 | 1.2 | 15 | 305.29 | 293.28 | 28.68 | 26.29 | 305.45 | 309.43 | 316.97 | 324.51 | 333.58 | 12.26 |
| 9 | 1.2 | 30 | 228.79 | 213.12 | 13.66 | 14.31 | 341.98 | 343.36 | 347.09 | 350.67 | 356.86 | 11.61 |
| 10 | 2.4 | 7.5 | 1088.65 | 989.76 | 86.74 | 81.79 | 236.04 | 253.29 | 271.10 | 292.07 | 322.90 | 14.79 |
| 11 | 2.4 | 15 | 924.05 | 882.72 | 40.98 | 43.99 | 318.70 | 320.83 | 326.13 | 329.35 | 365.93 | 11.82 |
| 12 | 2.4 | 30 | 744.43 | 721.68 | 25.27 | 24.33 | 363.55 | 366.06 | 373.39 | 378.39 | 389.80 | 6.78 |
| Average value | 12.17 % | |||||||||||
| Expt no. [−] | Feed conc. of TCE | Fluidization vel. ratio [−] | Avg. steady-state TCE conc. in outlet gas of moving bed adsorption zone [] | Avg. steady-state TCE conc. in outlet gas of fluidized bed desorption zone [] | Model value of time-averaged steady-state retention of TCE per unit adsorbent mass on specified tray in moving bed adsorption zone [] | Overall model–expt error in optimized parameters of in-house FVM solver [%] | ||||||
|---|---|---|---|---|---|---|---|---|---|---|---|---|
| Expt. | Model | Expt. | Model | 1A | 1B | 2A | 2B | 3A | ||||
| 1 | 0.3 | 7.5 | 40.98 | 42.78 | 11.61 | 10.47 | 190.49 | 192.43 | 198.60 | 203.31 | 211.21 | 14.21 |
| 2 | 0.3 | 15 | 34.83 | 36.99 | 6.15 | 6.35 | 206.88 | 229.12 | 246.15 | 257.59 | 277.18 | 9.45 |
| 3 | 0.3 | 30 | 32.1 | 30.77 | 3.41 | 3.76 | 289.37 | 289.89 | 291.58 | 292.07 | 294.67 | 14.40 |
| 4 | 0.6 | 7.5 | 143.42 | 144.58 | 20.49 | 18.13 | 183.67 | 188.17 | 198.34 | 206.77 | 219.37 | 12.33 |
| 5 | 0.6 | 15 | 121.57 | 135.66 | 10.24 | 9.45 | 241.08 | 241.95 | 244.83 | 246.38 | 250.88 | 19.3 |
| 6 | 0.6 | 30 | 116.1 | 109.86 | 5.46 | 4.98 | 293.36 | 293.72 | 296.31 | 298.04 | 302.90 | 14.16 |
| 7 | 1.2 | 7.5 | 502.66 | 467.52 | 34.15 | 31.81 | 175.37 | 187.47 | 205.06 | 214.19 | 234.22 | 13.84 |
| 8 | 1.2 | 15 | 312.8 | 319.32 | 17.76 | 16.23 | 242.43 | 244.79 | 248.07 | 251.98 | 259.83 | 10.69 |
| 9 | 1.2 | 30 | 262.26 | 280.24 | 9.56 | 8.96 | 302.72 | 304.88 | 311.07 | 316.80 | 325.38 | 13.14 |
| 10 | 2.4 | 7.5 | 1223.88 | 1375.72 | 46.44 | 44.69 | 181.78 | 189.01 | 217.61 | 238.47 | 270.87 | 16.18 |
| 11 | 2.4 | 15 | 1105.04 | 1217.08 | 25.27 | 24.63 | 272.38 | 277.15 | 289.11 | 295.03 | 314.31 | 12.67 |
| 12 | 2.4 | 30 | 1045.62 | 1107.32 | 12.98 | 13.14 | 336.02 | 338.81 | 346.44 | 350.61 | 361.53 | 7.13 |
| Average value | 13.13 % | |||||||||||
| Expt no. [−] | Feed conc. of TCE |
Fluidization vel. ratio [−] |
Steady-state TCE removal efficiency of IRFB for particle size of 355 µm [%] |
Steady-state TCE removal efficiency of IRFB for particle size of 500 µm [%] | Steady-state TCE removal efficiency of IRFB for particle size of 710 µm [%] | |||
|---|---|---|---|---|---|---|---|---|
| Expt. | Model | Expt. | Model | Expt. | Model | |||
| 1 | 0.3 | 7.5 | 92.72 | 92.02 | 87.71 | 88.6 | 86.34 | 85.74 |
| 2 | 0.3 | 15 | 94.76 | 94.43 | 89.76 | 90.44 | 88.39 | 87.67 |
| 3 | 0.3 | 30 | 97.95 | 97.92 | 93.63 | 94.36 | 89.30 | 89.74 |
| 4 | 0.6 | 7.5 | 80.88 | 83.31 | 79.28 | 80.41 | 76.10 | 75.90 |
| 5 | 0.6 | 15 | 85.54 | 86.53 | 83.27 | 83.91 | 79.74 | 77.39 |
| 6 | 0.6 | 30 | 92.26 | 92.99 | 89.19 | 88.74 | 80.65 | 81.69 |
| 7 | 1.2 | 7.5 | 78.15 | 79.32 | 65.11 | 68.25 | 58.11 | 61.04 |
| 8 | 1.2 | 15 | 79.97 | 81.44 | 74.56 | 75.56 | 73.93 | 73.39 |
| 9 | 1.2 | 30 | 86.97 | 86.65 | 80.93 | 82.24 | 78.10 | 76.65 |
| 10 | 2.4 | 7.5 | 64.91 | 63.34 | 54.64 | 58.76 | 49.01 | 42.68 |
| 11 | 2.4 | 15 | 68.19 | 69.49 | 61.50 | 63.22 | 53.96 | 49.29 |
| 12 | 2.4 | 30 | 74.36 | 75.33 | 68.98 | 69.93 | 56.43 | 53.86 |
| Average value | 83.06 % | 83.56 % | 77.38 % | 78.70 % | 72.51 % | 71.25 % | ||
4.1 Effect of Operating Parameters on Steady-State Solid Recirculation Rate
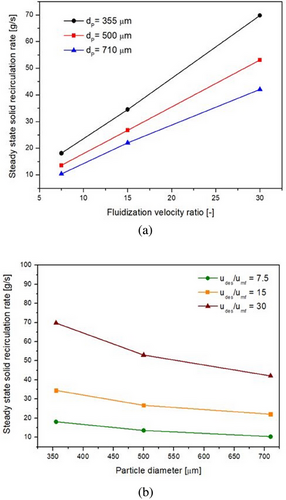
It is evident from Fig. 9a,b as well as Eq. (42) that the steady-state solid recirculation rate is more sensitive toward changes in fluidization velocity ratio than changes in particle diameter. Furthermore, the sensitivity of with changes in particle diameter decreases with an increase in particle diameter but increases with an increase in fluidization velocity ratio, whereas the sensitivity of to changes in the fluidization velocity ratio more or less remains the same as fluidization velocity ratio increases but decreases slightly as particle diameter increases. This may be due to the larger difference between terminal velocities of 355 and 500 µm particles as compared to the difference between terminal velocities of 500 and 710 µm particles. Thus, within the set of operating parameters, a high fluidization velocity ratio and a low particle diameter are optimal for a steady-state solid recirculation rate in the IRFB prototype.
4.2 Effect of Operating Parameters on Steady-State TCE Retention on Trays 1A–3A
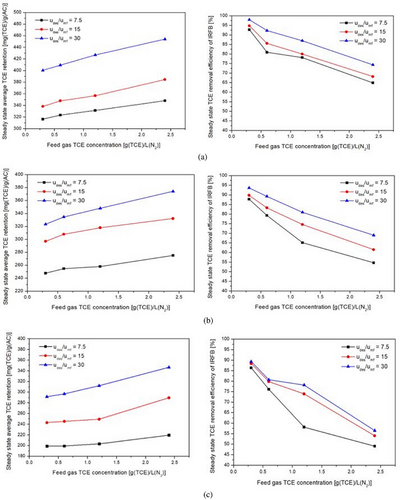
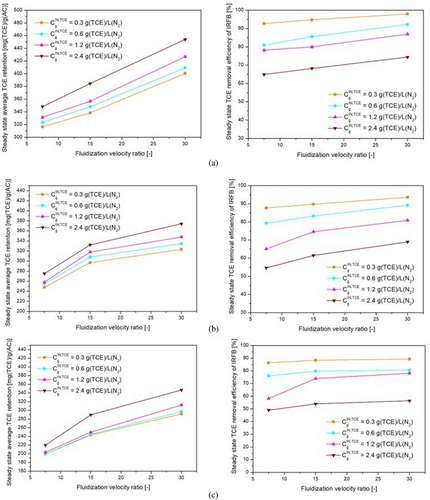
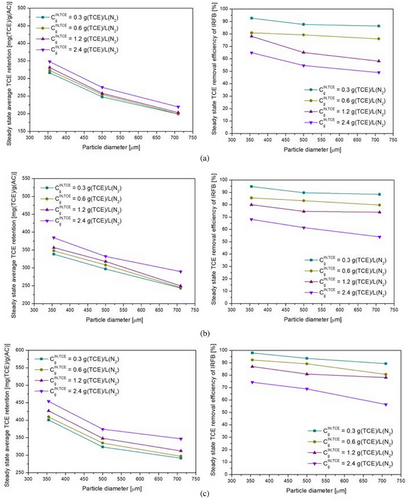
The left-side plots shown in Figs. 10a–c, 11a–c, and 12a–c depict the variation of average steady-state TCE retention on Trays 1A–3A with feed gas TCE concentration, fluidization velocity ratio, and particle diameter, respectively. The steady-state TCE retention is a strong function of feed gas TCE concentration, particle diameter, and fluidization velocity ratio. The steady-state TCE retention lies within 310–450 mg (TCE) g−1(AC) for 355 µm particles, 240–380 mg (TCE) g−1(AC) for 500 µm particles, and 200–340 mg (TCE) g−1(AC) for 710 µm particles. This is due to higher micro-pore volume and BET surface area for 355 µm particles as compared to 500 µm particles and subsequently higher micro-pore volume and BET surface area for 500 µm particles as compared to 710 µm particles [57]. Steady-state TCE retention increases with increase in feed gas TCE concentration for all fluidization velocity ratios and particle diameters. This is due to an increase in driving force for inter-phase mass transfer. From Fig. 10a–c, it can be inferred that the sensitivity of steady-state TCE retention with changes in feed gas TCE concentration decreases with an increase in particle diameter but is more or less the same for changes in fluidization velocity ratio and feed gas TCE concentration. From Fig. 11a–c, it can be inferred that steady-state TCE retention increases with an increase in the fluidization velocity ratio. Higher fluidization velocity ratio leads to higher solid recirculation rate, which in turn leads to a greater number of particles getting exposed to gas having a concentration at near feed gas TCE concentration. The sensitivity of steady-state TCE retention with changes in fluidization velocity ratio decreases with an increase in particle diameter, whereas it is more or less the same with changes in feed gas concentration. With an increase in udes/umf from 7.5 to 30, the average TCE retention on Trays 1A–3A increases by around 25–30 % for 355 µm particles, 30–37 % for 500 µm particles, and by 45–60 % for 710 µm particles. Steady-state TCE retention is more sensitive to changes in fluidization velocity ratios at lower fluidization velocity ratios. From Fig. 12a–c, it can be inferred that steady-state TCE retention decreases with an increase in particle diameter, and its sensitivity to changes in particle diameter does not change much with changes in fluidization velocity ratio and feed gas TCE concentration.
4.3 Effect of Operating Parameters on Overall TCE Removal Efficiency
The TCE concentration at down-comer outlet can be used to obtain removal efficiency by using Eq. (35). It can be inferred from empirical correlation (Eq. 43) and right-side plots of Figs. 10-12 that the outlet TCE concentration from down-comer region and therefore the overall TCE removal efficiency of IRFB is a strong function of all the operating parameters. From Eq. (43), it can be observed that TCE concentration in down-comer outlet (and therefore removal efficiency as per Eq. (35)) is most sensitive to changes in particle diameter, then feed gas TCE concentration, and then fluidization velocity ratio. From Fig. 10a–c, it can be observed that TCE removal efficiency decreases with an increase in feed gas TCE concentration. This implies that for higher feed gas TCE concentrations, initially, even though the inter-phase mass transfer is high due to high driving force, the driving force decreases at a faster rate due to the high rate of particle saturation in down-comer region as compared to lower feed gas TCE concentrations. The sensitivity of overall TCE removal efficiency with changes in feed gas concentration is higher at low fluidization velocity. From Fig. 11a–c, it can be observed that TCE removal efficiency increases with increasing fluidization velocity. As fluidization velocity increases, due to higher solid recirculation rate, the number of particles with lower TCE retention is higher in the down-comer region at any given time instant. Furthermore, the enhancement in inter-phase heat and mass transport characteristics at higher fluidization velocities in draft tube region leads to more efficient reduction of TCE retention throughout the draft tube region, which in turn leads to recirculation of more particles with lower TCE retention, thus leading to higher removal efficiency in down-comer region. From Fig. 12a–c, it can be observed that steady-state TCE retention decreases with an increase in particle diameter. This is due to an increase in intra-particle diffusion resistance with an increase in particle diameter. The sensitivity of TCE removal efficiency to changes in particle diameter is more prominent at higher feed gas TCE concentrations at all fluidization velocity ratios. At high TCE concentration and higher particle diameter, both the faster occupation of surface pores by adsorbed TCE and the slower intra-particle diffusion rate contribute to a decrease in the removal efficiency of TCE in down-comer region. Thus, within the set of operating parameters, a high fluidization velocity ratio, low particle diameter, and low inlet concentration of TCE in feed gas are optimal for steady-state TCE removal efficiency of IRFB prototype.
4.4 Mesh Sensitivity and Grid Independency Criterion
The comparative plot for results of OpenFOAM CFD solver and experimental results for average void fraction at the desorption column outlet is shown in Fig. 13a. The comparative plots of the in-house FVM solver and experimental results for the TCE concentration in outlet gas from the moving bed adsorption zone and fluidized bed desorption zone are shown in Fig. 13b,c, respectively. Various 2D grid-sizes were used for both OpenFOAM CFD solver and in-house FVM solvers, as shown in Fig. 14a,b, respectively. It can be inferred that the mesh sensitivity of both the twoPhaseEulerFoam solver and in-house FVM solver is high at lower grid-sizes for all three particle sizes. The grid-size at which further refinement leads to a trivial increase in model accuracy is said to satisfy the grid independency criterion. From Fig. 14a, it can be inferred that the mesh sensitivity of the overall model–experimental error becomes negligible upon further refinement from 90 × 300 grid-size for 710 µm particles, 120 × 350 grid-size for 500 µm particles, and 150 × 750 grid-size for 355 µm particles, respectively. These grid-sizes therefore satisfy the grid-independency criterion for twoPhaseEulerFoam solver. From Fig. 14b, it can be inferred that the mesh sensitivity of the overall model–experimental error becomes negligible upon further refinement from 50 × 75 grid-size for 710 µm particles, 60 × 110 grid-size for 500 µm particles, and 60 × 150 grid-size for 355 µm particles, respectively. These grid-sizes therefore satisfy the grid-independency criterion for the in-house FVM solver.

5 Conclusion
To overcome the inherent limitations of cyclic adsorption systems, a prototype of IRFB has been developed to achieve continuous operation of moving bed adsorption and fluidized bed desorption in a single-process equipment. In the present study, IRFB technology based on activated carbon particles as adsorbent material has been established successfully for continuous removal and simultaneous recovery of TCE. The dependency of operating parameters on various internal aspects of IRFB has been established. For the set of operating parameters employed in the present work, it has been found that the solid recirculation rate varies from 10 to 70 g s−1, the average steady-state retention of TCE on trays in the moving bed adsorption zone varies from 199 to 454 mg (TCE) g−1(AC), and finally, the overall average TCE removal efficiency varies from 49 % to 98 %. The model developed in the present work can predict the solid circulation rate and TCE removal efficiency of the IRFB prototype with an average overall percentage error of 15 %. From the present work, the inferences for cost and energy consumption considerations with respect to scalability and industrial applicability of the IRFB prototype employing Geldart “B” class activated carbon and deployed for continuous VOC removal from gaseous streams are as follows. In terms of capital costs, IRFB is economically more viable for handling high flow rates of VOC-containing effluent gas streams than externally recirculating systems, as it does not require external cyclones, risers, and other auxiliary equipment such as heat exchangers. The design of IRFB should always ensure that the down-comer region operates in either the minimum or the bubbling fluidization regime, whereas the draft tube region operates in the turbulent fluidization regime. For any operating IRFB, the maximum flow rate of VOC-containing gas is limited by the cross-sectional area of down-comer region, which is in turn limited by the economic viability of fabrication costs. The maximum flow of fluidizing gas inlet to draft tube is limited by the onset of a decrease in recirculating particles accompanied by an increase in carry-over of entrained particles to the IRFB outlet and also by the stable achievable discharge temperature at the outlet of pre-heating systems throughout the total operating time. Carry-over of entrained particles to IRFB outlet can hamper the operation of the condenser used for subsequent recovery of VOC. The fluidizing gas flow should optimize the energy input to pre-heating systems and the compressor systems with VOC removal constraints and operating costs. The minimum fluidizing gas flow should ensure sufficient entrainment and recirculation of particles from draft tube to down-comer region. The maximum concentration of VOC in feed gas is limited by the maximum operating entrainment rate and static adsorbent inventory in draft tube and also by safety considerations such as ventilation and permissible exposure limits. However, the minimum VOC concentration should ensure the presence of driving force throughout the down-comer region. The draft tube height and static inventory in draft tube should ensure that slugging fluidization does not occur at the top outlet of draft tube region. Thus, it is certainly possible to design an IRFB technology that can achieve a robust, efficient, safe, and economically viable operation for continuous removal of VOCs from gaseous streams, provided that it operates within an optimal set of process parameters.
Acknowledgments
The authors are thankful to Shri. C. A. Shinde and Shri. S. Y. Sarang for their constant supervision and assistance in the experimental studies. The authors are grateful to Head, Alkali Material & Metal Division for the most valued guidance and support. The authors are especially thankful to Shri. S. R. Satre for providing and maintaining the necessary instrumentation tools and constantly monitoring the safety aspects of the experiments.
Symbol used
-
-
- [g s−1]
-
-
- [mg (TCE) g−1(AC)]
-
- Atray
-
- [m2]
-
-
- [g L−1]
-
-
- [g L−1]
-
-
- [g L−1]
-
-
- [g L−1]
-
- Dbed/Rbed
-
- [m]
-
- Hbed
-
- [m]
-
- Htray
-
- [m]
-
- Tambient
-
- [K]
-
- Tgas
-
- [K]
-
- Tsolid
-
- [K]
-
- dP
-
- [m]
-
- mdc
-
- [kg]
-
- mtot
-
- [kg]
-
- mtray
-
- [kg]
-
-
- [m]
-
- tnet
-
- [s]
-
- udes
-
- [ms−1]
-
-
- [m]
-
-
- [m]
-
- μair
-
- [kg m−1 s−1]
-
- ρS
-
- [kg m−3]
-
-
- [–]
-
-
- [–]
-
- Δtexpt
-
- [s]
-
- ΔtFVM
-
- [s]
-
- ΔtOpenFOAM
-
- [s]
Greek letter
-
- α
-
- [–]
-
- β
-
- [–]
-
- γ
-
- [–]
-
- δ
-
- [–]
-
- ζtray
-
- [–]
Abreviations
-
- AC
-
- Activated carbon
-
- CFD
-
- Computational fluid dynamics
-
- DC
-
- Desorption column
-
- FBDZ
-
- Fluidized bed desorption zone
-
- FVM
-
- Finite volume method
-
- IRFB
-
- Internally recirculating fluidized bed
-
- MBAZ
-
- Moving bed adsorption zone
-
- TCE
-
- Trichloroethylene
-
- VOC
-
- Volatile organic compound


