Exploiting Ternary Solubility Phase Diagrams for Resolution of Enantiomers: An Instructive Example
Abstract
Ternary phase diagrams are essential research tools in several scientific fields. They provide fundamental understanding and guidance in designing separation experiments. While their utility and relevance is undisputed in the chemical and chemical engineering community, yet much progress remains to be done in understanding and exploiting ternary phase diagrams for crystallization-based chiral separation purposes. A guide in the interpretation of the ternary solubility phase diagram of a chiral molecule to design the separation of its enantiomers is provided. On the basis of the discussion of fundamental relationships in the phase diagram, basic enantioseparation experiments are performed for D-/L-methionine in water exploiting the characteristic shift of the eutectic composition in the chiral system. The rational approach followed in separation process design is described together with the experimental procedures applied and the results obtained.
1 Introduction and Background
Chirality (from Greek “kheir = hand”) is the non-identity property of mirror images 1. It is a geometrical property of those molecules that have neither planes nor center of symmetry. A molecule and its mirror image are called enantiomers. Clear evidences show that two enantiomers of the same chiral substance can have vastly different effects when interacting with biological environment, hence the production of pure enantiomers has gained tremendous interest for the food and agrochemical industries, and in particular for the pharmaceutical industry 2.
Separation of enantiomers cannot be performed through conventional separation techniques such as distillation, extraction, and achiral chromatography, as they exhibit same physicochemical properties except for the optical activity. Louis Pasteur initiated the investigation of optical activity as property of the molecules, becoming the first to accomplish the resolution of an optically active compound. Pasteur's studies on tartaric acid and its derivatives and, in particular, the resolution of the sodium ammonium salt of tartaric acid (Figs. 1a, b) constitute a truly pioneering work that has had a profound influence on several scientific fields 3.
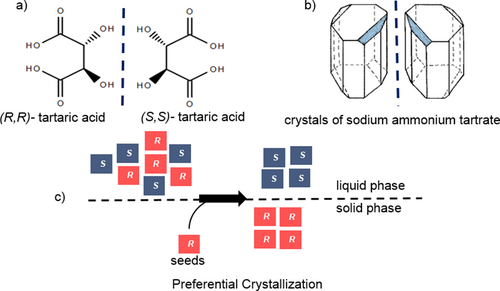
In 1866, one of Pasteur's students discovered the resolution by entrainment today known as preferential crystallization 4. Among all the possible approaches to provide pure enantiomers 2, 5-7, preferential crystallization is a widely applicable, simple, and cost-efficient approach that leads to direct separation of enantiomers without the need of a chiral auxiliary 4. It consists in isolation of a pure enantiomer from a supersaturated solution of the racemic conglomerate using seeding with the desired enantiomer (Fig. 1c) 8, 9.
Although extensive research has been devoted to study and apply crystallization processes for enantioseparation purposes, the potential of this technique is still unacknowledged by much of the scientific community. Essential tools to design preferential crystallization experiments are the fundamental solid-liquid equilibrium data expressed in melt phase diagrams 10. Fig. 2 shows a general representation of such composition-temperature diagrams. They i.a. provide information about the presence and composition of eutectic(s) and hence about the type of the crystalline racemic phase: conglomerate, racemic compound or solid solution 1.
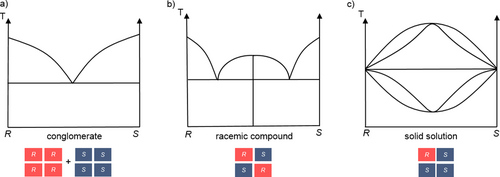
An equimolar mixture of two crystalline enantiomers that are mechanically separable is called conglomerate. This mixture exhibits a characteristic melt phase diagram with one eutectic at racemic composition (Fig. 2a). A racemic compound is a single solid phase in which the two enantiomers coexist in the same unit cell in 1:1 ratio in an ordered structure and its melt phase diagram contains two eutectic points (Fig. 2b). In solid solutions, being single phases too (so-called mixed crystals), the two enantiomers can mutually incorporate each other in their unit cell but disordered and also non-stoichiometrically (Fig. 2c).
Crystalline enantiomeric systems can be categorized by the observation of their melt phase diagrams, while their solution phase properties in addition are illustrated by solubility phase diagrams of the enantiomers in a solvent (Fig. 3) 11-13. The resulting triangular representations illustrate the fractions of the three components of interest in both solid and liquid phases (Fig. 3). Such ternary phase diagrams are widely used in designing purification processes by, e.g., distillation or extraction 14-16. The application of those diagrams is less frequent in designing crystallization-based enantioseparation processes.
As the majority of the enantiomeric systems belongs to the group of racemic compounds (i.e., ∼ 90 %) and conglomerates (∼ 5–10 %), we will show the ternary phase diagram of these two categories only.
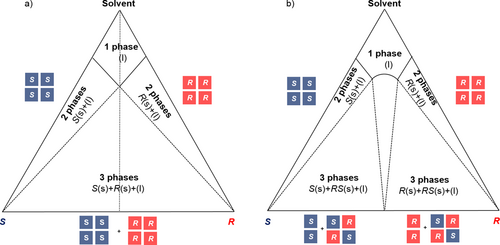
Conglomerate-forming systems exhibit the highest solubility at the eutectic (racemic) composition and a V-shaped form of the solubility isotherm, symmetrical with respect to the racemate-solvent line (dotted line) (Fig. 3a). Within the ternary phase diagram, the thermodynamic stable phases can be identified as follows: above the eutectic composition, only one liquid phase is thermodynamically stable, consisting of a solution that contains both enantiomers dissolved in the solvent. Below the V-shaped solubility isotherm, the two-phase domains within the axes and the equilibrium tie lines (dashed lines, Fig. 3a) consist of a saturated solution phase of varying composition and a solid pure enantiomer phase (S or R). In the corresponding three-phase domain two solid phases, i.e., a solid mixture of both enantiomers at varying composition, and a saturated solution of eutectic (racemic) composition are coexisting equilibrium phases.
For a racemic compound-forming system (Fig. 3b), two different scenarios are possible for the two-phase domains, one consisting in a saturated solution with a racemic solid phase in equilibrium and one consisting in a saturated solution with one of the pure enantiomers as solid phase in equilibrium. In the corresponding three-phase domain, a mixture of two solid phases, pure enantiomer (S or R) and racemic compound (RS), coexists with a saturated solution of eutectic composition.
The driving force that leads to the formation of a new phase is the supersaturation, defined as the difference in the chemical potential of the new crystalline phase in the supersaturated solution, and the saturated solution at equilibrium 17. For non-dissociated substances in solution the thermodynamic driving force can be approximated to the difference between the concentration of the supersaturated solution and that of the saturated solution at the equilibrium state. In case of crystallization from solution, supersaturation is created by placing the system out of its equilibrium, i.e., by exceeding the solubility line. Hence, crystallization processes can be induced by decreasing the temperature, evaporating the solvent or adding an antisolvent. Further, vacuum and reactive crystallization are used.
In the present work, for a pharmaceutically relevant amino acid, D-/L-methionine, two strategies are demonstrated for production of a pure enantiomer exploiting typical characteristics of the ternary phase diagram. Specifically, methods of targeted solvent evaporation and selective addition of solvent to a solid mixture of enantiomers are applied. Emphasis will be put on highlighting the important role of knowing and exploiting the specific eutectic compositions.
2 Experimental and Rational Process Design Part
2.1 Chiral System and its Phase Diagram
Methionine (Met) is a proteogenic sulfur-containing amino acid which is essential for life. In organisms, it can serve as precursor of cysteine 18. The racemate is used as additive in animal feed, while L- and D-Met enantiomers find pharmaceutical application as liver protection agent and as otoprotective agent, respectively 19, 20. Methionine is known to be a racemic compound-forming system 21. Solubilities in the ternary D-Met/L-Met/water system have been experimentally determined in a previous work by Polenske et al. 22. Fig. 4 shows the resulting ternary solubility phase diagram at different temperatures between 1 °C and 60 °C. It reveals mirror image symmetry with respect to the racemic axis (dashed line, Fig. 4).
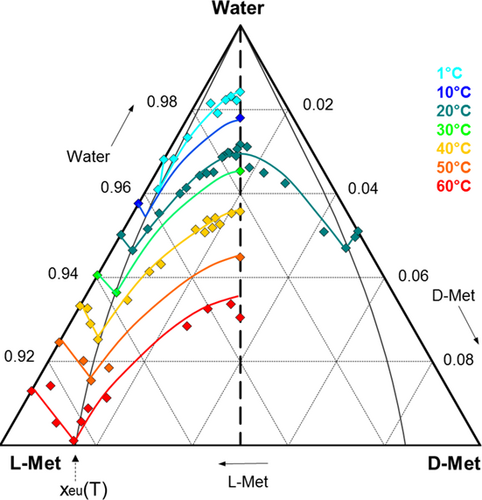
The solubility increases with the temperature, exhibiting higher values for the enantiopure than for the racemic compound. Starting at the pure enantiomer side and following the isotherm lines, the solubility increases reaching a maximum at eutectic composition, xeu, and decreases afterwards until a minimum value at racemic composition. A specific feature is the fact that the eutectic composition in the chiral system moves to lower enantiomeric excesses with higher temperature, specifically from xeu = 0.94 at T = 1 °C to xeu = 0.86 at T = 60 °C. Furthermore, methionine solubilities in water are found to be low, occupying only the upper 10 % of the triangle diagram.
2.2 Separation Process Design on the Phase Diagram Basis
Derived from the above-given thermodynamic characteristics of the system, two separation strategies will be demonstrated in the following: (1) evaporation of solvent from the initial solution at eutectic composition and (2) addition of solvent to an enantiomerically enriched solid mixture, in both cases making use of the solubility isotherms at 1 °C and 60 °C (Fig. 4). Principally, the separation process design is based on exploitation of the basic mass balances and the trajectory of the eutectic lines in the phase diagram. Main emphasis is laid on illustration and understanding of the relations in the phase diagram which are required for separation process design. The fundamental mass balances necessary for quantitative exploitation of the phase diagrams are not addressed in detail but are focus of other related works 23-25. Both separation strategies will be illustrated on a couple of experiments leading to different separation results.
2.2.1 Strategy 1: Evaporation of Solvent
The separation experiments exploiting the evaporation method were carried out in a 300-mL crystallizer equipped with a Teflon-coated propeller type stirrer and thermostated for temperature control. A Pt 100 sensor allowed measuring the temperature during the process. The vessel was equipped with a reflux condenser to allow the condensation of the vapors, and was connected to a flask located on a scale in order to monitor the amount of solvent removed from the initial solution. Two different experiments have been performed and their schematic representation is presented in Fig. 5. The initial point of the separation process corresponds to a solution of methionine enantiomers in water, at eutectic composition corresponding to xeu = 0.94 (Fig. 5, blue points). The solution was heated to 60 °C and concentrated by evaporation of the solvent at 190 mbar until the desired solvent content was reached (points 1 and 2, in Figs. 5a and b, respectively). The obtained suspension was filtrated under vacuum and the gained solid phase analyzed by HPLC.
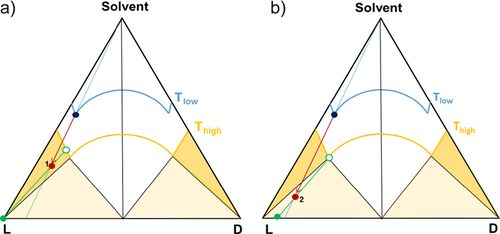
By varying the amount of water to evaporate during the process, the system can be located in either the two-phase region or the three-phase region, yielding a different purity of the solid phase (Fig. 5). The first experiment consisted in crystallizing solely the target enantiomer L-Met from the solution, hence, from the initial enantiomerically enriched solution 170 mL water has been evaporated leading the system L-Met/D-Met/water in the outer left biphasic domain (red dot 1 in dark yellow region, Fig. 5a). Following this procedure, a further experiment was performed with the intention to locate the system into the three-phase region, thus demonstrating the potential of the knowledge of the ternary phase diagram in designing the separation process. Starting from a solution of Met enantiomers in water at the same composition as for the first experiment (blue dot in Fig. 5b), more than 200 mL of water now was evaporated. The resulting system corresponds to the red dot 2 in Fig. 5b. The solid phase composition of the resulting systems is represented by the green dots on the triangle bottom line in Fig. 5, representing the binary L-/D-enantiomer system, while the corresponding liquid phase compositions refer to the green empty dots on the solubility isotherm at the used temperature (Thigh, 60 °C here).
2.2.2 Strategy 2: Addition of Solvent
The experiments were carried out in 20-mL vials equipped with a magnetic stirrer bar and located in a 200-mL double-wall vessel connected to a thermostat for temperature control. The starting point of the experiments was a solid mixture of L- and D-Met of composition xeu = 0.94. As illustrated in Fig. 6, by adding a calculated amount of water at constant temperature (Thigh = 60 °C) to the initial solid mixture (blue dot, Fig. 6), it is possible to place the overall system either in the three-phase region (Fig. 6a) or in the two-phase region (Fig. 6b) of the corresponding solubility isotherm.
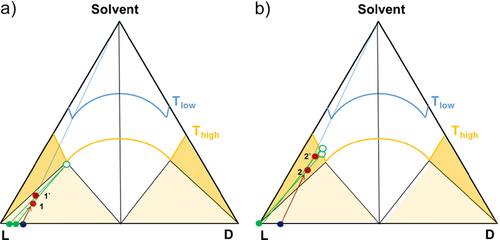
Fig. 6 displays two different sets of experiments performed following the method of addition of solvent. The points labeled 1 and 1′ correspond to two replicates adding different amounts of water but remaining in the three-phase region. It can be observed that when the system is placed in the three-phase region, the mother liquor composition is fixed at the eutectic composition on the solubility isotherm, while the enantiomeric L-/D- composition of the solid phase can vary. On the other hand, when the system is placed in the two-phase region (Fig. 6b), the separation yields always pure solid enantiomer, while the composition of the saturated liquid phase given on the related solubility isotherm can vary. After addition of the desired amount of water and equilibration at 60 °C under stirring, the solution was filtrated under vacuum and both, solid and liquid phase, were analyzed by HPLC for composition.
3 Results and Discussion
3.1 Selective Crystallization of L-Met by Evaporation of Solvent (Strategy 1)
A mixture of D-Met and L-Met at eutectic composition xeu = 0.94 was weighed and dissolved in 300 g of deionized water at constant temperature of T = 60 °C. After complete dissolution of the solid, 170 g and more than 200 g of water are evaporated, respectively in experiments 1 and 2 as quantitatively shown in the ternary L-Met/D-Met/water phase diagram (Fig. 7). It illustrates the experimental trajectories of the overall processes. The starting point of both experiments is represented by the blue dot on the eutectic composition of the solubility isotherm at 1 °C. Then, the evaporation of 170 g of deionized water in experiment 1 led the system in the two-phase region (red dot 1, Fig. 7). HPLC analysis of the solid phase proved a purity of > 99.9 % L-Met. The evaporation of a higher amount of water in experiment 2 put the system on the boundary of the three-phase region (red dot 2, Fig. 7) and HPLC analysis defined the purity of the separated solid phase to 96 % L-Met.
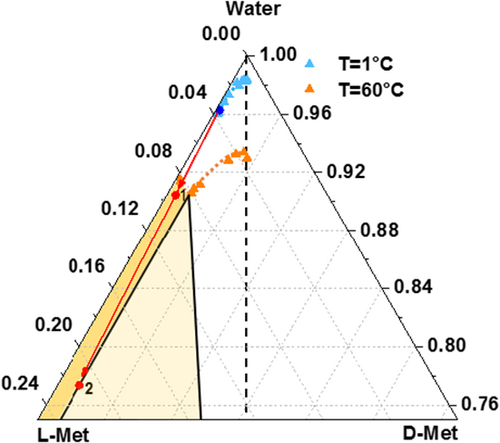
The experimental results clearly demonstrate how the understanding of the ternary phase diagrams for the studied system allows a rational design of the separation process. The evaporation of a predetermined amount of water permits to predict not only the phase domain in which the system is eventually placed, but also its purity within the three-phase domain. Furthermore, the shift of the eutectic composition with the temperature has been systematically exploited to provide a pure enantiomer from an enantiomerically enriched L-Met/D-Met mixture, although the system is of racemic compound-forming type.
3.2 Separation of Methionine Enantiomers by Addition of Solvent (Selective Dissolution, Strategy 2)
Following the strategy of addition of solvent, two sets of experiments, aimed to demonstrate phase behavior in the three-phase and two-phase region, respectively, have been performed. Tab. 1 summarizes the experimental conditions of the first set of experiments labeled 1 and 1′. Starting from a solid L-Met/D-Met mixture of the composition xeu = 0.94 (blue dot, Fig. 8a), a calculated amount of water was added at constant temperature (T = 60 °C) until a total concentration of 30 wt % for experiment 1 and 25 wt % for experiment 1′ was reached.
|
Experiment |
1 |
1′ |
|---|---|---|
|
Mass DL-Met [g] |
0.25 |
0.20 |
|
Mass L-Met [g] |
1.88 |
1.46 |
|
Solution concentration [wt %] |
30 |
25 |
The overall composition is represented by the red dots 1 and 1′ in the three-phase region of the ternary phase diagram in Fig. 8. The green dots at the triangle bottom line of the diagram (Fig. 8a) represent the composition of the solid phases of the two experiments after solid-liquid phase separation, while the corresponding liquid phase compositions refer to the green empty dot on the solubility isotherm at 60 °C (Figs. 8a, b).
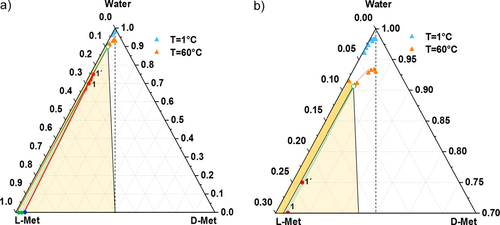
HPLC analysis of the solid phases and the mother liquor provided purities of 96.3 % L-Met and 99.1 % L-Met for the solid phase and 85.7 % L-Met for the mother liquor, respectively, for experiment 1 and 1′. The results indicate that by placing the system in the three-phase domain, the maximum enantiomeric enrichment expected for the liquid phase corresponds to the eutectic composition at the operating temperature (xeu = 0.86 at T = 60 °C) while an upgrade of the enantiomeric enrichment in the solid phase can be achieved according to the corresponding tie line reached at this temperature.
The second set of experiments, aimed to investigate the two-phase domain, consists in two experiments labeled 2 and 2′ (Tab. 2).
|
Experiment |
2 |
2′ |
|---|---|---|
|
Mass DL-Met [g] |
0.01 |
0.08 |
|
Mass L-Met [g] |
0.71 |
0.54 |
|
Solution concentration [wt %] |
14 |
11 |
After the addition of a calculated amount of water to the initial enantiomerically enriched solid mixture (xeu = 0.94), the system is placed into the two-phase domain, reaching a total concentration of 14 wt % for experiment 2 and 11 wt % for experiment 2′ (red dots in the two-phase domain in Fig. 9). The HPLC analysis confirmed the production of pure L-Met (> 99.9 %) at the solid state in both experiments 2 and 2′, while the liquid phase resulted enriched to 91.1 % and 93.3 % of L-Met, respectively, for the experiment 2 and 2′ (green empty dots, Fig. 9). As demonstrated, always pure enantiomer is produced within the two-phase domain, while the maximum achievable purity in the liquid phase is defined by the overall composition of the initial solid in water mixture.
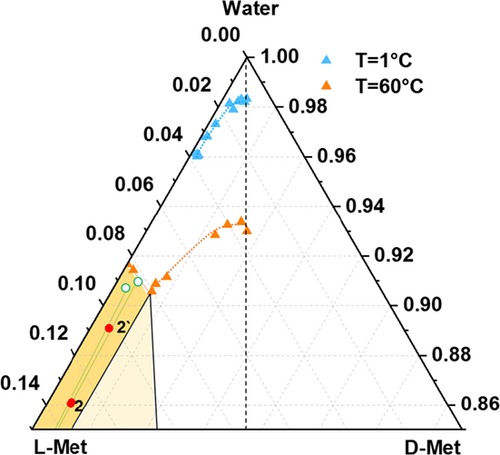
The results presented are in full agreement with the theoretical description of the process provided in Sect. 2.2 (Figs. 6a, b), hence demonstrating the power of a detailed interpretation and rational exploitation of the experimental ternary solubility diagram for separation purposes.
4 Conclusions
The present contribution illustrates and supports the comprehension and exploitation of ternary solubility phase diagrams, with an emphasis on the solution and solid phase properties within two different types of phase domains, namely two- and three-phase domains, respectively. By rational interpretation of the phase diagram two separation strategies for the system L-Met/D-Met in water were derived. One is based on targeted evaporation, the other on targeted addition of solvent to non-racemic methionine mixtures facilitating separation via enantioselective crystallization or dissolution processes. The characteristic shift of the eutectic composition in the L-Met/D-Met in water system between 1 °C and 60 °C allowed the production of pure enantiomer, following both strategies.
A detailed explanation of basic principles of the ternary phase diagram and their relevance for enantioseparation purposes has been presented. Similarly derived equilibrium-based approaches were already successful to isolate pure enantiomers of other chiral systems 26, 27. Given the importance of phase diagrams in numerous research fields, the guidelines provided here offer a strong basis for other applications.
Acknowledgements
This research received funding as part of a CORE project (October 2016–September 2020) from the Horizon2020 Research and Innovation Program of the European Union under Marie Sklodowska-Curie Grant Agreement No. 722456CORE ITN. The authors thank Peter Schulze and Jacqueline Kaufmann (Max Planck Institute, Magdeburg) for technical assistance and analytical support.
The authors have declared no conflict of interest.
Symbols used
-
- T [°C]
-
temperature
-
- Thigh [°C]
-
higher temperature, 60 °C
-
- Tlow [°C]
-
lower temperature, 1 °C
-
- xeu [–]
-
mass fraction of enantiomers at eutectic composition
Subscript
-
- eu
-
eutectic
Abbreviations
-
- l
-
liquid phase
-
- Met
-
methionine
-
- s
-
solid phase


