Homogeneous Catalyst Recycling and Separation of a Multicomponent Mixture Using Organic Solvent Nanofiltration
Abstract
In homogeneous catalysis, the application of organic solvent nanofiltration (OSN) has become a well-known alternative to common recycling methods. Even though some OSN membranes are commercially available, their classification and the scope of application have to be determined for the specific solvent mixture. The commercial membrane Evoniks DuraMem® 300 was tested in a mixture of ethanol, ethyl acetate, and cyclohexane with magnesium triflate as possible catalyst. The cross permeate fluxes were measured for two transmembrane pressures and the hydrodynamic radii of the components were determined. Some of the components in the ternary mixture are retained, which makes the membrane also suitable for fractioning thereof.
1 Introduction
In the field of homogeneous catalysis, the recycling of catalysts has been the major challenge in the development of new competitive synthesis and processes. Common processes like distillation or extraction often have a straining effect on the catalyst, especially when the solubility is difficult (problematic for the extraction procedure) or the catalyst is highly sensitive to temperature. Since homogeneous catalysts often have a very different structure and very low concentration (xcatalyst << 0.01), processes designed to separate reagents or products are not well-suited. Many efforts have been invested in new ways to make the recyclability of homogeneous catalysts easier. One approach was to change the catalyst, e.g., by immobilization 1. Other approaches focused on the development of new methods which would allow the separation of the catalyst from the reaction mixture 2, 3. The coming of age of polymer membranes and the continuous development of ultra- and nanofiltration led to specialized membranes which have the capability to separate molecules due to their molecular size 4-7.
This technology known as organic solvent nanofiltration (OSN) opened new possibilities for the use and recycling of homogeneous catalysts. To further understand the processes involved in the separation of molecules with different sizes, much effort has gone into the investigation of transport processes with multiple solvents 8, 9 and the separation of polymers of different molecular sizes ranging from 162 to 2000 g mol−1 10-12. When OSN was tested for catalyst recycling, no screening of different solvent compositions was done. Thus, the influence of the different solvent compositions on the catalyst recycling rate was not investigated.
First large-scale industrial applications for OSN have been reported in the field of dewaxing. ExxonMobil uses an OSN refining plant, with a daily output of around 11 500 m3 product, saving up to 20 % of the energy costs, compared to conventional refining systems 13. The separation principle in OSN is of a very complex nature. Depending on the solvent and the solvent-membrane affinity, the prediction of the membrane behavior becomes very difficult. In addition, the size of the molecules is of importance as well as the transmembrane pressure (TMP), the temperature, feed concentration, and the molecules charge. Considering all of this, a fine-tuning of the OSN system to create the desired separation is possible, but a clear prediction of the membrane behavior is of high complexity 4-6, 9, 11, 12, 14-16.
This complex matter leads to many uncertainties regarding the behavior of the different commercially available membranes when in contact with so far untested solvent mixtures 9, 14. To estimate the full potential of OSN, experiments have to be carried out on lab scale with the used reaction mixture. So far, some integrated processes are known in which sophisticated homogeneous catalysts have been recycled in different setups, sometimes involving ionic liquids, thermo-switchable solvents or liquid-liquid extraction steps 17-21.
Herein, the results of the experiments carried out to determine the retention rate of the catalyst in different ternary solvent mixtures are presented. Different catalysts were previously tested for the continuous esterification of ethanol and acetic acid, for the hydrogenation of imides 22, carbon dioxide 23-25 as well as the hydrogenation of ethyl acetate. In an approach to create a biphasic system, cyclohexane was added to the reaction to allow a liquid-liquid extraction previous to the OSN process. To avoid damages to the membrane, acetic acid is not added to the solvent mixture since the membrane is only suitable at pH 7 as stated by Evonik Industries. These results can help other researchers to adopt their processes within the early stages of the process development.
With the information on the effect of the different components on the recycling process, the number of experiments can be further reduced giving more time to focus on the development of the overall process and its scale-up. The provided data might help other researchers involved in the integral understanding of the membrane phenomena to further describe these. The aim is to adapt the solvent composition of the reaction mixture to best suit the downstream processing steps. Therefore, the applicability of OSN is tested, optimal solvent compositions are identified, and standard parameters of the membrane are measured. To implement OSN in the continuous process, the catalyst retention rate has to be higher than 90 % in a single step and has to be able to cope with the reagent stream which is fed in the reactor. Since OSN allows a wide scalability due to spiral-wound membrane modules, the retention rate and the durability of the membrane are of the highest interest.
2 Experimental
2.1 Materials
Ethanol (EtOH), ethyl acetate (EtOAc), and cyclohexane (Cy) are the components of the ternary mixture used in this work. The most important properties of the above-mentioned solvents are summarized in Tab. 1.
|
Solvent |
Formula |
Molecular weight [g mol−1] |
Dynamic viscosity [mPa s] |
Density [kg L−1] |
Viscosity blend number [–] |
|---|---|---|---|---|---|
|
Ethanol |
C2H5OH |
46.07 |
1.20 |
0.789 |
8.468 |
|
Ethyl acetate |
C4H8O2 |
88.11 |
0.44 |
0.894 |
–8.810 |
|
Cyclohexane |
C6H12 |
84.16 |
0.98 |
0.779 |
6.255 |
For the experiments, the commercially available DuraMem® 300 membrane from Evonik Industries was selected. The membrane consists of modified polyimide (PI), creating a solvent-resistant polymeric membrane, designed for usage in OSN applications. It performs best in polar, more specific polar aprotic solvents. The DuraMem® 300 has a molecular weight cut-off (MWCO) of 300 Da which allows 90 % of the solute with a molecular weight of 300 g mol−1 or the size of a styrene oligomer with the weight of 300 Da to be retained by the membrane. This value is determined by Evonik Industries according to the rejection of styrene oligomers dissolved in toluene.
To determine the catalyst retention rate, the Lewis acid magnesium trifluoromethanesulfonate (magnesium triflate (Mg(OTf)2)) was employed. The molecular weight of 322.44 g mol−1 is slightly higher than the MWCO stated by Evonik Industries. It is also one of the less expensive triflate catalysts which still has a higher molecular weight than 300 g mol−1.
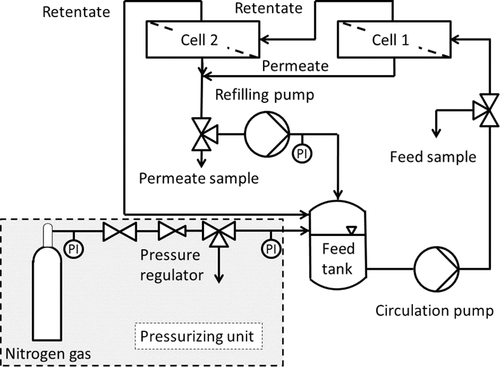
The membrane was tested with the Evonik MetCell® test bench. The piping and instrumentation (P&I) scheme is given in Fig. 1. It consists of two 4'' membrane test cells which are connected in series, a gas pressure control unit to pressurize the system with nitrogen gas, a refilling pump to recycle the permeate for keeping the concentration of the test mixture constant, a gear pump to circulate the feed, as well as a feed tank.
2.2 Experimental Procedure
The Evonik MetCell® cross-flow setup consists of two test cells, which are connected in series, having an active membrane area of 51 cm2 each. The feed is pressurized with gaseous nitrogen. A piston pump is used to recirculate the permeate back into the feed tank to avoid changes in the composition of the mixture during the experiments. The whole mixture is circulated through the test cells with a gear pump. The feed flow rate is about 60 L h−1; according to the Evonik Industries this is sufficient to avoid concentration polarization.
Before starting the experiments, the used membranes had to be flushed with the used solvent mixture containing ethanol, cyclohexane, and ethyl acetate, to wash off production residues. This cleaning step had to be done to ensure the full contact between membrane and solvent. A further washing of the membrane with the respective solvent mixture without the dissolved catalyst had to be performed before each measurement to adjust the membranes to the new solvent and to wash off catalyst residues. The system was emptied and the solvent mixture containing the catalyst was transferred into the system, which was then filled up with the current solvent mixture.
After flushing the membrane in the test cells, the membrane was pressurized for 4 h to reach the steady state. To determine the retention, one permeate sample per test cell and one retentate sample was taken simultaneously every hour for 4 h. The values for the retention presented in this work are averages of the measured retention. To avoid compaction influences on the measurements, the experiments were carried out in order with increasing pressure, first 30 bar, then 50 bar TMP.
2.3 Analytics
 (1)
(1)According to this formula, a higher concentration of the solute in the permeate than in the retentate results in a negative retention rate. Effects like this have already been observed 10 and lead to an enrichment of some of the components.
For the quantification of the catalyst, 19F nuclear magnetic resonance (NMR) spectroscopy was applied. To establish a measurement procedure using only NMR to quantify both the composition of the ternary mixture as well as the catalyst concentration, gas chromatography (GC) helped to verify the results of the 1H NMR measurements.
2.3.1 Determination of the Mixture Composition Using GC
GC was applied to cross-validate the parameters chosen for the NMR analytics. The GC system was a Focus GC system (Thermo Fischer Scientific, MA, USA) with liquid autosampler, split/splitless injection, and flame ionization detector. An Agilent CP-Wax 52 CB column coated with bonded polyethylene glycol (PEG), having 50 m length, 0.20 mm inner diameter, and 0.20 μm thickness, was employed. The injector temperature was 523 K and helium (1.5 bar constant pressure) served as carrier gas; split injection of 1 µL each sample (split ratio 50:1) was done. Temperature program: initial temperature was 323 K, hold for 10 min, followed by a temperature ramp of 12 K min−1 until 473 K; hold time 15 min; total run time 37.5 min. Substances were identified by retention times of the particular compounds. However, the concentration of the catalyst could not be quantified by GC.
 (2)
(2)Each sample was prepared by adding 300 µL of the sample to 1 mL of prepared dodecane in toluene stock solution. The samples were weighed after each step.
2.3.2 Determination of the Mixture Composition Using1H NMR Spectroscopy
To analyze the samples via NMR with the automatization procedure, a preparation of the sample is necessary. The NMR sample was prepared by transferring 400 µL of the sample into an NMR tube. As a lock reference, 100 µL of a prepared mixture, consisting of 24.15 g of deuterated DMSO from Euriso-top with 519.6 mg of 2,3,4,5,6-pentafluorophenol from abcr, was added to the sample in the tube and thoroughly mixed. The 1H NMR analysis of all experiments was done on a Bruker AC 300 from Bruker BioSpin GmbH. The 1H NMR sequence consists of the parameters summarized in Tab. 2.
|
Parameter |
1H NMR |
DOSY NMR |
19F NMR |
|---|---|---|---|
|
Solvent |
DMSO |
DMSO |
DMSO |
|
Temperature [K] |
298 |
298 |
298 |
|
Experiment |
1D |
1D |
1D |
|
Nucleus |
1H |
1H |
19F |
|
Probe |
5 mm PABBO BB-1H/D |
5 mm QNP 1H/13C/31P/19F |
5 mm PABBO BB-1H/D |
|
Z-GRD Z104275/0117 |
Z-GRD Z8660/0001 |
Z-GRD Z104275/0117 |
|
|
Number of scans [–] |
32 |
8 |
64 |
|
Receiver gain [–] |
5.6 |
9.0 |
2050.0 |
|
Relaxation delay [s] |
4 |
5 |
8 |
|
Pulse width [s] |
9.6 |
10.5 |
8.5 |
|
Acquisition time [s] |
7.9692 |
0.9765 |
0.7341 |
|
Spectrometer frequency [MHz] |
299.61 |
600.07 |
281.88 |
|
Acquired size [–] |
65 536 |
4096 |
65 536 |
|
Spectral size [–] |
131 072 |
65 536 |
131 072 |
The feed and the permeate composition can be calculated using the spectra generated from 1H NMR measurements (see an exemplary spectrum (Fig. S1) in the Supporting Information). Note that the molar percentage of the catalyst is very low compared to the molar percentage of the solvent components (EtOH, Cy, EtOAc). Therefore, it is not taken into account for the number of the solvent components, meaning the solvent is considered a ternary mixture. Regarding literature in 1H NMR spectroscopy, the integral area of a peak is directly proportional to the number of nuclei contributing to the signal 26.
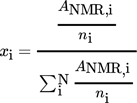 (3)
(3)ANMR,i is defined as the absolute value of the peak area and ni is the number of nuclei contributing to the integral area of component i.
2.3.3 Determination of the Diffusion CoefficientDiof the Components in the Ternary Mixture Using1H Diffusion-Ordered NMR Spectroscopy
To analyze the samples via 1H diffusion-ordered NMR spectroscopy (DOSY), a preparation of the sample is necessary. The NMR sample was prepared in the same way as described in Sect. 2.3.3 for 1H NMR measurements. The DOSY measurements of the samples were done according to the parameters given in Tab. 2. The measurements were performed on the Bruker AC 600 from Bruker BioSpin GmbH.
Since these measurements are very time-consuming, only few samples, which are closest to the mean of the measured sequence, were employed for the DOSY measurements. Because the results from the experiments with 50 bar showed the most promising results, only samples from the 50-bar sequence were chosen. With the DOSY measurements, the diffusion coefficient Di of the components in the ternary mixture could be determined.
2.3.4 Determination of the Catalyst Concentration Using19F NMR Spectroscopy
To analyze the samples via NMR with the automatization procedure, also a sample preparation is necessary. The NMR sample was prepared in the same way as described in Sect. 2.3.3 for 1H NMR measurements. The 19F NMR analysis of all experiments was done with the Bruker AC 300 from Bruker BioSpin GmbH. The 19F NMR sequence consists of the parameters presented in Tab. 2.
 (4)
(4) (5)
(5) (6)
(6)Using the concentration, the retention rate of component i, Ri in percent, can be calculated with Eq. 1.
2.4 Determination of the Hydrodynamic RadiusRH
 (7)
(7) (8)
(8) (9)
(9) (10)
(10) (11)
(11) (12)
(12) (13)
(13)2.5 Determination of the Permeate Flux
 (14)
(14) (15)
(15)where xi denotes the molar fraction of component i in percent and Mi the molecular weight of component i in g mol−1.
3 Results and Discussion
3.1 Permeate Fluxes
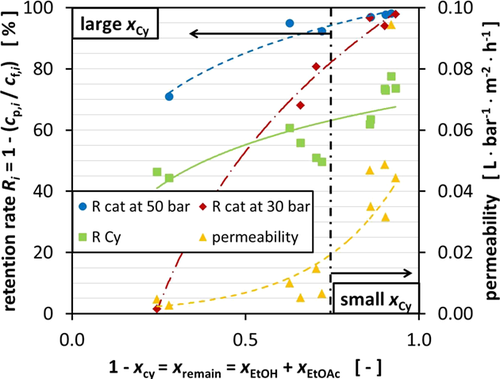
The permeability changes significantly depending on the composition of the mixture used for the experiments which ranged from 2.75 × 10⁻³ to 9.435 × 10⁻² L bar−1m−2h−1. Especially the mixtures containing high amounts of Cy and EtOAc allow only little permeation. Increasing the pressure from 30 to 50 bar, TMP does increase the overall flux across the membrane. Fig. 2 displays the flux for the different mixtures as a function of the pressure and the membrane area on the righthand side (yellow triangle). Only the permeability of the mixture with a very low Cy fraction rises from 4.429 × 10⁻² to 9.435 × 10⁻² L bar−1m−2h−1 with increasing TMP.
Since the DuraMem® membrane performs best in polar, more specific polar aprotic solvents, the decrease in permeability is most likely caused by the increasing fraction of the nonpolar component, in this case Cy 27. Nevertheless, the membrane performance also decreases with increasing fraction of EtOAc, which is classified as polar aprotic solvent.
In an approach to correlate the permeability to the size of the molecules in the ternary mixtures, the hydrodynamic radius of the different components was calculated using the diffusion coefficient (Fig. 3). The results for the diffusion coefficient for the different components can be found in Tab. S1. According to Eq. 7, the hydrodynamic radius was determined after averaging the diffusion coefficient for each component. Considering the separation mechanism of nanofiltration membranes is also dependent on size exclusion as well as pore diffusion, smaller molecules could pass the membrane more easily.
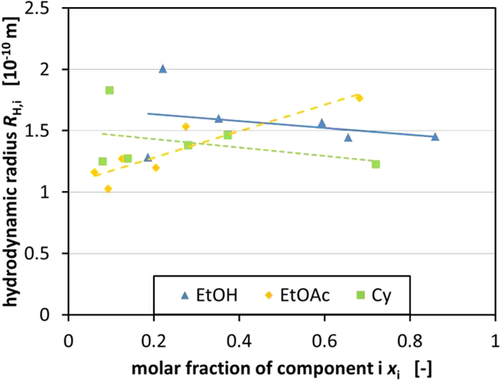
It was possible to get an insight into the change of the hydrodynamic radius of a certain substance depending on its molar fraction in the ternary mixture. A tendency can be seen for EtOH and Cy. In both cases, the molecules' hydrodynamic radius decreases with increasing molar fraction of the component in the mixture, respectively (Fig. 3). For EtOAc, a contrary trend can be seen due to the intermolecular influences of the molecules. The fact that EtOH follows the trend of Cy can be caused by the fact that EtOH has the tendency to form dimers in the presence of nonpolar solvents, especially if water is absent. However, this could not be verified via NMR spectroscopy so far and has to be further investigated to prove this hypothesis 28-30. The change in the composition of the solvent mixture alters the diffusion coefficient of the different components leading to varying hydrodynamic radii of the molecules in the mixture. On the one hand, the buildup of EtOH dimers, which are observed to be formed in unipolar solvents in the absence of water, is an influencing factor and on the other hand, the change of conformation of Cy, which is caused by the energy that is induced in the mixture by mechanical stress and pressure, also enhances this effect 31.
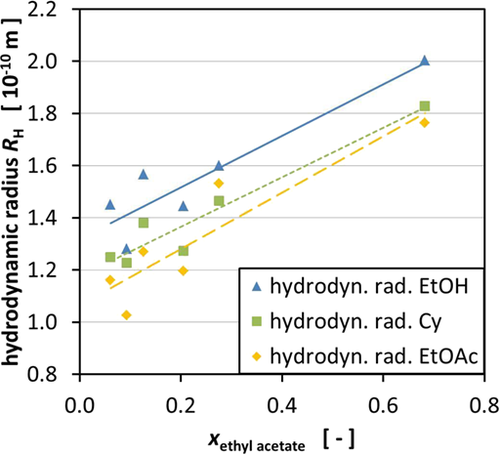
Fig. 4 supports the trend seen in Fig. 3, while showing that a higher EtOAc concentration increases the overall hydrodynamic radius of all the components. It is believed that the polarity of the mixture influences the hydrodynamic radii of the components in the mixture. Consequently, changing the composition of the mixture leads to different polarities of the mixtures which influence the hydrodynamic radii. Unfortunately, the final quantification of this effect was not possible. Therefore, the hydrodynamic radii were employed, which can be easily measured and, thus, quantified, for the decision on how to compose the used mixture.
3.2 Catalyst Retention Measurement in the Ternary Mixture
The DuraMem® 300 membrane has shown promising results for the recycling of the Lewis acid magnesium trifluoromethanesulfonate from the ternary mixture. With a molecular weight of 322.44 g mol−1, the catalyst is beyond the MWCO of 300 g mol−1. This suggests catalyst retention rates of 90 % and higher.
Fig. 2 in fact demonstrates that the predicted minimum retention rate of 90 % is neither reached for all mixtures nor for the two TMPs. It can be observed that with increasing TMP the retention rates rise for all mixtures. This is due to compaction of the membrane which results in smaller pores, leading to a denser membrane and, thus, to higher retention.
The retention rate is significantly lower for the mixtures with high Cy fraction as demonstrated in Fig. 2. During all of the experiments, it was observed that the components (fluorinated ethylene propylene (FEP) capillaries, polytetrafluoroethylene (PTFE) connectors, silicone capillaries for the permeate collection) swell when in contact with Cy or mixtures containing high fractions of Cy. As a result, it was not possible to reuse the components which had to be connected to metal or glass counterparts because of increased outer diameters or wall thicknesses. This supposedly also happens to the PI membrane which results in larger pores, thereby reducing the retention of the catalyst molecules. Cy seems to block the membrane, so other molecules cannot permeate through the membrane which leads to a reduced overall permeability (Fig. 2).
3.3 Retention Measurement in the Ternary Mixture
The aim of the conducted experiments was to test if OSN was applicable to catalyst recovery from the presented ternary mixture. However, during the experiments, fractioning of the ternary mixture was observed which results in the retention of Cy. Therefore, the permeate consists of considerably lower amounts of Cy and higher amounts of EtOH and EtOAc.
Fig. 5 illustrates the retention rate of the different components at 30 and 50 bar TMP. The retention rate of Cy varies between 44.3 and 77.6 % which resulted in negative retention of some of the other components. Considering that Cy is the solvent in this system which should be recycled anyhow, this effect shifts the application of OSN in the context of recycling into a new perspective. The results so far suggest that both a catalyst recycling as well as recycling of the organic solvent is possible in one separation step, even though consecutive steps involving OSN have to be carried out to reach the retention rates which are achieved for the catalyst for Cy.
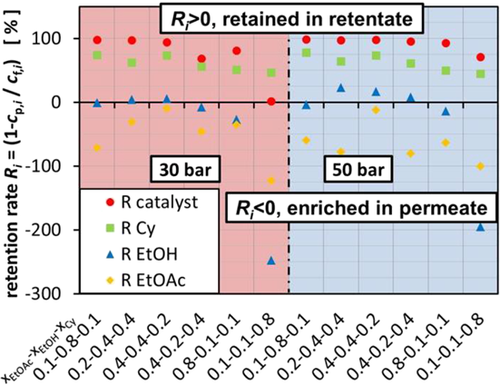
The approach to correlate this effect to the size of the Cy molecule was not successful, even though keeping in mind that the membrane also rejects molecules which are smaller than 300 Da but with a lower retention rate. According to Fig. 5, this becomes more difficult since EtOAc has almost the same molecular weight as Cy; however, it does not get rejected by the membrane and instead has a negative retention rate which results in the enrichment of EtOAc in the permeate. Therefore, the influence of the polarity of the mixture might play a considerable role as described in Sect. 3.1. Nevertheless, the hydrodynamic radii offer a good guidance which takes into account the molecule size as well as the polarity of the mixture.
Depending on the consistency of the mixture, EtOH is enriched in the permeate or retained in the retentate. When the initial EtOH concentration is low, like in the mixture 0.1/0.1/0.8, the negative retention rate is especially high. In this case, the retention rate varies between 4.0 and 22.4 %.
4 Conclusion
The experiments conducted in the feasibility study concerning the use of OSN in catalyst recycling have been a full success. It is possible to demonstrate the applicability of OSN to recycle homogeneous catalysts, in this case magnesium triflate, from a ternary mixture of organic solvents. In addition, it was also possible to extract some of the solvents through the membrane while retaining others and enriching them in the retentate stream.
From the results, compositions of the ternary mixture could be identified which are especially suited for the recycling process and which can reach a retention rate of up to 98.02 % of the catalyst in a single separation step and still reach the highest permeate flux with up to 9.435 × 10⁻² L bar−1m−2h−1 at the same time. The results are derived from the mixture 0.1/0.8/0.1 at 50 bar with a feed composition of 85.9 mol % EtOH, 6.1 mol % EtOAc, and 8.0 mol % Cy. This mixture resulted in a permeate composition of 88.6 mol % EtOH, 9.6 mol % EtOAc, and 1.8 mol % Cy which corresponds to a retention rate of Cy of 77.6 %.
The change in permeability, the retention of the catalyst, and the components in the mixture were correlated to the fraction of Cy in the ternary mixture. This allows a good prediction and guidance when planning future experiments. From the gained knowledge, reaction mixtures can be adapted prior to experiments to meet downstream requirements, when OSN is a feasible option.
In the attempt to correlate the composition of the mixture and the influence of the different components on each other, the hydrodynamic radius of the molecules in the mixture was determined via DOSY measurements. The findings point to an enlargement of the hydrodynamic radius depending on an increase of the EtOAc fraction in the ternary mixture. The exact interactions behind this observation have not been fully understood but might be related to phenomena known from literature 28-30. Further investigations with the help of other spectroscopic methods are underway.
Acknowledgements
The authors gratefully appreciate the support received from the Federal Ministry of Education and Research of the Federal Republic of Germany (Bundesministerium für Bildung und Forschung, BMBF, 03EK3041D, Verbundvorhaben Carbon2Chem-L4: SynAlk – Teilprojekt “Herstellung von C2+-Alkoholen auf Basis von H2, CO und CO2 aus Kuppelgasen”). The authors thank the analytical department for the numerous measurements and especially Dr. Meike Emondts for the help with the development of the NMR measurement procedures. The discussions with the colleagues from the Institut für Technische und Makromolekulare Chemie as well as the Chair of Chemical Process Engineering were highly stimulating.
The authors have declared no conflict of interest.
Symbols used
-
- A [m2]
-
total membrane area
-
- AGC,i [–]
-
dimensionless GC peak area of component i
-
- ANMR,i [–]
-
dimensionless NMR peak area of component i
-
- c [mol L−1]
-
concentration
-
- cp,i [mol L−1]
-
concentration of component i in the permeate
-
- cr,i [mol L−1]
-
concentration of component i in the retentate
-
- D [m2s−1]
-
diffusion coefficient
-
- J [kg m−2s−1]
-
flux through the membrane
-
- kB [m2kg s−2K−1]
-
Boltzmann constant
-
- kf [–]
-
GC correction factor
-
- m [kg]
-
mass
-
- M [kg mol−1]
-
molecular weight
-
- n [–]
-
number of nuclei
-
- RH,i [m]
-
hydrodynamic radius of component i
-
 [m]
[m] -
hydrodynamic radius of the mixture
-
- Ri [%]
-
retention rate of component i
-
- t [s]
-
time
-
- T [K]
-
temperature
-
- V [m3]
-
volume
-
- VBN [–]
-
viscosity blending number
-
- x [–]
-
molar fraction
Greek letters
-
- η [kg m−1s−1]
-
dynamic viscosity
-
- ν [m2s−1]
-
kinematic viscosity
-
- ρ [kg m−3]
-
density
-
- ω [–]
-
mass fraction
Sub- and superscripts
-
- cat
-
catalyst
-
- GC
-
gas chromatography
-
- H
-
hydrodynamic
-
- i
-
component i
-
- is
-
internal standard
-
- NMR
-
nuclear magnetic resonance
-
- p
-
permeate
-
- r
-
retentate
-
- s
-
sample
Abbreviations
-
- Cy
-
cyclohexane
-
- DOSY
-
diffusion-ordered NMR spectroscopy
-
- EtOAc
-
ethyl acetate
-
- EtOH
-
ethanol
-
- FEP
-
fluorinated ethylene propylene
-
- GC
-
gas chromatography
-
- MWCO
-
molecular weight cut-off
-
- NMR
-
nuclear magnetic resonance
-
- OSN
-
organic solvent nanofiltration
-
- PEG
-
polyethylene glycol
-
- PI
-
polyimide
-
- P&I
-
piping and instrumentation
-
- PTFE
-
polytetrafluoroethylene
-
- TMP
-
transmembrane pressure


