Analysis of the combined effect of rs699 and rs5051 on angiotensinogen expression and hypertension
Abstract
Background
Hypertension (HTN) involves genetic variability in the renin-angiotensin system and influences antihypertensive response. We previously reported that angiotensinogen (AGT) messenger RNA (mRNA) is endogenously bound by miR-122-5p and rs699 A > G decreases reporter mRNA in the microRNA functional-assay PASSPORT-seq. The AGT promoter variant rs5051 C > T is in linkage disequilibrium (LD) with rs699 A > G and increases AGT transcription. The independent effect of these variants is understudied due to their LD therefore we aimed to test the hypothesis that increased AGT by rs5051 C > T counterbalances AGT decreased by rs699 A > G, and when these variants occur independently, it translates to HTN-related phenotypes.
Methods
We used in silico, in vitro, in vivo, and retrospective models to test this hypothesis.
Results
In silico, rs699 A > G is predicted to increase miR-122-5p binding affinity by 3%. Mir-eCLIP results show rs699 is 40–45 nucleotides from the strongest microRNA-binding site in the AGT mRNA. Unexpectedly, rs699 A > G increases AGT mRNA in an AGT-plasmid-cDNA HepG2 expression model. Genotype-Tissue Expression (GTEx) and UK Biobank analyses demonstrate liver AGT expression and HTN phenotypes are not different when rs699 A > G occurs independently from rs5051 C > T. However, GTEx and the in vitro experiments suggest rs699 A > G confers cell-type-specific effects on AGT mRNA abundance, and suggest paracrine renal renin-angiotensin-system perturbations could mediate the rs699 A > G associations with HTN.
Conclusions
We found that rs5051 C > T and rs699 A > G significantly associate with systolic blood pressure in Black participants in the UK Biobank, demonstrating a fourfold larger effect than in White participants. Further studies are warranted to determine if altered antihypertensive response in Black individuals might be due to rs5051 C > T or rs699 A > G. Studies like this will help clinicians move beyond the use of race as a surrogate for genotype.
Key points
-
This study successfully tests the overarching hypothesis that rs699 A > G reduces angiotensinogen (AGT) expression independently from rs5051 C > T in the liver, demonstrating that these variants instead may be involved in influencing hypertension through nonliver-mediated mechanisms.
-
The results demonstrate that rs699 A > G and rs5051 C > T are associated with AGT messenger RNA abundance in a cell-type-specific manner and have small but clinically meaningful associations (up to 2.7 mmHg) with blood pressure.
-
The association between rs699 A > G and rs5051 C > T and increased AGT expression in the kidney may have clinical significance since the kidney expresses the necessary enzymes to convert AGT to the prohypertensive angiotensin II as well as expressing the angiotensin II and pressor-control receptors responsible for blood pressure-raising effects.
-
Further studies are warranted to investigate the potential for direct effects of rs699 A > G or rs5051 to the kidney and to determine if the reason for altered antihypertensive response in Black individuals might be due, in part, to the increased allele frequency of rs5051 C > T or rs699 A > G.
1 INTRODUCTION
Hypertension (HTN) is known to involve genetic variability in the renin-angiotensin system (RAS),1 and one of the most implicated and studied components of the RAS is angiotensinogen (AGT). AGT is a 485 amino acid pre-prohormone that is cleaved by renin to the decapeptide angiotensin I, followed by angiotensin-converting enzyme (ACE) cleavage to the octapeptide angiotensin II, which causes salt and fluid retention by the kidneys to raise blood pressure. Even small increases in AGT expression have been shown to significantly increase blood pressure.2, 3 Two single nucleotide polymorphisms (SNPs) in AGT, rs699 (missense SNP) and rs5051 (promoter SNP), have been associated with increased AGT messenger RNA (mRNA) expression and plasma AGT protein concentrations,4-7 suggesting a mechanistic basis for suspecting these variants contribute to HTN-related phenotypes.
Rs699 A > G is a common variant that codes for a methionine to threonine (M > T) substitution at position 259 of the AGT protein (this variant has been previously referred to as M235T in the literature). An association with HTN was first published in 1992 in a study comparing hypertensive subjects to controls, and increases in AGT plasma concentrations in subjects homozygous for the G allele were found.7 In attempts to find a genetic risk factor for HTN, many studies have been conducted since then searching for associations between this variant and treatment response or disease susceptibility. There is controversy since some studies have not found statistically significant associations,8-14 but as a whole there appears to be a connection between the rs699 locus and both HTN4, 15-25 and response to antihypertensive drugs including ACE inhibitors,26, 27 angiotensin receptor blockers,28-30 and aldosterone antagonists.31
Of particular importance, in vitro evidence shows that rs699 A > G (amino acid change: M > T) has no effect on the conversion of AGT to angiotensin I by renin, which is supported by the fact that the variant does not lie within the renin binding site.32 Findings that rs699 A > G has no deleterious effect on protein activity suggest that disease associations could involve other mechanisms (e.g., microRNA regulation, splice site modification, etc.) or one or more other causal variants in linkage disequilibrium (LD). The AGT promoter variant rs5051 C > T is in LD (r2 0.94) with rs699 A > G. In vitro assays have shown rs5051 C > T significantly increases AGT transcription (up to 68.6%) through alterations in transcription factor binding.32, 33 Due to the LD of these variants, studies in humans have not detangled the effect of each variant independently. In vitro studies of these SNPs have unraveled complex mechanistic hypotheses, but there remains a gap in understanding how each variant in isolation contributes to AGT expression in the liver (the main tissue which feeds AGT to the systemic circulation) and in important extrahepatic tissues, like, the kidney, brain, and vasculature.
We previously reported that (1) AGT mRNA is endogenously bound by miR-122-5p in human hepatocytes using the mir-eCLIP assay and that (2) rs699 A > G significantly decreases reporter mRNA levels in hepatocytes using the high-throughput functional screening assay PASSPORT-seq.34 Since microRNAs bind to and decrease mRNA abundance, our assay results suggest miR-122-5p decreases AGT mRNA more with the rs699 A > G variant. The putative decrease in reporter mRNA due to rs699 A > G, in theory, would oppose (i.e., “counterbalance”) the effect of rs5051 C > T on overall AGT mRNA expression in the human liver. The opposing effect of these tightly linked variants could make sense in the context of human evolution assuming that an imbalance in these variants would lead to unfavorable cardiovascular or other consequences. In addition to its published association with HTN, rs699 A > G has also been associated with increased power and strength performance,35 supporting the possibility of its role in natural selection. Both rs699 A > G and rs5051 C > T are common in humans, with the variant (rs699 G) allele frequencies ranging from 33% in Danish people to 95% in African people, depending on the data source.36 These variants occur independently from one another in about 1.3% of alleles (or 2%–3% of people) based on LD-pair37 analysis in 1000 Genomes Project data. However, HTN phenotypes have not yet been intentionally studied in humans where these SNPs occur independently from one another. Thus, our hypothesis is that individuals with unbalanced rs699 A > G and rs5051 C > T genotypes (i.e., having more of one variant allele than the other) would exhibit corresponding changes in AGT-related phenotypes, specifically blood pressure and the development of HTN. The objective of this study was to assess the isolated effect of rs699 A > G in silico, in vitro, in vivo, and retrospectively in clinical and Biobank data where rs699 A > G and rs5051 C > T occur independently of each other in research participants and samples. Table 1 provides a clear depiction of our hypothesis.
| Combined genotype group | 1 | 2 | 3 | 4 | 5 | 6 | 7 | 8 | 9 |
|---|---|---|---|---|---|---|---|---|---|
| Rs699 A > G | AA | AG | AA | GG | AG | AA | GG | AG | GG |
| Rs5051 C > T | TT | TT | CT | TT | CT | CC | CT | CC | CC |
| Combination allele frequencya | <0.0001 | 0.0063 | 0.0026 | 0.4921 | 0.4039 | 0.0818 | 0.0025 | 0.0010 | <0.0001 |
| Hypothesized HTN phenotype (ordinal) | ↑↑↑↑ | ↑↑↑ | ↑↑ | ↑ | ↔ | ↓ | ↓↓ | ↓↓↓ | ↓↓↓↓ |
| Hypothesized HTN phenotype (binned) | ↑↑↑↑ | ↑↑ | ↔ | ↓↓ | ↓↓↓↓ | ||||
- a Alleles frequencies were calculated based on all populations from the 1000 Genomes data, as accessed through the linkage disequilibrium (LD) pair tool.
2 METHODS
2.1 In silico
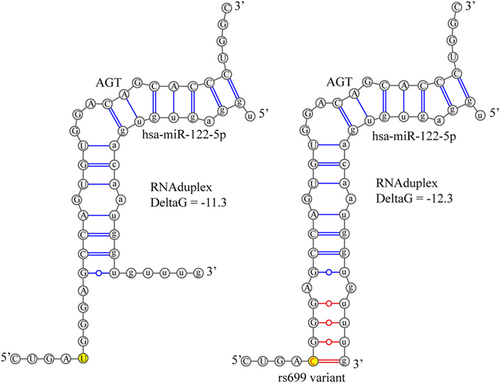
We used RNAduplex to test the change in binding affinity between hsa-miR-122-5p and the AGT mRNA with and without the rs699 A > G variant. The ViennaRNA suite version 2.4.1438 was used to call RNAduplex with default settings to test the effect of rs699 A > G on binding strength. The miR-122-5p sequence was obtained online from miRbase (https://www.mirbase.org/cgi-bin/mirna_entry.pl?acc=MI0000442), and the AGT region of rs699 was obtained from the PASSPORT-seq oligo sequence used to clone the reporter construct.34 This sequence included complementary primer ends which were included in the analysis to make sure miR-122-5p was not predicted to target these. VARNA version 3.9339 was used to create the RNA-binding schematic figure by entering the dot bracket notation output from RNAduplex and manually editing the figure (using Adobe Illustrator version 27.1.1) to display as intended.
2.2 In vitro
We constructed plasmid expression systems for the full-length AGT cDNA with or without the rs699 A > G variant on an otherwise isogenic background to test the effect of the variant on AGT mRNA abundance. The untagged human AGT cDNA expression plasmid, under a cytomegalovirus promoter, was obtained from Origene (catalog # SC322276) along with an empty vector to be used as a control (catalog # PS100020). The AGT plasmid initially contained the rs699 A > G variant (“AGT.G”) and thus was sent to GenScript for site-directed mutagenesis to mutate the AGT cDNA from G (variant) to A (wild type, “AGT.A”). Since AGT is on the negative strand in the human genome, the presented nomenclature of this mutagenesis has been complemented to the positive strand. The resulting plasmids (empty vector, AGT.G, and AGT.A) were amplified in 5-alpha competent Escherichia coli (New England BioLabs catalog C2987) and purified using Qiagen MaxiPrep according to the manufacturer's instructions. The vector plasmid concentration was 814 ng/µL, AGT.G was 485 ng/µL, and AGT.A was 616 ng/µL, determined by Nanodrop A260. Qubit DNA quantitation confirmed these measurements were accurate relative to each other, but Qubit-obtained concentrations were slightly higher compared with those from the Nanodrop. One million HepG2 cells were thawed from frozen stock and grown overnight in DMEM + 10% fetal bovine serum (FBS), resulting in 8 million cells. Cells were resuspended in 24 mL of media and 1 mL was distributed into each well of two six-well plates. A similar procedure was used for HEK293 and HT29 cells.40, 41 Lipofectamine 2000 was used according to the manufacturer's instructions using media without FBS to transfect 4.4 µg of plasmid per well. Cells were incubated for 3.5 h followed by media replacement with FBS. Cells were incubated at 37 degrees Celsius for 48 h before RNA isolation using Qiagen RNeasy according to the manufacturer's protocol. TaqMan Gene Expression Assay for AGT (Hs01586213_m1, which does not bind near rs699) and glyceraldehyde-3-phosphate dehydrogenase (GAPDH, Hs02786624_g1) were used according to the manufacturer's protocol to quantify the relative mRNA abundance in cells transfected with AGT.G versus AGT.A. Only one transfection was done for each group in the HEK293 cells, whereas three transfections were done per group in HT29, and four transfections were done per group for HepG2. Each separate transfection was considered a biological replicate. Quantitative polymerase chain reaction (qPCR) was done in triplicate for each bioreplicate. QuantStudio was used for the qPCR reactions.
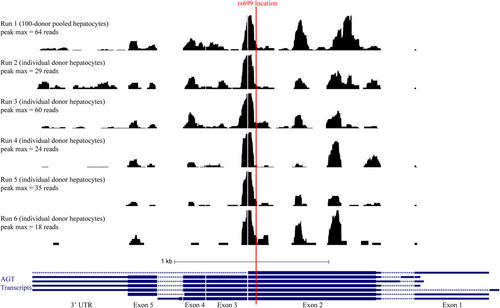
To determine the proximity of rs699 to the miR-122-5p binding site, we repeated mir-eCLIP in five additional replicates of primary hepatocytes, resulting in a total of six mir-eCLIP data sets for analysis. The mir-eCLIP assay was performed in single-donor primary hepatocytes obtained from Xenotech (lot HC2-47) using the kit reagents and protocol provided by ECLIPSE Bioinnovations (catalog number not yet available). This protocol is developed based on the published single-end seCLIP protocol42 and is refined as previously described.34 Pooled-hepatocytes were used for Run 1 (previously completed), and data from this assay34 was used. Single-donor hepatocytes were used for Runs 2–6. Runs 2 and 3 were performed by ECLIPSE Bionnovations and Runs 4–6 were performed by the study team. Over 50 million reads were obtained for each sample from Illumina NovaSeq. 6000 sequencing. Hyb (version 1) was used to call chimeric reads from the sequencing data.43 A custom R pipeline was used to further analyze the Hyb output, and bedgraph files were generated for upload into UCSC Genome Browser.44 UCSC Genome Browser printouts were further edited in Adobe Illustrator version 27.1.1 in accordance with the UCSC Genome Browser user license.
2.3 In vivo
To assess AGT expression levels across genotype groups according to our hypothesis, we requested access to Genotype-Tissue Expression (GTEx) Project v8 data through dbGaP. Once approved, files were downloaded according to the AnVIL instructions provided online (https://anvilproject.org/learn/reference/gtex-v8-free-egress-instructions). BAM files were downloaded for “Liver,” “Brain—Cerebellum,” “Colon—Sigmoid,” “Kidney—Cortex,” “Tibial Artery,” and “Coronary Artery,” and feature counts (called from the Subread package, version 2.0.1) was used to determine read counts for AGT for each genotype group. Rs699 and rs5051 were extracted from whole-genome sequencing VCF files using Plink version 2.0.45 Expression quantitative trait locis (eQTLs) and cross-tissue expression data were determined using the GTEx web browser by searching for “rs699” or “rs5051.” Web browser printouts were assembled into figures using Adobe Illustrator version 27.1.1 in accordance with the GTEx user license.
2.4 Clinical and Biobank
To test our hypothesis in HTN phenotypes, we used two Biobank data repositories: Indiana University Simon Comprehensive Cancer Center Advanced Precision Genomics (APG) clinic research participants,46 and UK Biobank. APG patients provided consent for research and reporting research results generated with their data. APG data were retrospectively assessed for HTN phenotypes under a research protocol approved by Indiana University's Institutional Review Board, utilizing available clinical sequencing data to determine rs699 and rs5051 variant genotypes for each participant. Pharmacy prescription claims data for each participant were used to determine total blood pressure medication fills per year or maximum unique blood pressure medications filled in any quarter of the year. UK Biobank data were accessed under an approved material transfer agreement and downloaded according to UK Biobank instructions. The provided imputed genotype files were used to determine rs5051 and the measured genotype files were used to determine rs699. Plink version 2.0 was used to filter by variant and generate. Raw genotype files for upload into R. UK Biobank Data fields 4080, 4079, 2966, 21022, 21000, 6177 + 6153, 131286, 21001, 20116, 22032, 1558, 1478, 30710, 30630, 30640, and 26414 + 26431 + 26421 were used to determine systolic blood pressure, diastolic blood pressure, age of HTN diagnosis, age at recruitment, ethnic background, taking blood pressure medication yes/no, date HTN diagnosis, body mass index (BMI) (kg/m2), smoking status (0 = never, 1 = previous, 2 = current), physical activity (0 = low, 1 = moderate, 2 = high), alcohol intake (1 = daily, 2 = 3 − 4x/week, 3 = 1 − 2x/week, 4 = 1 − 3x/month, 5 = special occasions, 6 = never), preference for adding salt to food (1 = never/rarely, 2 = sometimes, 3 = usually, 4 = always), blood c-reactive protein (CRP), blood apolipoprotein A, blood apolipoprotein B, and education level, respectively. Sex was predefined in the .fam files provided with the UK Biobank data, which was determined by chromosome X intensity. UK Biobank genotypes were quality controlled by the UK Biobank organization (https://biobank.ndph.ox.ac.uk/ukb/refer.cgi?id=531). Further details of how the phenotype and covariate values were averaged, combined, and cleaned are provided in the R code published on Git Hub (https://github.com/Nickpowe/AGT_rs699_HTN). For example, systolic blood pressure was averaged across 1–4 visit instances for each individual. Race and ethnicity were broadly grouped into White, Black, Indian, Asian, White and Black, White and Asian, Prefer not to Answer, Mixed, and Other based on the more granular data provided by UK Biobank survey responses. Blood biochemistry data were obtained from just the first instance (whenever multiple instances existed) since most of the blood pressure values were recorded from the first instance.
2.5 Statistical methods
qPCR was analyzed using two-sample two-sided t tests for data that (1) averaged the technical replicates or (2) kept technical replicates separate (both results provided). Fold changes were calculated by comparing to the wild-type group (AGT.A) after normalizing the wild-type cycle thresholds to the average of all wild-type cycle thresholds. All cycle threshold values were also normalized to GAPDH. GTEx eQTLs were precalculated (https://gtexportal.org/home/methods) based on normalized expression slope (slope of regression estimate) and were displayed with 95% confidence intervals. Statistical analyses of the GTEx genotypes and the APG data were not conducted due to low sample sizes in high and low genotype groups. UK Biobank data were analyzed using base R linear or logistic regression. Covariates were included as independent factors along with genotype groupings in multiple regression models. Tests for normality were done visually given the large amount of data. Rs5051 was imputed, and imputation dosages were converted to best guess by rounding to the nearest whole genotype number (0, 1, and 2) when used in genotype groupings; otherwise, the imputation dosage was used in the regression. Statistical analyses were stratified into subgroups based on age <50 or ≥50, on blood pressure med yes or no, and into race and ethnicity groups. Regression estimates for systolic blood pressure, diastolic blood pressure, mean blood pressure (average of systolic + diastolic), and age of HTN diagnosis were compared by dividing the estimates by the standard deviation for the whole cohort (for each phenotype, respectively), resulting in z score-like values. R version 4.1.1 was used for all statistical analyses and to generate all figures.
3 RESULTS
3.1 In silico analysis of microRNA-binding site creation
We previously reported that AGT mRNA is endogenously bound by miR-122-5p in liver cells using the mir-eCLIP assay and that rs699 A > G significantly decreases reporter mRNA levels in liver cells using the high-throughput functional screening assay PASSPORT-seq.34 Thus, we further investigated the role of miR-122-5p on AGT expression using in silico tools. The existing microRNA-binding and mirSNP prediction tools (mirDB, miRdSNP, PolymiRTS, and others) focus on 3'UTRs of target genes and thus fail to consider the rs699 site, which is in exon 2 of AGT. Therefore, we used RNAduplex to test the hypothesis that rs699 A > G creates a stronger binding site for miR-122-5p, as this could explain the downregulation seen in the reporter assay. The results of the RNAduplex binding analysis showed that the variant construct (Figure 1, right) predicted an additional four bases to pair (three of which are GU pairs) compared with the reference construct (Figure 1, left) and increased the binding strength from a deltaG of −11.3 to −12.3 kcal/mol (a lower free energy state supporting stronger binding). To put this deltaG change in context, we randomly scrambled the target sequence 2000 times and recorded the smallest deltaG and subsequently recorded the deltaG of a perfectly matching siRNA to generate the highest and lowest plausible values (−7.1 to −39.3). The largest plausible RNAduplex change was 32.2 kcal/mol, and compared with these extremes, the rs699 A > G variant increased the binding strength by 3%.
3.2 Mir-eClip to verify miR-122-5p binding sites
To further test the hypothesis that miR-122-5p binds near the location of rs699, we repeated the mir-eCLIP assay in 5 replicates on individual donor hepatocytes to gain repeated measures of where microRNAs bind in this location. We found that the rs699 location is about 40–45 nucleotides away from the strongest microRNA-binding peak (Figure 2) in the entire AGT mRNA. The miR-122-5p constitutes the majority of the mir-eCLIP reads, which is not surprising given miR-122-5p makes up closely to 70% of the abundance of all microRNAs in hepatocytes.34 We also detected mir-26a, mir-26b, and several other microRNAs contributing to the main peak shown in Figure 2, but these were not highly prominent. This analysis demonstrates that there is microRNA-binding activity occurring in the specific location of rs699, but that the rs699 A > G variant may be exerting more of its effect indirectly given the close proximity (but not exact overlap) with a very strong site of microRNA binding.
3.3 eQTL analysis of rs699 in GTEx
Since the reporter assay demonstrated a fivefold decrease in mRNA, and the role of miR-122-5p in regulating AGT mRNA abundance is supported by the in silico evidence and the in vitro mir-eCLIP evidence, we used the GTEx data to test the association between rs699 A > G and AGT mRNA expression in human liver. Figure 3 (right) shows that there is no significant change in AGT mRNA abundance according to the rs699 genotype in the liver. However, in other tissues like the sigmoid colon and cerebellum, there is a strong significant increase and decrease in AGT, respectively. Given the potential to affect the RAS, we also analyzed kidney and arterial tissues. The arterial tissues show a small decrease in AGT, and the kidney cortex tissue shows a significant increase in AGT in the presence of the rs699 G allele (Figure 3, right). Because individuals with rs699 A > G had increased AGT expression in the kidney cortex, we sought to understand the cell-specific expression patterns within the kidney. To this end, we analyzed publicly available data from the Kidney Precision Medicine Project (www.kpmp.org).47 Although genotype data is not available, cell-specific expression patterns were observed in injury. Significantly, AGT and ACE expression were observed within the proximal tubular cell (p < 0.001), which contributes to hypertensive phenotypes through AGT-induced salt and water reabsorption.48, 49 Interestingly, the kidney Tissue Atlas also revealed increased expression of AGT in degenerative vascular smooth muscle cells (VSMCs), a form of injured VSMC more abundant in HTN and chronic kidney disease. These findings further support a triad of associations in the same direction of effect: between (1) SNP rs699 A > G and increased HTN risk, (2) SNP rs699 A > G and increased renal cortical expression of AGT, and (3) AGT expression and phenotypic cellular changes in HTN and CKD.
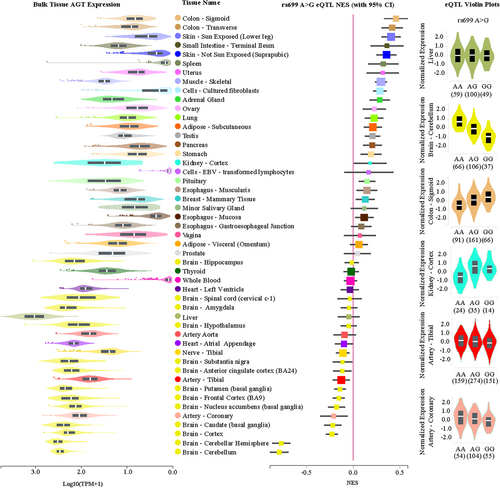
Figure 3 (left) shows the bulk mRNA expression for each tissue and reveals a possible trend towards more rs699 A > G downregulation effect in tissues expressing higher levels of AGT, like, the brain and arteries. As expected, due to the significant LD, rs5051 C > T results in very similar findings (not shown) and thus these two variants need to be decoupled to address our hypothesis.
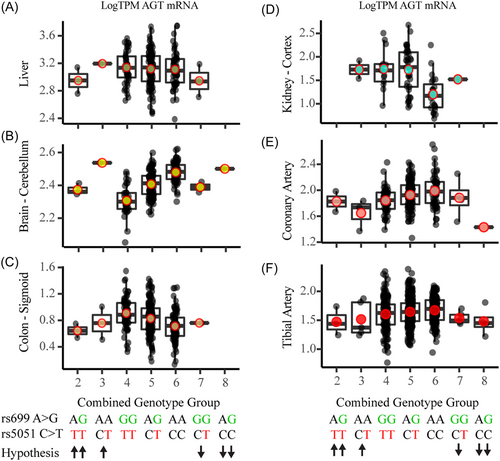
We hypothesized the effect of rs699 and rs5051 genotypes would occur according to Table 1, where rs699 A > G decreases AGT expression, reduces blood pressure, and is protective of HTN, and where rs5051 C > T increases AGT expression, increases blood pressure, and contributes to increased development of HTN. In the GTEx liver data, there were three individuals who had one more rs5051 T allele than rs699 G, and three individuals who had one more rs699 G allele than rs5051 T. We expected to see elevated AGT expression in genotype groups 1–3 (more rs5051 T alleles than rs699 G) and decreased AGT expression in groups 7–9 (more rs699 G alleles than rs5051 T). Due to the low sample size, we could not conclude from this analysis if the two SNPs have opposing effects on AGT expression because there were too few numbers in the high and low groups (Figure 4). The analysis in genotype groups 4–6 for all tissues demonstrated a similar trend to that observed in the individual SNP GTEx data shown in Figure 3, and the lower and upper genotype groups did not reveal marked effects on AGT expression.
3.4 Mechanism in different cell types
Given that significant AGT expression eQTLs existed in opposite directions in the colon and cerebellum, we conducted transient transfections of AGT in three cell types to test the effect of rs699 A > G on mRNA abundance or expression from a plasmid containing the full AGT gene with or without rs699 A > G on an otherwise isogenic background. We could not identify a suitable cell model for cerebellum, therefore we only utilized liver (HepG2) and colon (HT29) models. We also included kidney cells (HEK293). We expected to see that in HepG2 cells, where miR-122-5p is the 48th most highly expressed microRNA (out of 680 total), AGT would be decreased by the rs699 A > G variant. However, rs699 A > G caused a near-significant 1.8-fold increase in AGT mRNA of HepG2 liver cells after a 48-h transient transfection (Figure 5A). On the basis of the GTEx results, we expected to see HT29 colon cells express more AGT in the rs699 A > G construct, yet rs699 A > G caused a near-significant twofold decrease in AGT mRNA of HT29 colon cells after a 48-h transient transfection (Figure 5B). Rs699 A > G did not cause a significant change (1.1-fold) in AGT mRNA of HEK293 kidney cells after a 48-h transient transfection (Figure 5C). These results isolate the effect of rs699 A > G and indicate that cell-type-specific factors are leading to seemingly differential regulation of AGT mRNA abundance. Given the differing effect of this SNP in different cell types, further work is needed, if warranted, to understand how AGT expression is modulated by this SNP.

3.5 Analysis of Biobank data
To further test our hypothesis, and to determine if there is value in more rigorous studies of these variants, we used available clinical cohort and Biobank data. The first cohort consisted of cancer patients from the Indiana University Advanced Precision Genomics Clinic where we have HTN medication fill data. We divided the subjects into genotype groups as shown in Table 1, and Figure 6A,B shows the results of this analysis for two phenotypes: (1) total blood pressure medication fills per year, and (2) total maximum concomitant unique blood pressure medications filled in any quarter of a year. We did not perform statistical comparisons on this data since there were too few numbers in the high- and low-risk genotype groups. However, it appears there could be a difference in HTN phenotypes across the genotype groups.
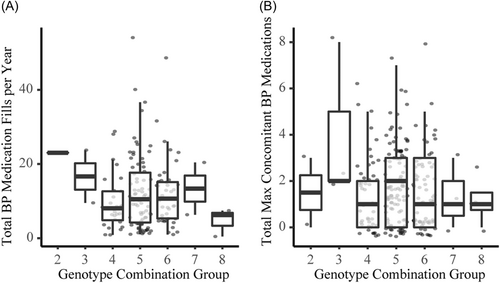
The trend towards lower HTN medication usage in the groups with more rs699 G alleles (groups 7–9) appeared supportive of our hypothesis, therefore we tested our hypothesis again in a much larger retrospective analysis in the UK Biobank data.
Among 462,417 individuals tested in the UK Biobank, we found that rs699 A > G was significantly associated with a 0.11 mmHg increase in systolic blood pressure per rs699 G allele (p = 0.005). Not surprisingly, rs5051 C > T was also significantly associated with a 0.10 mmHg increase in systolic blood pressure (p = 0.011) in the same individuals. The direction of effect of these results is consistent with the literature when the two variants are not considered as a combined genotype. We repeated this analysis after controlling for the following covariates: sex, age, BMI, smoking status, physical activity level, alcohol intake, preference for adding salt to food, blood CRP, blood apolipoprotein A, blood apolipoprotein B, and level of education. These were chosen because they have been previously found to correlate with or be predictive of HTN.50 After controlling these factors, we found that rs699 A > G was significantly associated with a 0.36 mmHg increase in systolic blood pressure per rs699 G allele among 311,004 individuals (p < 0.001). Not surprisingly, rs5051 C > T was also significantly associated with a 0.35 mmHg increase in systolic blood pressure (p < 0.001) in the same individuals (Figure 7C,F) per genotype group.
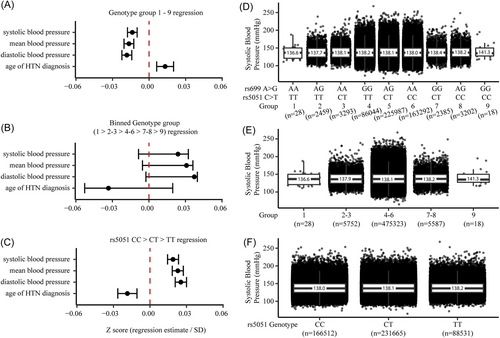
When we conducted the analysis by including rs699 and rs5051 genotype combinations according to our hypothesis, and controlling for the same covariates, there was a statistically significant association that supported our hypothesis that an imbalance favoring rs699 G over rs5051 T (i.e., genotype groups 7–9) would decrease systolic blood pressure (linear regression estimate = −0.25 mmHg change per genotype group, p < 0.001). Figure 7A shows these results as z scores (normalized to the standard deviation of the full cohort) along with similar results for mean blood pressure, diastolic blood pressure, and age of HTN diagnosis. However, when we inspected the blood pressure averages for each genotype group (Figure 7D), it appeared that the regression was being driven by the large sample size in genotype groups 4–6, and that the lower and higher genotype groups (1–3 and 7–9) did not follow the hypothesized pattern. To further isolate the effect of rs699 A > G, we binned genotype groups into 1 versus 2–3 versus 4–6 versus 7–8 versus 9, and found that there was a nonsignificant trend towards an increase in blood pressure (Figure 7B,E) which statistically demonstrates that rs699 A > G is unlikely to be exerting a blood pressure lowering effect. Table 2 provides the regression estimates for the systolic blood pressure phenotypes, including estimates for the covariates.
| Index | Genotype groups 1–9 | Binned genotype group | Rs5051 | |||
|---|---|---|---|---|---|---|
| Estimate | p Value | Estimate | p Value | Estimate | p Value | |
| (Intercept) | 73.82541 | <2.22E − 308 | 71.86081 | <2.22E − 308 | 72.21228 | <2.22E − 308 |
| Group | −0.25438 | 8.51E − 12 | 0.220297 | 0.25283 | 0.34963 | 1.51E − 16 |
| Sex | −6.45016 | <2.22E − 308 | −6.45415 | <2.22E − 308 | −6.44912 | <2.22E − 308 |
| Age | 0.671527 | <2.22E − 308 | 0.671052 | <2.22E − 308 | 0.671726 | <2.22E − 308 |
| BMI | 0.719507 | <2.22E − 308 | 0.719547 | <2.22E − 308 | 0.719496 | <2.22E − 308 |
| Smoking status | −0.88889 | 2.02E − 84 | −0.89023 | 1.16E − 84 | −0.88798 | 2.94E − 84 |
| Physical activity | 0.75906 | 2.57E − 77 | 0.758519 | 3.38E − 77 | 0.759263 | 2.32E − 77 |
| Alcohol intake | −0.49658 | 4.92E − 119 | −0.49147 | 9.31E − 117 | −0.49821 | 8.73E − 120 |
| Adding salt | −0.81802 | 1.05E − 118 | −0.81464 | 9.52E − 118 | −0.81918 | 4.88E − 119 |
| Blood CRP | 0.065327 | 1.40E − 18 | 0.065339 | 1.39E − 18 | 0.065363 | 1.34E − 18 |
| Blood apolipoprotein A | 7.25042 | <2.22E − 308 | 7.25638 | <2.22E − 308 | 7.248796 | <2.22E − 308 |
| Blood apolipoprotein B | 7.96638 | <2.22E − 308 | 7.959616 | <2.22E − 308 | 7.969412 | <2.22E − 308 |
| Education | 0.029443 | 1.11E − 50 | 0.0295 | 7.30E − 51 | 0.029432 | 1.20E − 50 |
- Note: Variable ranges are described in the methods.
- Abbreviations: BMI, body mass index; CRP, c-reactive protein.
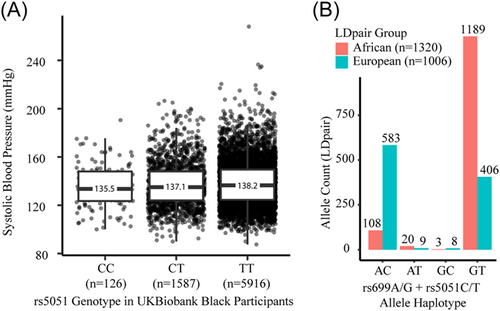
We repeated the covariate-corrected analyses for systolic blood pressure, stratifying the analysis by (1) whether someone was on a BP medication, (2) age above or below 50, and (3) by race and ethnicity. We found that rs5051 C > T is associated with a 0.32 mmHg increase in systolic blood pressure in those not taking BP medications (p < 0.001, n = 243,277), and a nonsignificant 0.08 mmHg increase in systolic blood pressure in those taking BP medications (p = 0.399, n = 67,725). The genotype groups followed the same nonsignificant pattern as the nonstratified analysis. Results were also not markedly different when stratified by age groups <50 or ≥50. The genotype group analysis results followed similar nonsignificant patterns in the race and ethnicity groups. The association between systolic blood pressure and the single variant (rs5051 C > T) in individuals of self-identified Asian ancestry (not including “Indian” ancestry) was not statistically significant (p = 0.15). In contrast, rs5051 C > T was associated with a 1.17 mmHg increase in systolic blood pressure in Black participants (p = 0.032, n = 4580), a >fourfold larger effect size than seen in White participants (0.25 mmHg increase, p < 0.001, n = 294,582). Figure 8A shows the noncovariate adjusted numbers per rs5051 genotype group. Other race and ethnicity groups were not statistically significant. Interestingly, the rs5051 C > T variant has an 88% allele frequency in Black participants, compared with a 40% allele frequency in White participants in the UK Biobank data. Figure 8B shows phased haplotypes from the 1000 Genomes Project illustrating that the rs5051 T allele is far more common in those with African ancestry.
4 DISCUSSION
There is a large body of literature describing investigations into rs699 and rs5051 in modulating AGT influence on HTN, but due to the LD between these variants, the independent mechanisms of each SNP have remained difficult to delineate. Our work presented here expands the body of knowledge and is novel in its focus on the independent effect of each SNP on AGT expression and HTN. On the basis of evidence from our previous work, we hypothesized that rs699 A > G was responsible for decreasing AGT abundance via increasing the binding strength with miR-122-5p, and, that when unopposed by the increased transcription caused by rs5051 C > T, would reduce AGT expression and be protective against HTN. Approximately 2%–3% of people have an imbalance of these two SNPs, indicating the research question is of significance to the human population.
Our in silico results support our hypothesis, but should be viewed conservatively since the change in binding strength was only around 3%. The additional mir-eCLIP assay results strongly confirm that miR-122-5p binds to AGT in hepatocytes, and that rs699 is near one of these binding sites. However, our in vitro results (which isolate rs699 A > G) do not support our hypothesis since we expected rs699 A > G to cause decreased AGT mRNA abundance in HepG2 hepatocytes (where miR-122-5p is highly expressed), but instead AGT mRNA was increased. In vivo, GTEx data did not show a strong liver upregulation of AGT in three individuals with unopposed rs5051 C > T, and did not show an obvious downregulation of AGT in three individuals with unopposed rs699 A > G. Further analysis of retrospective clinical data from IU cancer patients did not show a clinically meaningful association with several measures of HTN, though this analysis was likely underpowered and potentially confounded by cancer therapies. Retrospective UK Biobank analysis, which provided a large clinical population to isolate the independent effects of rs699 A > G and rs5051 C > T, also did not show a clinically meaningful association with systolic blood pressure based on our hypothesis. On the basis of these results, it is unlikely that rs699 A > G variant strongly modifies miR-122-5p binding strength directly. Our experiments were robustly executed, well powered, and therefore successful in testing both the mechanistic and translational aspects of this hypothesis.
However, we did confirm the previous associations between the rs699 A > G (or rs5051 C > T, due to their LD) and increased blood pressure, in the large UK Biobank data set, and expanded on these findings by investigating differences between self-reported race. Importantly, rs5051 C > T and/or rs699 A > G had a significant association with systolic blood pressure in Black participants in the UK Biobank, demonstrating a fourfold larger effect size than that seen in White participants. It is noteworthy that the allele frequencies for rs699 A > G and rs5051 C > T are approximately twice as common in African ancestry groups relative to Europeans. In addition to differences in minor allele frequency, it is known that the LD blocks of AGT differ between White and Black people.51 Salt-sensitive hypertensive phenotypes are reported to be more common in individuals of African ancestry,52-54 which lends support to the possibility that rs5051 C > T or rs699 A > G mediate blood pressure changes more dramatically in Black patients through changes in AGT expression or abundance. Individuals with African Ancestry are reported to have lower plasma renin activity with preserved aldosterone levels,55 and substantial evidence also indicates that individuals of African ancestry respond better to calcium channel blockers and diuretics than beta-blockers or RAS-acting antihypertensives.56-58 Aligning with this, the Eighth Joint National Committee (JNC 8) endorses different initial antihypertensive therapy for Caucasian and Black individuals. In individuals with normal kidney function, the JNC only recommends ACE inhibitor as first-line therapy in Caucasians.59 Here, we provide evidence that rs5051 C > T or rs699 A > G may be involved in hypertensive phenotype differences between individuals with European and African ancestry that may underly established differences in antihypertensive treatment efficacy between these groups. Despite this, significant admixture exists between populations. As access to whole-genome sequencing in clinical care increases, studies like this will allow clinicians to choose the most effective blood pressure medications (potentially non-RAS acting agents) based on rs699 or rs5051 genotype, instead of race, presenting a possible solution to the problem of admixture in race-based medication choice; a solution in need of further research.
An additional valuable finding made by our study is the observation that rs699 and rs5051 have cell-specific effects and the genesis of a new hypothesis regarding the role of these variants in HTN. In HT29 colon cells, rs699 A > G decreased AGT mRNA, the opposite result was seen in HepG2 cells, demonstrating clear cell-type-specific effects attributable to rs699 (independent from rs5051). GTEx analyses also demonstrate strong eQTLs with opposite direction of effects in different tissue types, supporting that the functional effect of rs699 A > G (or rs5051 C > T since they are in LD in these samples) is cell-type specific. The lack of eQTL in liver samples suggests these variants influence blood pressure-related phenotypes in nonliver tissues. This is an important finding because it contradicts the common belief that the increased endocrine secretion of AGT from the liver into circulation is what is responsible for the blood pressure-raising effects of rs699 or rs5051. Therefore, we also investigated arterial and kidney tissues due to the potential relevance to the RAS. Although arterial tissues (which consist mostly of smooth muscle and endothelial cells) in the GTEx data do not show increased AGT expression with rs699 or rs5051, there was a significant increase in the kidney cortex. Cortical kidney samples (which consist of many cell types including endothelial) demonstrate that AGT expression is increased in the presence of the rs699 G allele (p = 0.049). This is interesting because the kidney is the only tissue in the body that expresses appreciable amounts of AGT, renin (REN), ACE, and angiotensin II receptor (AGTR1); the four genes whose expression is needed to convert AGT to angiotensin II and activate angiotensin II receptors. Using the recently developed Kidney Tissue Atlas47 (https://atlas.kpmp.org/explorer/dataviz) we can see that this pathway may occur through paracrine signaling where AGT and ACE are expressed by proximal tubule cells, REN is secreted by renin-specific granular cells, and AGT and AGTR1 are expressed in VSMCs. Additionally, angiotensin II acts on other receptors in the proximal tubule to increase salt reabsorption and water retention.48, 49 The Kidney Tissue Atlas also shows increased expression of AGT in degenerative VSMCs; those VSMCs most affected by HTN in the setting of arteriosclerosis. The presence of this pathway occurring locally in the kidney, near the site of angiotensin II and pressor-control receptors and corresponding kidney arteriolar vasoconstriction and arteriosclerosis underlines the potential relevance of AGT variants in raising blood pressure and reducing renal blood flow through a paracrine (rather than liver-derived endocrine pathway) resulting from increased AGT expression. The local paracrine RAS pathway in the kidney is substantiated by evidence in the literature60, 61; thus, our findings that the rs699 or rs5051 variants may disrupt this process specifically in the kidney presents an interesting hypothesis that these AGT variants and/or renal AGT expression may underly the interconnectedness between kidney disease and HTN. Our findings further support the association between rs699 G allele (or rs5051 T allele) which increases HTN risk, mediating arteriosclerosis, and the link to the renal expression of AGT with its upstream and downstream pathway components.
Our study has several limitations. The in silico analysis is taken out of the context of the secondary structure of the mRNA and does not account for the steric hindrance of RNA-binding proteins or N6-methyladenosine modifications that can alter the microRNA-binding strength. Thus, we stress that the results of this analysis need to be interpreted conservatively. The in vitro results would have benefited from additional replicates conducted on different lots or different passages of cells with transfections occurring on separate days. Despite this limitation, however, our experiments were fit for the purpose of deciding whether the effect of rs699 aligned with our previous observations. The in vivo GTEx and clinical analyses in our institutional cohort were underpowered, but this limitation is inherent to retrospective data analysis where additional subjects cannot be recruited. Additionally, the tight linkage between rs699 A > G and rs5051 C > T necessitates the use of very large clinical cohorts to assess the independent effects of either SNP. Considering this, a great strength of our study is that the UK Biobank analysis was overpowered and thus very useful in statistically rejecting the alternate hypothesis that rs699 A > G acts as a counteracting force against rs5051 C > T. While we did not investigate the doses or number of concomitant HTN medications that patients were prescribed in the UK Biobank (which may be markers of resistant HTN phenotypes), we compensated for this limitation by performing analyses assessing the impact of rs699 and rs5051 on HTN phenotypes in patients who were not prescribed HTN medications. Another strength of this study is the combination of experiments and analyses spanning multiple disciplines of science (in silico, in vitro, in vivo, and observational) to test a single hypothesis.
Another potential limitation of this study is that we previously identified the importance of rs699 using a high-throughput assay designed to screen for genetic variants that modify microRNA binding in an indirect manner. While this is a potential disadvantage, it is also a strength to identifying functional variants that exert their effect indirectly. Our results suggest that rs699 A > G could modulate the binding of miR-122-5p indirectly through other cell-type-specific mechanisms such as altered recruitment of RNA-binding proteins or splicing machinery. In fact, ENCODE eCLIP experiments for RNA-binding proteins in HepG2 demonstrate that proteins involved in splicing and pre-mRNA processing; AQR, BUD13, CDC40, NOL12, PPIG, RBM15, RBM22, SRSF1, SRSF9, and TRA2A bind to AGT mRNA in the rs699 location, giving plausibility to this hypothesis (this data can be viewed at www.encodeproject.org).62 While not a main analysis of this paper, we used the GTEx liver AGT RNA-seq data to measure alternative splicing events at the exon junction near rs699 (3′ end of exon 2) to aid in interpreting these data. We found that exon 2 was spliced to a noncanonical exon (i.e., not joined to canonical exon 3) on average 10% of the time compared with all exon 2 junction reads for each individual (range 0–21%, n = 208). However, this alternative splicing did not correlate with the rs699 genotype (nor did any single splice variant), indicating that rs699 A > G does not interfere with AGT exon 2 splicing in the liver. DROSHA, UCHL5, and XPO5 were also identified to bind in the rs699 location based on ENCODE data, but the strongest signal was for SND1 binding. SND1 is an endonuclease that mediates microRNA decay63 and is a component of the RNA-induced silencing complex (RISC),64 which is interesting given our finding that this site is near a miR-122-5p binding site. Thus, microRNA-mediated recruitment of SND1-containing RISC to this location is evident, but the significance of this remains unknown.
In summary, we comprehensively evaluated the effects of rs699 and rs5051 on AGT expression and HTN phenotypes using in vitro, in vivo, and retrospective clinical approaches, including analyses that isolated the individual effects of each variant. We successfully tested our overarching hypothesis that rs699 A > G reduces AGT expression independently from rs5051 in the liver, demonstrating that these variants instead may be involved in influencing HTN through nonliver-mediated mechanisms. We demonstrated that rs699 and rs5051 are associated with AGT mRNA abundance in a cell-type-specific manner and have small but clinically meaningful (up to 2.7 mmHg) increases in HTN phenotypes. Our finding that rs699 A > G increased AGT expression in the kidney may have clinical significance since the kidney expresses the necessary enzymes to convert AGT to the prohypertensive angiotensin II as well as expressing the angiotensin II and pressor-control receptors responsible for blood pressure-raising effects. Further studies are warranted to investigate the potential for direct effects of rs699 in the kidney and to determine if the reason for altered antihypertensive response in Black individuals might be due, in part, to the effect of rs5051 C > T or rs699 A > G.
AUTHOR CONTRIBUTIONS
Nicholas R. Powell designed, executed, and analyzed the experiments, and wrote the manuscript. Tyler Shugg contributed to experimental design, analysis, and manuscript writing. Jacob Leighty contributed to experimental execution. Matthew Martin contributed to experimental execution and manuscript writing. Rolf P. Kreutz contributed to manuscript writing. Michael T. Eadon, Dongbing Lai, Todd C. Skaar, and Tao Lu contributed to experimental design and manuscript writing. The final manuscript was approved by all authors.
ACKNOWLEDGMENTS
The Genotype-Tissue Expression (GTEx) Project was supported by the Common Fund of the Office of the Director of the National Institutes of Health, and by NCI, NHGRI, NHLBI, NIDA, NIMH, and NINDS. The data used for the analyses described in this manuscript were obtained from the GTEx Portal on 01/10/2023, and through dbGaP accession phs000424.v8.p2. This research has been conducted using the UK Biobank Resource under Application Number 86441. Biospecimens were stored in the CTSI Specimen Storage Facility at Indiana University School of Medicine which is supported, in part, by grant NIH/NCRR RR020128. The content is solely the responsibility of the authors and does not necessarily represent the official views of the National Institutes of Health. We thank all research participants involved in making this work possible. This work was supported by NIH-NIGMS T32GM008425 to Nicholas R. Powell, NIH-NIGMS Grant R35GM131812 to Todd C. Skaar, NIH-NIGMS Grant 1R01GM120156-01A1 to Tao Lu, NIH-NCI Grant 1R03CA223906-01 to Tao Lu, and NIH-NIGMS K23GM147805 to Tyler Shugg.
CONFLICT OF INTEREST STATEMENT
The authors declare no conflict of interest.
ETHICS STATEMENT
The research was conducted ethically. Approved IRB documentation and informed consent were obtained for analyses involving human subjects. No animal models were used in this research.
Open Research
DATA AVAILABILITY STATEMENT
All data pertaining to the cellular experiments are included in the manuscript. All data pertaining to the GTEx and UK Biobank analyses are available from dbGaP and the UK Biobank organization, respectively. Data pertaining to the IU Advanced Precision Genomics cohort are not available to be shared to ensure protection of these research participants. Data pertaining to the eCLIP experiments are available at GEO accession number GSE227405.


