Diagnostic Accuracy of Angiography-Derived Murray Law-Based Quantitative Flow Ratio (μQFR) Versus Pressure-Derived Fractional Flow Reserve (FFR) in Moderate to Severe Calcified Coronary Lesions—The DIAMOND Study
ABSTRACT
Background
Murray law-based Quantitative Flow Ratio (μQFR) is an innovative AI-driven method for evaluating coronary lesions using contrast flow velocity estimates. Unlike traditional approaches, μQFR does not require pressure wires or hyperemia induction. However, its accuracy compared to Fractional Flow Reserve (FFR) for calcified lesions (ACC/AHA classification B2 or C) remains underexplored.
Aims
This study aimed to evaluate the diagnostic accuracy of μQFR in detecting hemodynamically significant calcified coronary stenosis, defined as FFR ≤ 0.80.
Methods
In this two-center, investigator-initiated trial, patients with calcified lesions (B2 or C, 30%–90% diameter stenosis) and FFR assessment during coronary angiography were included. μQFR was calculated by a nurse blinded to the FFR results. Sensitivity and specificity of μQFR were compared with FFR as the gold standard.
Results
Among 125 patients, paired μQFR and FFR data were available for 107 patients and 120 lesions. Mean FFR, μQFR, and percent stenosis were 0.775 (95% CI: 0.757–0.793), 0.788 (95% CI: 0.772–0.805), and 56.75% ( ± 10.14%), respectively. μQFR demonstrated a sensitivity of 75% (95% CI: 65.6%–84.6%), a specificity of 77.8% (95% CI: 63.5%–92.0%), a diagnostic precision of 75.8% and an area under the receiver operating characteristic curve of 0.813 (95% CI: 0.714–0.911). The positive predictive value was 88.7%, and the negative predictive value was 57.1%. The positive and negative likelihood ratios were 3.38 and 0.32, respectively.
Conclusion
μQFR is simple to compute and offers moderate diagnostic accuracy for calcified coronary stenosis. It provides a valuable alternative when FFR is unavailable or technically challenging.
1 Introduction
Accurately assessing the physiological significance of coronary artery stenosis is essential for guiding therapeutic strategies and determining revascularization needs. Current guidelines strongly recommend Fractional Flow Reserve (FFR) with a class IA indication for evaluating intermediate diameter stenosis [1]. FFR, which measures the pressure ratio across a lesion during maximal hyperemia, is a validated indicator of ischemia [2-4]. However, it requires pressure wires and pharmacological agents like adenosine, adding risks and complexity.
Murray law-based Quantitative Flow Ratio (μQFR) offers a novel, simpler method for noninvasive functional assessment of coronary artery stenosis. Based on Murray's law, which relates blood flow to vessel diameter, μQFR estimates pressure gradients using only angiographic data. Computational fluid dynamics principles allow it to calculate coronary flow and pressure without wires or adenosine, providing a less invasive alternative.
Unlike conventional Quantitative Flow Ratio (QFR), which requires two angiographic projections, μQFR uses the same software but relies on a single projection, making it faster and easier. Studies report an excellent correlation between QFR and μQFR [5]. However, while conventional QFR is well-documented against FFR [6-10], data comparing μQFR with FFR remain limited, especially for calcified lesions [11, 12]. Integrating μQFR into clinical practice could streamline coronary assessment with a single angiographic run. This study examines the diagnostic accuracy, sensitivity, and specificity of μQFR compared to FFR for evaluating calcified coronary stenosis, aiming to assess its potential as a complement or alternative to FFR in guiding revascularization.
2 Methods
2.1 Study Design
The DIAMOND two-center study was designed to evaluate the diagnostic accuracy of online μQFR in identifying hemodynamically significant calcified coronary artery lesions (Class B2 or C, according to the AHA/ACC classification), using FFR as the reference standard. μQFR analyses were performed offline and in a blinded manner, while FFR analyses were conducted during the procedure.
The study complied with the Declaration of Helsinki and Good Clinical Practice guidelines. It was conducted at the University & Hospital of Fribourg and Cecil clinic, Lausanne (Switzerland). All patients provided written informed consent. The authors had full access to all study data and are collectively responsible for the integrity of the analysis.
2.2 Study Population
Adults with suspected or known coronary artery disease, undergoing urgent, elective or staged coronary angiography between June 27, 2020, and August 22, 2024, due to a high risk of significant coronary stenosis, were eligible if they met the angiographic criteria.
The angiographic inclusion criteria were as follows: at least one stenosis with a percent diameter stenosis between 30% and 90% in a vessel with a reference size > 2 mm by visual estimation, and the presence of lesion calcifications meeting “type B2 or C” angiographic characteristics as defined by the modified ACC/AHA lesion classification.
Exclusion criteria included severe asthma or severe chronic obstructive pulmonary disease, allergy to the contrast agent or adenosine, atrial fibrillation, ostial lesions located < 3 mm from the aorta, severe vessel overlap, luminal reduction caused by a myocardial bridge, and poor angiographic image quality that precluded contour detection.
2.3 Study Procedure
2.3.1 Coronary Angiography
Angiographic images were recorded at a minimum of 12.5 frames per second by monoplane radiographic system (Azurion 3, Philips Healthcare, NL). Only videos in which angiographic images acquisition has been realized to minimize vessel overlap and foreshortening have been selected for μQFR assessment. The contrast medium was injected manually with a forceful and stable injection with ACIST CVi contrast injector (Bracco, I).
2.3.2 FFR Measurement
FFR was measured in accordance with established guidelines [13]. The OptoWire® (OpSens Medical, MN, USA) and PressureWire X® (Abbott Vascular, IL, USA) pressure wires were used at the operator's discretion. Hyperemia was induced using intracoronary adenosine boluses (100 µg for the right coronary artery and 200 µg for the left coronary artery). The location of the pressure sensor was documented angiographically for all measurements. Pressure data were recorded for at least 3 s of stable values before adenosine administration and at least 10 s of stable values during hyperemia, as per the hospital protocol. A drift value within the range of 0.04 was considered acceptable; otherwise, the procedure was repeated. For FFR values between 0.75 and 0.85, a stricter drift value of ≤ 0.02 was required.
2.3.3 μQFR Assessment and Computation
The μQFR system used was AngioPlus (Pulse Medical Imaging Technology, Shanghai Co. Ltd., Shanghai, China). Investigators transferred a single angiographic image run from the local network to the μQFR system. The lumen contour was automatically delineated using the μQFR system's algorithms. The “contrast flow model” was applied for μQFR computation, and the contrast frame count was performed on an angiographic run where contrast movement was clearly visualized. μQFR analysis was conducted by a trained nurse from the catheterization laboratory who had undergone dedicated training on the μQFR software. The nurse was informed of the lesion location of interest but remained blinded to FFR values and other clinical or procedural information.
2.4 Data Analysis and Data Management
All angiographic imaging data, μQFR analyses, FFR traces, and values were collected by local investigators for offline analysis. Source data, including the μQFR reports and FFR values, were collected online by local investigators and subsequently transferred into an electronic data capture system for statistical analysis.
2.5 Endpoints
The primary endpoints were the sensitivity and specificity of μQFR in identifying hemodynamically significant coronary stenosis, using FFR as the gold standard. The secondary endpoint was the diagnostic accuracy of μQFR (≤ 0.8 or > 0.8) compared with FFR (≤ 0.8 or > 0.8) as the gold standard.
2.6 Definitions
Diagnostic accuracy was defined as the consistency of μQFR-evaluated outcomes (≤ 0.8 or > 0.8) with FFR-evaluated outcomes (≤ 0.8 or > 0.8). Sensitivity represents the proportion of μQFR ≤ 0.8 in vessels with hemodynamically significant stenosis (FFR ≤ 0.8). Specificity represents the proportion of μQFR > 0.8 in vessels without hemodynamically significant stenosis (FFR > 0.8).
2.7 Statistical Analysis
We first assessed the distribution of continuous variables by visually inspecting histograms and performing the Shapiro–Wilk test for univariate normality, supplemented by Mardia's test for bivariate normality. Homoscedasticity (constant variance) was evaluated using the Breusch–Pagan test. Because these checks indicated that normality and homoscedasticity assumptions were not satisfied, continuous variables are summarized as median (interquartile range), and group comparisons are conducted via the Mann–Whitney U test. Categorical variables are summarized using counts and percentages. To evaluate the relationship between μQFR and FFR, we used the Spearman correlation coefficient, a nonparametric measure robust to departures from normality. Agreement between μQFR and FFR was further assessed via Bland–Altman plots. Observations from patients with more than one study vessel were treated as independent. All statistical analyses and visualizations were performed in Python (version 3.13.0) using the SciPy library (version 1.10.1) for statistical tests, NumPy (version 1.24.3) and Pandas (version 2.0.1) for data handling, Scikit-learn (version 1.5.2) for auxiliary functions, and Matplotlib (version 3.7.1) for plotting. The workflow was executed in Visual Studio Code (version 1.95, © Microsoft 2025) and connected to a local PostgreSQL database (version 14.15) administered through DBeaver (version 24.3.4, 2025).
3 Results
3.1 Baseline Patient and Lesion Characteristics
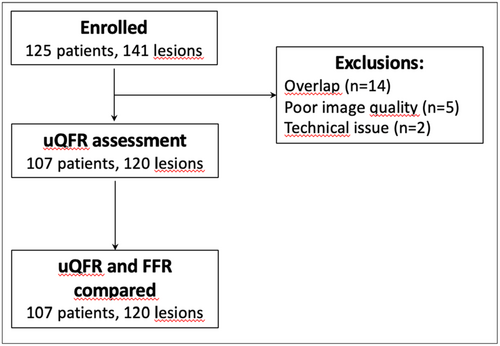
Between June 27, 2020, and August 22, 2024, a total of 125 patients met the inclusion and exclusion criteria and were enrolled in the study. Paired assessments of μQFR and FFR were available for 107 patients and 120 lesions. Figure 1 presents the study flowchart.

The mean age of the patients was 67.8 ± 9.9 years; 22.4% were women, 26.2% had diabetes mellitus, and 24% had a previous myocardial infarction. Baseline medical characteristics of the patients are summarized in Table 1, while procedural and vessel characteristics are detailed in Table 2. Among the 107 patients included in the study, seven patients (6.5%) underwent an urgent percutaneous angiographic procedure due to myocardial infarction or acute coronary syndrome (ACS), while 100 patients (93.5%) underwent an elective procedure. Within the elective procedure subgroup, the most common clinical presentation was silent ischemia, observed in 69 patients (69%). Stable angina pectoris was present in 17 patients (17%), whereas six patients (6%) had unstable angina pectoris at the time of the elective procedure. A total of eight patients (8%) underwent a staged coronary angiogram as part of a planned assessment. Among the tested vessels, 88 (73.3%) were left anterior descending arteries, 14 (11.7%) were right coronary arteries, and 9 (7.5%) were left circumflex arteries. Bifurcation lesions were present in 24% of cases, and all lesions exhibited moderate or severe calcification, classified as B2 or C according to the ACC/AHA classification. Of these, 104 (86.7%) vessels had type-B2 lesions, and 16 (13.3%) had type-C lesions. The mean FFR was 0.78 ± 0.1, with a mean vessel stenosis of 56.8% ± 10.1%. An FFR ≤ 0.80 was observed in 84 (70%) vessels, while 58 (48.3%) vessels had an FFR between 0.75 and 0.85.
| Age, years | 67.8 ± 9.9 |
| Female sex | 24/107 (22.4%) |
| Body mass index, kg/m2 | 27.6 ± 5.3 |
| Diabetes mellitus | 28/107 (26.2%) |
| Arterial Hypertension | 77/107 (72%) |
| Dyslipidemia | 99/107 (92.5%) |
| Current smoker | 34/107 (31.8%) |
| Former smoker | 22/107 (20.6%) |
| Family history of coronary artery disease | 35/107 (32.7%) |
| Previous myocardial infarction | 25/104 (24%) |
| Previous PCI | 49/107 (45.8%) |
| Previous CABG | 3/107 (2.8%) |
| Left ventricular ejection fraction, % | 60.5 ± 25.9 |
| Percutaneous angiographic procedure | |
| Urgent procedure: Myocardial infarction/acute coronary syndrome | 7/107 (6.5%) |
| Elective procedure | 100/107 (93.5%) |
| Clinical presentation for elective procedure:
|
69/100 (69%) |
|
8/100 (8%) |
|
17/100 (17%) |
|
6/100 (6%) |
- Note: Values are mean ± SD or % (n). PCI is for percutaneous coronary intervention, CABG stands for Coronary Artery Bypass Grafting, NSTEMI for Non-ST-Elevation Myocardial Infarction.
| Characteristic | Value |
|---|---|
| Number of tested vessels | 120 |
| Left main coronary artery | 4/120 (3.3%) |
| Left anterior descending artery | 88/120 (73.3%) |
| Diagonal branch | 1/120 (0.8%) |
| Left circumflex artery | 9/120 (7.5%) |
| Marginal branch | 2/120 (1.7%) |
| Right coronary artery | 14/120 (11.7%) |
| Posterior descending artery | 0/120 |
| Posterolateral branch | 1/120 (0.8%) |
| Ramus intermedius branch | 1/120 (0.8%) |
| Calcified lesions | 120/120 (100%) |
| Type B2 | 104/120 (86.7%) |
| Type C | 16/120 (13.3%) |
| Bifurcation lesions | 29/120 (24.2%) |
| Mean diameter stenosis | 56.8% ± 10.1% |
| Vessels with FFR ≤ 0.80 | 84/120 (70%) |
| Vessels with FFR > 0.80 | 36/120 (30%) |
| Vessels with 0.75 ≤ FFR ≤ 0.85 | 58/120 (48.3%) |
| Patients with FFR in > 1 Vessel | 13/107 (12.1%) |
| Mean FFR | 0.78 ± 0.1 |
| Mean μQFR | 0.79 ± 0.09 |
- Note: Values are mean ± SD or % (n).
3.2 Correlation and Agreement Between μQFR and FFR
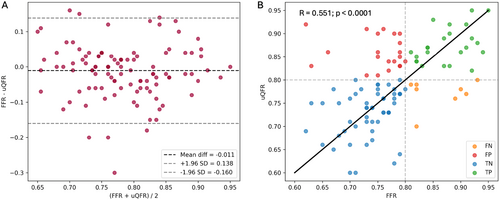
μQFR demonstrated an intermediate correlation with FFR (r = 0.551; p < 0.0001) and a good agreement (mean difference: −0.011 ± 0.076) (Figure 2). The absolute numerical difference between μQFR and FFR exceeded 0.10 in 25 (20.8%) vessels and 0.05 in 48 (40%) vessels. Numerical differences greater than 0.10 were observed in 17% of the interrogated left anterior descending arteries, 11.1% of left circumflex arteries, and 35.7% of right coronary arteries (Table 3).

| FFR > 0.8 | FFR ≤ 0.8 | |
|---|---|---|
| QFR > 0.8 | 28/120 (23.3%) | 21/120 (17.5%) |
| QFR ≤ 0.8 | 8/120 (6.7%) | 63/120 (52.5%) |
| Difference between μQFR and FFR | ||
| > 0.05 | 48/120 (40%) | |
| > 0.10 | 25/120 (20.8%) | |
| Left main coronary artery | 2/4 (50%) | |
| Left anterior descending artery | 15/88 (17%) | |
| Left circumflex artery | 1/9 (11.1%) | |
| Right coronary artery | 5/14 (35.7%) | |
- Note: Clinical discordance occurred in 29 (24.2%) vessels: FFR > 0.8 but QFR ≤ 0.8 in 8 (6.7%) vessels, while FFR ≤ 0.80 but μQFR > 0.80 in 21 (17.5%) vessels. Abbreviation: FFR = fractional flow reserve.
3.3 Diagnostic Performance of μQFR for Identifying Significant Stenosis
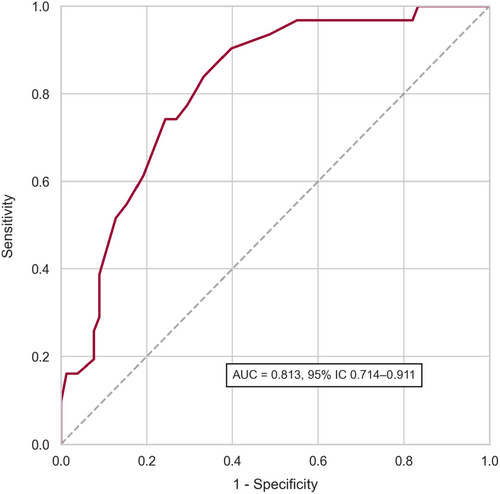
μQFR showed a sensitivity of 75% (95% CI: 65.6%–84.6%) and a specificity of 77.8% (95% CI: 63.5%–92.0%) with FFR as the reference standard. The overall diagnostic accuracy was 75.8% (95% CI: 68.1%–83.6%). As shown in Figure 3, the area under the receiver operating curve was 0.813 (95% CI: 0.714–0.911). Positive predictive value, negative predictive value, positive likelihood ratio, and negative likelihood ratio were 88.7%, 57.1%, 3.38, and 0.32, respectively. Table 4 presents the diagnostic accuracy of μQFR compared to FFR.

| Metric | Estimate, % (95% CI) |
|---|---|
| Accuracy | 75.83% (68.06%–83.60%) |
| Sensitivity | 75.00% (65.55%–84.55%) |
| Specificity | 77.78% (63.51%–92.04%) |
| Positive predictive value (PPV) | 88.73% (81.19%–96.27%) |
| Negative predictive value (NPV) | 57.14% (42.78%–71.50%) |
| Positive likelihood ratio ( + LR) | 3.38 (1.80–10.62) |
| Negative likelihood ratio (–LR) | 0.32 (0.17–0.54) |
3.4 Clinical Discordance
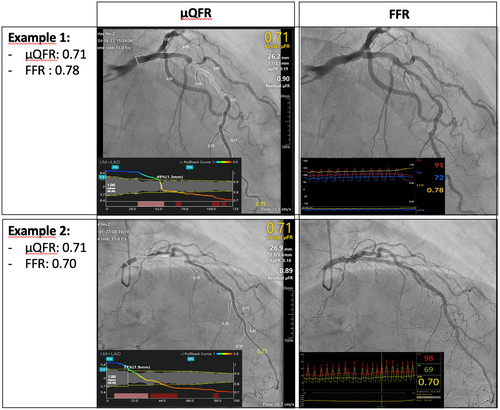
Clinical discordance occurred in 29 (24.2%) vessels. In 8 (6.7%) vessels, FFR was > 0.8 while μQFR was ≤ 0.8. Conversely, in 21 (17.5%) vessels, FFR was ≤ 0.8 while μQFR was > 0.8 (Table 3). Representative examples of Murray Law-Based Quantitative Flow Ratio (μQFR) and FFR analysis are shown in Figure 4.

4 Discussion
In this study, we investigated the diagnostic performance of μQFR in moderate-to-severe calcified coronary lesions, using FFR as the gold standard. Our findings showed that AI-assisted μQFR demonstrated high feasibility, intermediate correlation, and moderate diagnostic performance compared to FFR in calcified coronary lesions.
Coronary calcification poses a significant challenge for all imaging-based FFR simulations, as it can interfere with the accurate identification of the vascular lumen and proper delineation of arterial structures [14]. However, μQFR computation incorporates not only anatomical parameters but also fluid dynamics variables, such as contrast product flow velocity [15]. This additional complexity may reduce its dependence on the impact of calcifications compared to other imaging techniques.
While calcification is often thought to protrude into the coronary lumen, potentially altering blood flow and increasing stenosis severity, its direct effect on intracoronary pressure appears to be minimal. Borren NM et al. investigated the influence of coronary calcification on hyperemic responses during FFR measurements and found no association between the severity of coronary artery calcification and hyperemia [16]. Despite these insights, the precise effect of calcium deposits on the accuracy of μQFR calculations remains largely unknown and warrants further study.
In terms of diagnostic performance, μQFR demonstrated an accuracy of 75.8% (95% CI: 68.1%–83.6%), a sensitivity of 75.0% (95% CI: 65.6%–84.6%), and a specificity of 77.8% (95% CI: 63.5%–92.0%) compared to FFR. These results align closely with the findings of Zuo et al. [12], who analyzed 73 moderate-to-severe calcified coronary lesions and reported an accuracy of 80% (95% CI: 69%–88%), a sensitivity of 69% (95% CI: 52%–84%), and a specificity of 90% (95% CI: 76%–97%).
However, our findings fall below the diagnostic performance reported for μQFR in broader lesion populations. For example, Tu et al. [11] observed a diagnostic accuracy of 93% (95% CI: 90.3%–95.8%), a sensitivity of 87.5% (95% CI: 80.2%–92.8%), and a specificity of 96.2% (95% CI: 92.6%–98.3%) when analyzing all-comer lesions. These discrepancies suggest that lesion characteristics, particularly the presence and severity of calcifications, may significantly influence μQFR's diagnostic accuracy.
In our study, μQFR-FFR discordance was observed in 24.2% of vessels, consistent with Zuo et al. [12], who reported discordance in 20% of vessels with intermediate-to-severe calcification, compared to only 11.7% of vessels with mild or no calcification before multivariable adjustment. This suggests that calcified plaques may play a substantial role in the observed discordance between μQFR and FFR. We hypothesize that calcification could compromise the accuracy of vessel diameter measurements and flow assumptions, potentially leading to over- or underestimation of stenosis severity compared to FFR.
We also found that μQFR had a high positive predictive value (88.7%), indicating its strength in confirming the presence of significant ischemia. However, the negative predictive value was lower at 57.1%, suggesting limitations in its ability to reliably rule out significant ischemia in calcified lesions. These findings suggest that μQFR is effective at confirming significant stenosis but requires cautious interpretation of negative results in calcified vessels. Further research is needed to optimize μQFR's application in these challenging scenarios and to better understand the influence of calcifications on its diagnostic accuracy.
5 Limitations
This study has several limitations. First, it is an offline analysis, with μQFR computations and measurements performed under optimal conditions following percutaneous coronary interventions and FFR assessments. As a result, its accuracy and feasibility in real-time, live catheterization laboratory settings remain uncertain. Second, μQFR analyses were conducted by a dedicated catheterization-laboratory nurse (CO) who had undergone 10 h of specific training. While this may limit the standardization of results, it reflects “real-life” clinical conditions more closely, as assessments were performed by a member of the local medical team rather than a specialized core laboratory. Additionally, this study did not calculate “time-to-μQFR” or “time-to-FFR,” preventing any direct comparison of the procedural timings between these two methods. Furthermore, reproducibility of μQFR analyses, as well as intra- and interobserver variability, was not assessed, leaving uncertainty about the consistency of μQFR measurements across different operators or repeated evaluations. Another limitation is that most lesions analyzed were located in the left anterior descending artery (73%) and classified as type B2 (86.7%). This may impact the generalizability of the findings, as the results may be more relevant to these specific lesion types rather than a broader spectrum of coronary lesions. Lastly, clinical decisions for the study population were based on FFR measurements, making it impossible to directly evaluate clinical outcomes using a μQFR-based diagnostic strategy. To address these gaps, randomized trials comparing FFR- and ad hoc μQFR-based diagnostic approaches for calcified coronary lesions are needed to establish their respective clinical efficacy and outcomes.
6 Conclusion
Our study indicates that while μQFR offers the advantage of being noninvasive and eliminating the need for adenosine or pressure wires, its diagnostic performance in calcified lesions remains moderate, with limitations in sensitivity and negative predictive value. These findings suggest that μQFR may complement, but not replace, FFR in the evaluation of calcified coronary lesions. In cases where accurate exclusion of significant stenosis is critical, combining μQFR with other imaging modalities or performing FFR remains essential. Further randomized trials are necessary to better define the role of AI-assisted μQFR in clinical practice and to explore strategies to enhance its diagnostic accuracy in challenging lesion subsets.
Conflicts of Interest
The authors declare no conflicts of interest.
Open Research
Data Availability Statement
The data that support the findings of this study are available from the corresponding author upon reasonable request.


