The Impact of Hydrostatic Pressure on Fractional Flow Reserve in Saphenous Vein Grafts
ABSTRACT
Background
The relationship between height differences related to graft anatomy and physiological pressure indices in coronary bypass grafts has not been studied. We sought to study the impact of hydrostatic pressure on fractional flow reserve (FFR) in saphenous vein grafts (SVGs).
Methods
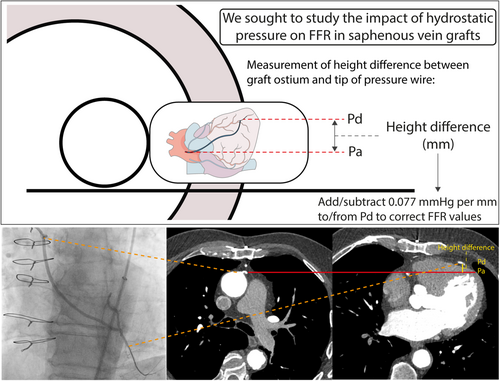
Included were 66 symptomatic patients (76 SVGs) with prior coronary artery bypass grafting who underwent coronary computed tomography angiography (CCTA) preceding invasive coronary angiography with FFR interrogation of ≥ 1 SVGs. The graft course and height excursion were reconstructed based on CCTA images. The impact of hydrostatic pressure on FFR (corrected FFR) was calculated by adding or subtracting 0.077 mmHg to the distal coronary pressure for every millimeter height difference in a supine position between the SVG ostium and the pressure wire tip position.
Results
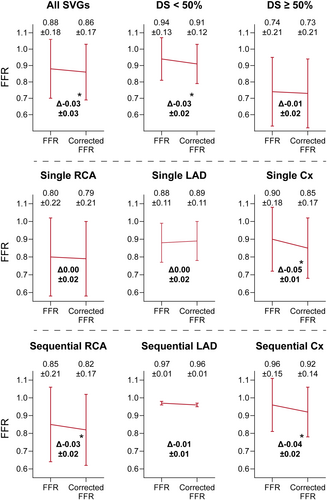
The height difference (mm) between the SVG ostium and pressure wire tip position was largest for single SVGs to the circumflex artery (Cx; −55.1 ± 17.0), followed by sequential SVGs to the Cx (−51.8 ± 17.3) and the right coronary artery (RCA; −36.7 ± 21.6). The correlation between height difference and uncorrected FFR was −0.59 (p < 0.001). Corrected FFR was lower as compared to uncorrected FFR in the overall cohort (0.86 ± 0.17 vs. 0.88 ± 0.18), in single SVGs to Cx (0.85 ± 0.17 vs. 0.90 ± 0.18), and in sequential SVGs to Cx (0.92 ± 0.14 vs. 0.96 ± 0.15) and RCA (0.82 ± 0.17 vs. 0.85 ± 0.21) (p < 0.001 for all).
Conclusions
Hydrostatic pressure related to height differences along the course anatomy of SVGs can impact FFR measurements, with corrected FFR being significantly lower in SVGs to the Cx and sequential SVGs to the RCA.
Abbreviations
-
- CABG
-
- coronary artery bypass grafting
-
- CAD
-
- coronary artery disease
-
- CCTA
-
- coronary computed tomography angiography
-
- Cx
-
- circumflex artery
-
- FFR
-
- fractional flow reserve
-
- ICA
-
- invasive coronary angiography
-
- LAD
-
- left anterior descending artery
-
- LIMA
-
- left internal mammary artery
-
- Pa
-
- aortic pressure
-
- PCI
-
- percutaneous coronary intervention
-
- Pd
-
- distal coronary pressure
-
- RCA
-
- right coronary artery
-
- SVG
-
- saphenous vein graft
1 Introduction
Fractional flow reserve (FFR) is guideline-recommended for decision-making on coronary revascularization of intermediate lesions in patients presenting with angina or angina-equivalent symptoms [1, 2], as it has shown superior patient outcome as compared to angiographic lesion evaluation or a conservative strategy [3, 4]. In patients with prior coronary artery bypass grafting surgery (CABG), revascularization of bypass conduits is currently recommended based on angiographic assessment of stenosis severity [5]. With saphenous vein graft (SVG) failure reported at 50% within 10 years [6, 7], there has been a growing interest in the applicability of FFR to guide revascularization in coronary bypass grafts [8-11]. In native coronary arteries, significant differences in FFR values have been observed based on their corresponding coronary territories [12, 13]. One possible explanation for these observed differences can be the variation in height between the tip of the pressure wire and the reference point, resulting in a hydrostatic pressure effect that impacts distal coronary pressure (Pd) and as such the FFR. Indeed, the hydrostatic pressure effect has been described to significantly affect FFR values in both in vivo and in vitro experiments, wherein coronary computed tomography angiography (CCTA) is frequently employed to calculate height differences [14-19]. Notably, uncorrected FFR—that is, normal FFR without the correction for hydrostatic pressure—is lower in vessels with an anterior course and higher in those with a posterior course compared to the coronary ostium [15-17]. SVGs diverge in origin, geometry and trajectory from native coronary arteries, which may result in a different pressure impact on FFR values compared to native coronary arteries. To date, the impact of hydrostatic pressure on FFR measurements in SVGs has not been studied. Therefore, we sought to explore SVG course anatomy and assess the impact of hydrostatic pressure on FFR measurements in SVGs.
2 Methods
2.1 Patient Population
This study included patients selected from the VIADUCT (Prior CABG Patients Evaluated for Saphenous Vein Graft DysfUnction and Progression of Coronary arTery Disease) registry (ClinicalTrials.gov Identifier: NCT04772768), which is a prospective initiative including patients with a history of CABG and one or more SVGs who are referred to the Amsterdam University Medical Centers for clinical evaluation of symptoms indicative of recurrent ischemia. For the current study, all patients who underwent CCTA as part of a pre-procedural work-up for invasive coronary angiography (ICA) [20], and had FFR assessed in at least 1 SVG during ICA were eligible for inclusion. The study protocol was approved by the medical ethics committee at our institution and conducted in accordance with the guidelines of the Declaration of Helsinki. Written informed consent was obtained from all patients.
2.2 ICA and Physiological Pressure Measurements
ICA images were acquired using a monoplane cardiovascular X-ray system (Allura Xper FD 10/10; Philips Healthcare, Best, The Netherlands). Single and sequential vein grafts were both included in the study. Single grafts were conduits with a single distal anastomosis. Grafts with more than one non-occluded anastomosis were considered as sequential. The graft anastomoses were described according to the three vascular territories (left anterior descending artery [LAD], circumflex artery [Cx] and right coronary artery [RCA]). SVGs anastomosed to the LAD and diagonal branches were defined as graft to the LAD territory. SVGs to the Cx, obtuse marginal, anterolateral and left posterolateral were defined as graft to the Cx territory. Finally, grafts to the distal RCA, posterior descending artery (PDA) and right posterolateral artery (RPL) were defined as graft to the RCA. For sequential grafts, delineation of graft anatomy was based on non-occluded graft anastomoses, with the most distal anastomosis defining the target territory. Venous bypass grafts were interrogated in a supine position with the 0.014-inch PressureWire X Guidewire (Abbott, USA). Pressure equalization was performed in the graft ostium. After administration of ≥ 200 mg intra-graft nitroglycerin, the wire was positioned distally either in the venous graft close to the most distal non-occluded anastomosis or in the native vessel positioning the pressure sensor 2−3 cm beyond the anastomosis. The position of the pressure wire was stored to match the measurement location on CCTA imaging. Hyperemia was induced with intra-graft injection of 150 μg adenosine diluted in 10 mL saline solution, manually through the guiding catheter, and immediately flushed by 10 mL pure saline solution. Resting Pd/aortic pressure (Pa) and FFR were calculated as the ratio of mean distal coronary pressure to mean aortic pressure under resting and hyperemic conditions, respectively. FFR ≤ 0.80 was considered significant SVG disease. Percentage diameter stenosis (%DS) of all SVGs was assessed using 2D quantitative coronary angiography (2D-QCA; Agfa HealthCare Enterprise Imaging, Mortsel, Belgium).
2.3 CCTA to Assess SVG Course Anatomy and to Correct for Hydrostatic Pressure
Patients underwent CCTA on a Brilliance iCT 256-slice CT-scanner (Philips Healthcare, Best, the Netherlands) using a collimation of 128 × 0.90 mm and a tube rotation time of 350 ms; or on a 3rd generation dual source Somatom Force 2 × 192-slice CT scanner (Siemens Healthineers, Erlangen, Germany) using a collimation of 2 × 96 × 0.60 mm and a tube rotation time of 250 ms. All scans were performed in the supine position with the patients holding their breath at full inspiration. The tube voltage (70−120 kV) and current (180−600 μA) were selected based on body habitus. Scans were acquired in a prospective ECG-triggered approach in diastole. A patient-tailored contrast delivery protocol was used based on body habitus and kV settings. The field of view was adjusted to include the graft ostium. In patients with a heart rate of ≥ 65 beats per minute before scan acquisition, short acting oral or intravenous metoprolol was administered before the scan. Patients received sublingual nitroglycerine (800 mcg) per protocol, which was administered before scanning. All CCTA images were reconstructed and analyzed using a dedicated working station (IntelliSpace, Philips Health Care, Best, The Netherlands; or SyngoVia, Siemens Healthineers, Erlangen, Germany). The ostium of each graft was allocated to the anterior, anterolateral (left or right) or lateral (left or right) aortic wall. To assess the graft course, including height excursions along the path of each individual graft, the course of each graft was marked with 10 approximately equidistant points up until the most distal anastomosis, such that each point corresponds to 10% of the graft course (graft course %). Height differences between the SVG ostium and all 10 points were measured. To assess the impact of hydrostatic pressure on resting Pd/Pa and FFR measurements, the position of the pressure wire tip during invasive measurements was located on CCTA images based on the graft anastomosis and tortuous parts as a landmark. Height difference between the SVG ostium and this position of the pressure wire tip was calculated, and a theoretical correction for resting Pd/Pa and FFR values was performed by adding physically expectable hydrostatic pressure of 0.077 mmHg per mm height difference to the Pd (Central Illustration) [14]. In case of a negative height difference, that is, the pressure wire tip is lower than the SVG ostium, 0.077 mmHg per mm was subtracted from the Pd. All analyses were performed by a primary assessor (S.P.) and verified by a secondary assessor (R.H.). If there was a difference of > 5 mm between the two measurements, consensus was reached with assistance of a third assessor (R.J.).
2.4 Statistical Analysis
Continuous variables are presented as mean with standard deviation (SD) and categorical variables as numbers with percentages. The correlation between height differences and resting Pd/Pa and FFR was assessed using Spearman's correlation. The difference between resting Pd/Pa and FFR and corrected Pd/Pa and FFR values were calculated for each graft and analyzed using a mixed model analysis to account for multiple vessels from the same patient. Concordance between uncorrected and corrected FFR for detecting hemodynamically significant graft disease, based on an FFR cutoff of ≤ 0.80, was estimated with calculation of kappa, which ranges from −1 (no agreement) to 1 (perfect agreement). Results were considered statistically significant at a two-sided p < 0.05. All analyses were performed in SPSS software package (IBM SPSS statistics 28.0, Armonk, New York).
3 Results
3.1 Study Population
A total of 66 patients underwent CCTA before ICA and had an FFR measurement in at least one SVG. The mean age was 71 ± 7 years, and 57 patients (87%) were male. Mean time since CABG was 15 ± 10 years. Detailed patient characteristics are described in Table 1. Of the included patients, 10 (15%) had more than one SVG with FFR measurements, resulting in a total of 76 SVGs included in the current analysis. Of those, 42 (55%) were single SVGs, mean %DS was 39 ± 17, and 23 (30%) had a %DS ≥ 50. Angiographic SVG characteristics are listed in Table 2.
| N = 66 | |
|---|---|
| Demographics | |
| Male gender | 57 (86) |
| Age (years) | 71 ± 7 |
| BMI (kg/m2) | 28.4 ± 4.2 |
| Cardiovascular risk factors | |
| Hypertension | 46 (70) |
| Hypercholesterolemia | 54 (82) |
| Diabetes mellitus | 23 (33) |
| Smoking, current or former | 52 (78) |
| Family history of CAD | 50 (76) |
| Cardiac history | |
| Prior PCI | 39 (59) |
| Prior MI | 35 (53) |
| Medication | |
| Antiplatelet therapy | 60 (91) |
| Anticoagulant | 20 (30) |
| β-Blocker | 49 (74) |
| ACE inhibitor/ARB | 47 (71) |
| Statin | 64 (97) |
| Calcium channel blockers | 20 (30) |
| Clinical presentation | |
| Typical angina | 56 (85) |
| Atypical angina | 3 (5) |
| Non-specific chest discomfort | 4 (6) |
| Other | 3 (5) |
| CABG characteristics | |
| Time since CABG (years) | 15 ± 10 |
| LIMA to LAD | 58 (88) |
| Number of total distal anastomosis | 3.6 ± 0.9 |
| Patients with ≥ 2 SVGs | 24 (36) |
- Note: Values are presented as mean ± SD or frequencies (%).
- Abbreviations: ACE, angiotensin-converting enzyme; ARB, angiotensin II receptor blocker; BMI, body mass index; CABG, coronary artery bypass grafting; CAD, coronary artery disease; LAD, left anterior descending artery; LIMA, left internal mammary artery; MI, myocardial infarction; PCI, percutaneous coronary intervention; SD, standard deviation; SVG, saphenous vein graft.
| N = 76 | |
|---|---|
| SVG characteristics | |
| Single SVGs | 42 (55) |
| Sequential SVGs | 34 (45) |
| 2D QCA | |
| Diameter stenosis (%) | 39 ± 17 |
| Diameter stenosis ≥ 50% | 23 (30) |
| Coronary territory grafted | |
| Single SVG | |
| RCA | 14 (18) |
| LAD | 12 (16) |
| Cx | 16 (21) |
| Sequential SVG | |
| RCA | 16 (21) |
| LAD | 2 (3) |
| Cx | 16 (21) |
| Grafted native vessel occluded | 64 (84) |
- Note: Values are presented as frequencies (%).
- Abbreviations: Cx, circumflex artery; QCA, quantitative coronary angiography; RCA, right coronary artery; other abbreviations as in Table 1.
3.2 SVG Course Anatomy Based on CCTA
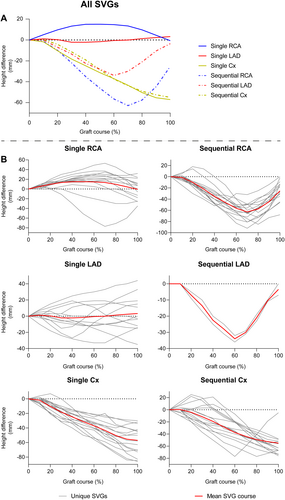
Table 3 shows the positioning of the SVG ostium based on CCTA. The proximal anastomosis was located at the anterior or anterolateral aortic wall in 75 SVGs (99%), regardless of the grafted coronary territory. The ostium of the left main (LM) coronary artery was lower than the RCA ostium on CCTA images, resulting in a mean height difference between graft ostium and native coronary ostium of −29.7 ± 8.6 mm for the LM and −4.9 ± 6.8 mm for the RCA. Height differences of the SVGs according to the grafted coronary territory using 10 equidistant points along the path of the graft are shown in Figure 1. Single grafts to the LAD territory exhibit a wide variability in their course, whereas all other grafts follow a comparable course based on their grafted coronary territory.
| Anterior or anterolateral ostium of the graft | 75 (99%) |
| Height difference in a supine position between SVG ostium native coronary ostium (mm) | |
| RCA ostium | −4.9 ± 6.8 |
| LM ostium | −29.7 ± 8.6 |
- Note: Values are presented as mean ± SD or frequencies (%).
- Abbreviations: CCTA, coronary computed tomography angiography; LM, left main; other abbreviations as in Table 1.
3.3 Pressure Wire Position and the Impact of Hydrostatic Pressure on Physiologic Measures
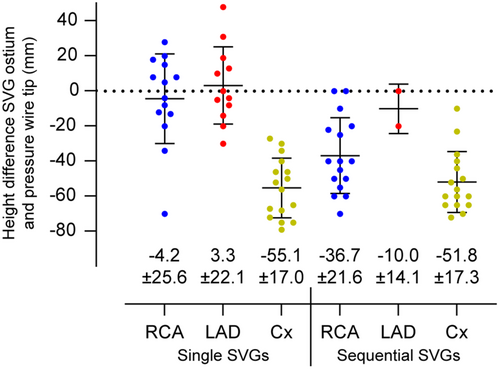
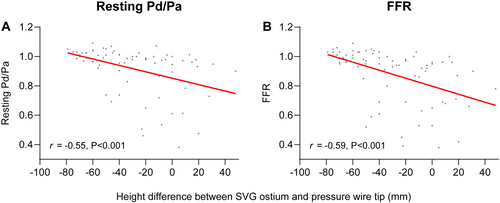
The height differences between the SVG ostium and the distal pressure wire position are presented in Figure 2. The largest height difference between SVG ostium and FFR wire position were observed in single and sequential grafts to the Cx (−55.1 ± 17.0 mm and −51.8 ± 17.3 mm), followed by sequential grafts to the RCA and LAD (−36.7 ± 21.6 mm and −10.0 ± 14.1 mm) and single grafts to the RCA and LAD (−4.2 ± 25.6 mm and 3.3 ± 22.1 mm). There was a significant correlation between height difference and uncorrected resting Pd/Pa ratio (r = −0.55, p < 0.001) and between height difference and uncorrected FFR (r = −0.59, p < 0.001) (Figure 3). Mean uncorrected resting Pd/Pa and FFR of all SVGs were 0.92 and 0.88, respectively (Supporting Information: Figure S1 and Figure 4). Corrected Pd/Pa and FFR based on hydrostatic effect were significantly lower compared to the uncorrected values, respectively at 0.89 (Δ−0.03, p < 0.001) and 0.86 (Δ−0.03, p < 0.001). Corrected resting Pd/Pa and FFR were significantly lower as compared to uncorrected values in single SVGs to the Cx (Δ−0.04 and Δ−0.05, both p < 0.001), in sequential SVGs to the RCA (both Δ−0.03, p < 0.001) and in sequential SVGs to the Cx (both Δ−0.04, p < 0.001). No significant differences were found for grafts to all other coronary territories. (Supporting Information: Figure S1 and Figure 4) Based on an FFR cutoff of ≤ 0.80 to classify a territory as ischemic, 19/76 SVGs (25%) had a significant uncorrected FFR, while 18/76 (24%) had a significant corrected FFR, resulting in a global agreement with a kappa of 0.96 (Table 4).
| Significant corrected FFR (≤ 0.80) | ||||
|---|---|---|---|---|
| No | Yes | Total | ||
| Significant uncorrected FFR (≤ 0.80) | No | 57 | 0 | 57 |
| Yes | 1 | 18 | 19 | |
| Total | 58 | 18 | 76 | |
- Note: Kappa: 0.96.
- Abbreviation: FFR, fractional flow reserve.
4 Discussion
To the best of our knowledge, this study is the first to explore height excursions along the SVG course using CCTA and to assess the impact of hydrostatic pressure on FFR measurements in SVGs. The main findings of this study are: (1) the largest height difference (in mm) between the SVG ostium and pressure wire tip position was observed in single SVGs to the Cx, followed by sequential SVGs to the Cx and the RCA; (2) there was a significant negative correlation between height difference and both uncorrected resting Pd/Pa and FFR; and 3) corrected Pd/Pa and FFR based on hydrostatic effect were significantly lower compared to uncorrected pressure measurements, which was primarily related to single SVGs to the Cx and sequential SVGs to the RCA and Cx.
4.1 Graft Course and Its Impact on Height Differences
In 99% of all SVGs, the ostium was positioned at the anterior or anterolateral wall of the aorta, which is in line with recommendations from experienced surgeons [21]. As a result, the supine height differences between the SVG ostium and native coronary ostia was larger for the LM ostium than for the RCA, as the LM ostium is located more posterior than the RCA ostium. Similar to our method, Kawaguchi et al. used CCTA to assess height differences in native vessels measured with FFR, and found average height differences of approximately +48 mm in the LAD, −24 mm in the Cx and −29 mm in the RCA [17]. Interestingly, SVGs to the LAD in our study did not demonstrate such a large difference, whereas SVGs to the Cx demonstrated a larger difference. One explanation for these differences is the distance between the SVG and the native LM ostium. The native LAD has an anterior trajectory from its LM ostium, thus decreasing height differences when the ostium is located more anteriorly, as is the case for SVGs. Conversely, the Cx has a posterior trajectory from the LM, resulting in larger height differences. Moreover, 88% of the patients included in our study having a left internal mammary artery to the LAD, meaning most SVGs to the LAD territory would in fact anastomose a diagonal branch. Diagonal branches have a more horizontal course when a patient is in a supine position, further reducing height differences in SVGs to the LAD compared to native arteries. Importantly, single SVGs to the LAD demonstrated a wide variety in graft course with varying distal point heights, influencing the average height difference. Another interesting finding in our study is the difference in height between single and sequential RCA grafts. In our cohort, single SVGs to the RCA were often anastomosed more proximally on the RCA, before the junction with the PDA and RPL, and by that sometimes more anterior than the SVG ostium. In contrast, none of the sequential SVGs to the RCA were anastomosed more anterior than the SVG ostium, indicating a distinct difference in anastomosis location between single and sequential SVGs. Possibly, this difference is due to the preceding anastomosis of sequential SVGs to the RCA, which often involve the more posterior located Cx territory and are thus more closely attached to the Cx territory compared to single SVGs to the RCA.
4.2 The Impact of Hydrostatic Pressure on FFR in SVGs
The impact of hydrostatic pressure on FFR measurements in native coronary arteries has been well established [15, 16, 22, 23]. These studies have consistently demonstrated a higher value for corrected FFR in the LAD and a lower FFR value in the Cx compared to uncorrected measurements, while results for the RCA are inconsistent. Presumably, the conflicting results for the RCA are likely due to its anatomical course, where the RDP branch generally ascends toward the apex, while the RPL branch follows a more posterior direction as compared to the RCA ostium. However, the impact of hydrostatic pressure on FFR measurements in SVGs has not been previously explored. Our study found a significant association between increased height difference and lower uncorrected FFR values, indicating that—similar as to native coronary arteries—FFR measurements in SVGs may also be affected by hydrostatic pressure. Indeed, by applying the method to correct FFR values for the observed height differences as previously described by Härle et al. [14] we found a significant difference between corrected and uncorrected FFR values. Following their distribution in course anatomy, this difference was driven by SVGs to the Cx and sequential SVGs to the RCA, while FFR values in single SVGs to the RCA and SVGs to the LAD were not affected. Similar results were observed for resting Pd/Pa, suggesting that these findings might be extrapolated to other invasive resting pressure indices as well [24, 25]. As such, physicians interpreting pressure measurements to assess the hemodynamic impact of bypass graft lesions should consider height differences along the graft's course, as these differences can impact the observed value at the distal tip of the pressure wire. Yet, only one SVG showed a switch in hemodynamic significance after correction for hydrostatic pressure based on a native FFR cutoff of ≤ 0.80, whereas studies on native coronaries reported a discordance rate of 12%−13% between corrected and uncorrected FFR values of intermediate lesions [15, 19, 22, 23]. The higher agreement in our study may be partially attributed to the fact that only 30% of the SVGs in our study had a diameter stenosis ≥ 50%. Moreover, the native FFR cutoff may not be directly applicable to define hemodynamically obstructive SVG lesions. Studies assessing the deferral of PCI based on FFR showed worse survival for patients with deferral of SVG lesions compared to deferral of native vessel lesions, and identified deferral of SVG lesions as an independent predictor for target vessel failure [10, 26]. In all of these studies, an FFR cutoff of 0.80 was applied to determine hemodynamic significance, without correcting for hydrostatic pressure. The results of these studies might be affected by hydrostatic pressure and suggest that the prognostically important threshold of uncorrected FFR in SVGs could be higher than that of native vessels. This hypothesis aligns with our findings, which demonstrated that uncorrected FFR is indeed higher than the actual FFR in SVGs. Nevertheless, the prognostic value of FFR in SVGs has not been studied in a randomized fashion. Our results indicate that hydrostatic pressure should be accounted for in future research on the prognostic value of FFR in SVGs.
4.3 Limitations
First, this is an observational study with a relatively small sample size. Second, we used the estimated impact of height on pressure measurements that has been established in prior in vitro studies but has not been validated for SVGs. Third, our study lacks myocardial perfusion imaging, hence a correlation between corrected pressure measurements and non-invasive functional assessment of lesion severity could not be established. Fourth, a relatively small number of diseased SVGs classified by angiographic stenosis severity were included, which may have led to an overestimation of the agreement between corrected and uncorrected FFR. Fifth, this study lacks clinical outcome data, hence the prognostic impact of hydrostatic pressure on FFR in SVGs is yet to be established.
5 Conclusion
The anatomical course of SVGs follows a wide distribution related to the anastomosis structure, causing height differences between the SVG ostium and pressure wire tip during invasive hemodynamic measurements. An increase in height difference leads to lower FFR values. As such, similar as to native arteries, hydrostatic pressure related to height differences along the course anatomy of SVGs can impact FFR measurements, with corrected FFR being significantly lower in SVGs to the Cx and sequential SVGs to the RCA. During the invasive physiological evaluation of venous bypass grafts with FFR, the potential effect of hydrostatic pressure related to height differences along the course anatomy of the graft should be considered.
Acknowledgments
The authors have nothing to report.
Conflicts of Interest
Dr Knaapen has received research grants from Cleerly Inc. and HeartFlow Inc. The other authors declare no conflicts of interest.
Open Research
Data Availability Statement
The data that support the findings of this study are available from the corresponding author upon reasonable request.


