Finite element modeling with patient-specific geometry to assess clinical risks of percutaneous pulmonary valve implantation
Abstract
Background
Percutaneous pulmonary valve implantation (PPVI) is a non-surgical treatment for right ventricular outflow tract (RVOT) dysfunction. During PPVI, a stented valve, delivered via catheter, replaces the dysfunctional pulmonary valve. Stent oversizing allows valve anchoring within the RVOT, but overexpansion can intrude on the surrounding structures. Potentially dangerous outcomes include aortic valve insufficiency (AVI) from aortic root (AR) distortion and myocardial ischemia from coronary artery (CA) compression. Currently, risks are evaluated via balloon angioplasty/sizing before stent deployment. Patient-specific finite element (FE) analysis frameworks can improve pre-procedural risk assessment, but current methods require hundreds of hours of high-performance computation.
Methods
We created a simplified method to simulate the procedure using patient-specific FE models for accurate, efficient pre-procedural PPVI (using balloon expandable valves) risk assessment. The methodology was tested by retrospectively evaluating the clinical outcome of 12 PPVI candidates.
Results
Of 12 patients (median age 14.5 years) with dysfunctional RVOT, 7 had native RVOT and 5 had RV-PA conduits. Seven patients had undergone successful RVOT stent/valve placement, three had significant AVI on balloon testing, one had left CA compression, and one had both AVI and left CA compression. A model-calculated change of more than 20% in lumen diameter of the AR or coronary arteries correctly predicted aortic valve sufficiency and/or CA compression in all the patients.
Conclusion
Agreement between FE results and clinical outcomes is excellent. Additionally, these models run in 2–6 min on a desktop computer, demonstrating potential use of FE analysis for pre-procedural risk assessment of PPVI in a clinically relevant timeframe.
Abbreviations
-
- AR
-
- aortic root
-
- AVI
-
- aortic valve insufficiency
-
- BPV
-
- balloon pulmonary valvuloplasty
-
- CA
-
- coronary artery
-
- CT
-
- computed tomography
-
- DORV
-
- double outlet right ventricle
-
- F
-
- female
-
- FE
-
- finite element
-
- M
-
- male
-
- PPVI
-
- percutaneous pulmonary valve implantation
-
- RVOT
-
- right ventricular outflow tract
-
- TGA
-
- transposition of great arteries
-
- TOF
-
- tetralogy of fallot
1 INTRODUCTION
Congenital heart disease affects almost 1% of live births,1 with approximately 20% of these cases involving abnormal right ventricular outflow tract (RVOT) or pulmonary valve anatomy.2 These conditions include a variety of congenital heart diseases, including tetralogy of Fallot, double outlet right ventricle, isolated pulmonary valve stenosis, and truncus arteriosus.3 Typically, these conditions require surgical intervention during early childhood, involving procedures like transannular patch plasty or the implantation of valved conduits.4, 5 Unfortunately, degeneration of these conduits is inevitable over time and leads to RVOT dysfunction (stenosis or insufficiency or commonly a combination of both),6 necessitating multiple re-interventions over the life spans of these patients.
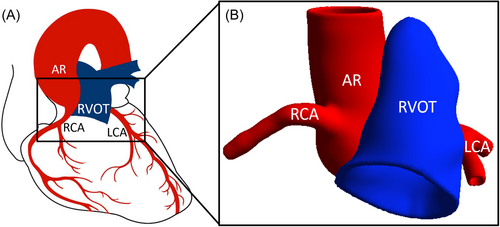
Percutaneous pulmonary valve implantation (PPVI) is a non-surgical treatment for RVOT dysfunction. During PPVI using balloon expandable valves, traditionally, the valve is delivered via catheter to replace the stenosed or leaky valve. The stented valve is anchored by expanding the stent to a diameter larger than the native vessel. The proximity of the RVOT to neighboring vessels, particularly coronary arteries (CAs) and the aortic root (AR), introduces the risk of CA compression and/or aortic valve insufficiency (AVI) due to stent oversizing (Figure 1). Torres et al.7 reported that approximately 14% of patients who underwent balloon test sizing before device placement (5% of total patient pool) experienced AR distortion and/or AVI. Similarly, CA compression is observed during balloon sizing in about 5% of all patients8, 9 and up to 21% in patients with abnormal CA anatomy.8 These concerns are magnified in complex congenital heart disease patients, where variable anatomy, iatrogenic distortions, and prior interventions make assessing AR or CA compression risk using existing noninvasive imaging methods challenging. If undetected before PPVI, AR, or CA compression can be disastrous or even fatal.10
The current gold standard for assessing these risks in the congenital catheterization laboratory involves balloon sizing/angioplasty before stent/valve deployment.8 Despite its high success rate at assessing coronary compression risk, stent/valve expansion pre-testing in the catheterization laboratory has limitations, including misinterpretation,11 invasiveness, potential hemodynamic effects, and healthcare cost implications. Alternative approaches to assess PPVI risks without balloon sizing include assessing potential structural complications using computed tomography (CT),12-14 magnetic resonance imaging,13, 14 and 3D printing.13, 15 However, these methods do not assess the complex interaction that happens during stent deployment and the resultant outcomes.
Finite element (FE) modeling is a computer-aided design and analysis tool with potential to assess PPVI risks virtually, as demonstrated by previous studies.16, 17 Caimi et al.16 simulated PPVI with balloon-expandable valves for three candidates, correctly identifying CA compression in one and successful PPVI in the other two. Capelli et al.17 modeled seven patients, accurately predicting outcomes in six, including one CA compression case and five patients with successful PPVIs. Neither study addressed the risk of AVI. The computational time required for complex FE analysis poses a challenge in the clinical setting. Caimi et al.'s16 models, which simulated interactions between the catheter, balloon, and stent, took ~300 h to run on 16 central processing units. Capelli et al.17 did not report timing, but their models included similar detail.
An accurate computer-based predictor of PPVI complication risk would be of clear value, and the work of Caimi and Capelli demonstrates the FE modeling's potential value. Herein, we develop a simplified, efficient computational methodology for identifying potential structural complications of PPVI using balloon expandable valves, and we test the methodology in a preliminary retrospective study.
2 METHODS
This IRB-approved retrospective study was performed at the University of Minnesota. Patients who underwent transcatheter RVOT testing using balloon (for intended balloon-expandable stent or stented valve placement) at the University of Minnesota Masonic Children's hospital (Minneapolis, MN) from 2010 to 2020 were included in the cohort if they had pre-procedural cross-sectional imaging (CT scan) of adequate resolution and quality to make 3D models and perform FE modeling (described below). Patients who only underwent cardiac MRI before the procedure were not included due to insufficient resolution of the images for 3D modeling. The technical aspects of balloon testing and transcatheter pulmonary valve replacement have been described previously.18 Pre-procedural CT scans were deidentified and used for model generation (described below) in a blinded fashion. Once models were generated, the model-predicted outcomes were compared to clinical outcomes noted in the cardiac catheterization laboratory.
2.1 3D computer model generation
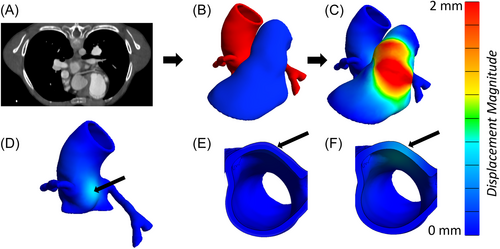
The RVOT, AR, and CAs were segmented using Seg3D19 from CT angiograms obtained before catheterization lab intervention. Using Meshmixer (Autodesk), the 3D vessels were smoothed and extruded to thicknesses of 1.5 mm for RVOT,20 1.8 mm for AR,21 and 0.7 mm for the CAs,22 assumed constant along the vessel length (Figure 2B). The volume surrounding the vessels, identified by Boolean subtracting the vessels from a larger block of material, was filled with homogeneous adipose tissue. To simplify the model characteristics, adipose tissue heterogeneity and tissue calcification were not considered in the current model.
All 3D model components were discretized by tetrahedral meshes. An appropriate mesh density was considered to be fine enough to capture the vessel shape but coarse enough to run efficiently. Blood vessels were described by finer meshes than adipose tissue, with average element volumes of 0.11 and 1.14 mm3, respectively. A mesh convergence study (Supporting Information Methods) confirmed that the selected mesh densities yielded accurate solutions.
2.2 Material models
The material models used (Supporting Information Methods) were based on mechanical studies of healthy, human tissue.23-26 To capture the non-linear mechanics of arteries and adipose tissue, non-linear material models were chosen for each anatomical component.27, 28 All arteries were modeled as incompressible, while the adipose tissue was allowed to compress. The AR, CAs, and adipose tissue were modeled as isotropic. The RVOT material model was treated as anisotropic to capture the direction-dependent material behavior at large deformations during simulated balloon angioplasty and stent expansion.
2.3 FE simulation of PPVI
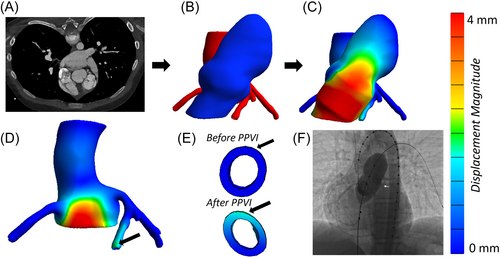
PPVI simulation was performed using the FE solver FEBio29 (Figure 2C). Balloon expansion of the RVOT was simulated by applying a luminal pressure of 1–1.5 atm (typical pressure range during balloon sizing). Using nodal positions of the inflated RVOT lumen, a custom MATLAB (MathWorks) code targeted a narrow, relatively straight 2 cm segment for stenting. The identified landing zone was later confirmed to agree with clinical positioning.
Stent expansion was simulated by prescribing uniform radial displacement of the RVOT luminal surface within the stented region. While this approach is considerably simplified, which may lead to reduced accuracy when dealing with asymmetric anatomies or expansion scenarios, it offers substantial advantages in terms of reducing model complexity and lowering computational expenses compared to previous methods.16, 17 The oversized stent provided up to a 30% increase to the RVOT lumen diameter, measured as twice the average radial position of nodes in the 2-cm-long stented region. Clinically, the degree of stent oversizing can vary greatly due to factors such as RVOT anatomy, available valve sizes, and valve positioning within the RVOT. Due to the retrospective nature of the study, we correlated the FE model oversizing with the balloon size used during testing in the cardiac catheterization laboratory for each patient (Table 1). In three of the cases examined herein, the full 30% oversize was not clinically relevant (see Appendix), so a smaller stent size was imposed. In none of the patients of this cohort was the oversizing >110% of the implanted conduit diameters. We emphasize that the goal of our simplified modeling framework is to detect possible interactions between the RVOT and neighboring structures and serve as a severe risk classifier. While this approach may be oversimplified and introduce some minor interpretational complexities, it underscores the need for case-by-case interpretation.
| Patient number | Age, sex | Main diagnosis | RVOT anatomy | Balloon waist measured during interrogation in the cath lab | Balloon size used in FE model |
|---|---|---|---|---|---|
| 1 (Figure 2) | 8, F | TOF | Native RVOT | 16 | 18 |
| 2 | 26, M | TOF | Conduit | 19 | 20 |
| 3 | 13, M | TGA | Conduit | 20 | 22 |
| 4a | 49, F | Truncus | Conduit | 22 | 22 |
| 5 | 10, F | DORV | Conduit | 20 | 19 |
| 6 | 15, F | TOF | Native RVOT | 24 | 24 |
| 7b | 14, M | TOF | Native RVOT | 27 | 30 |
| 8 (Figure 3) | 11, F | TOF | Native RVOT | 26 | 27 |
| 9 | 19, M | TOF | Native RVOT | 26 | 28 |
| 10 | 30, M | Aortic Stenosis, s/p Ross | Conduit | 20 | 21 |
| 11 | 14, F | TOF | Native RVOT | 23 | 24 |
| 12c (Figure 4) | 15, M | Pulmonary Stenosis, s/p BPV × 2 | Native RVOT | 26 | 27 |
- Abbreviations: BPV, balloon pulmonary valvuloplasty; CA, coronary artery; DORV, double outlet right ventricle; F, female; M, male; RVOT, right ventricular outflow tract; TGA, transposition of great arteries; TOF, tetralogy of fallot.
- a Patient 4 did not have a right CA.
- b Patient 7 had an RVOT (avg. diameter = 28.3 mm) that was too large to accommodate a stent oversized by 30%, so the largest clinically available stent size (5% increase) was simulated.
- c Oversizing was reduced to 20% to allow for model convergence.
During simulations, boundary conditions were imposed on all anatomical structures to simulate physiological conditions and provide model stability. The RVOT was fixed at its connections to the right ventricle and the pulmonary bifurcation. However, if the stented region was near the right ventricle, radial displacement was allowed to permit stent expansion. The AR was fixed at its proximal end (left ventricle) and at its distal end (aortic arch). The undersides of CAs were fixed on the surface of the heart to simulate the epicardial coronary arterial anatomy. Simulated vessel-adipose tissue interfaces were assumed to be perfectly adherent (no separation or sliding between tissues). After stent expansion, the RVOT interaction with surrounding structures due to stent oversizing was examined (Figure 2D–F).
2.4 Retrospective analysis of PPVI
Patient-specific models were created for 12 patients. Simulation results were retrospectively compared to observations made during balloon testing. The analysis of each case was blinded to the clinical outcome to prevent bias.
FE analysis can provide extensive information about the patients’ anatomies and tissue interactions such as vessel deformation, vessel wall stress, and vessel wall strain. However, the most clinically relevant outputs were the reductions in the lumen diameter of the AR and CAs due to their direct association with AVI and coronary artery blood flow. AR lumen reductions were only considered a risk for AVI when they occurred in the aortic sinus. While we also considered the maximum displacement of the AR and CAs as potential classifiers (Tables S1 and S2, Figure S1), they did not perform as effectively as lumen diameter reductions. Therefore, lumen diameter reductions were chosen as the best classifier for our method.
3 RESULTS
3.1 Patient cohort
Twelve patients who underwent balloon sizing before deployment of a balloon expandable valve in the cardiac catheterization laboratory at the University of Minnesota Masonic Children's hospital had appropriate pre-procedural CT images and were included in the study. The median patient age at cardiac catheterization was 14.5 years (range: 8–49 years). The underlying cardiac diagnosis and patient characteristics are in Table 1. Five patients had a surgical right ventricle to pulmonary artery conduit and seven patients had native/patched RVOT. Seven of the twelve patients underwent successful RVOT stent/valve placement (Table 2). Three patients were noted to have significant AR distortion and AVI on balloon testing, one patient had left CA compression, and one patient had both AR distortion (with AVI) and left CA compression. These five patients were not deemed candidates for transcatheter stent/valve placement, and the procedure was aborted. There was no procedural morbidity or mortality in this cohort.
| Model-predicted changes in lumen diameter | ||||
|---|---|---|---|---|
| Patient number | AR | Left CA | Right CA | Clinical outcome |
| 1 (Figure 2) | 1.5% | 2.0% | 1.9% | Safe Procedure |
| 2 | 3.8% | 3.1% | 0.6% | Safe Procedure |
| 3 | 0.2% | 0.0% | 10.1% | Safe Procedure |
| 4a | 6.0% | 2.3% | X | Safe Procedure |
| 5 | 1.3% | 2.3% | 0.2% | Safe Procedure |
| 6 | 5.0% | 2.6% | 5.9% | Safe Procedure |
| 7b | 16.0% | 5.7% | 4.1% | Safe Procedure |
| 8 (Figure 3) | 32.3% | 3.7% | 1.2% | AVI |
| 9 | 22.43% | 2.14% | 2.20% | AVI |
| 10 | 21.8% | 6.1% | 10.1% | AVI |
| 11 | 22.0% | 26.7% | 2.1% | AVI and Left CA compression |
| 12c (Figure 4) | 17.2% | 31.2% | 16.6% | Left CA compression |
- Note: Large (>20%) reductions have dark shading, moderate reductions have light shading (10%–20%), and small reductions (<10%) are unshaded.
- Abbreviations: AVI, aortic valve insufficiency; CA, coronary artery; F, female; M, male; RVOT, right ventricular outflow tract.
- a Patient 4 did not have a right CA.
- b Patient 7 had an RVOT (avg. diameter = 28.3 mm) that was too large to accommodate a stent oversized by 30%, so the largest clinically available stent size (5% increase) was simulated.
- c Oversizing was reduced to 20% to allow for model convergence.
3.2 Patient-specific analysis
- (1)
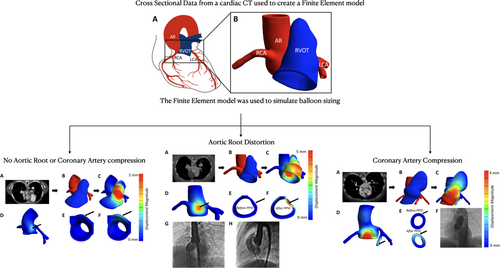
Figure 2 provides an example of a simulation in which stent expansion did not significantly reduce the lumen diameter of any vessels of interest (AR or CAs). The aortic sinus wall displaced slightly (Figure 2D–F), but the reduction in AR diameter was less than 2%. The CAs were not compressed by simulated stenting. The model prediction was retrospectively confirmed to agree with clinical observations; this patient safely received a stented valve after a negative pre-test in the catheterization lab.
- (2)
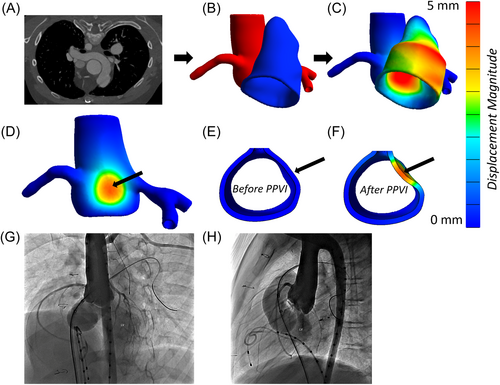
In contrast to Figure 2, Figure 3 shows simulation of a PPVI candidate who experienced AVI during balloon angioplasty in the catheterization lab. The model estimated a 30% reduction in lumen diameter due to RVOT expansion (Figure 3D–F). The CAs were undisturbed. During balloon sizing in the catheterization laboratory, AVI was observed in this patient. Due to the risk of AR distortion and AVI, this patient did not receive a stented valve.
- (3)
Finally, Figure 4 shows a case in which a CA was compressed during balloon angioplasty. The left CA was near the RVOT (Figure 4B), and simulated RVOT expansion pressed against the left CA (Figure 4C). The pressure from the RVOT caused significant displacement of the AR and left CA (Figure 4D), as well as a 31.2% loss in CA lumen diameter (Figure 4E,F). While the AR experienced significant displacement, the lumen diameter dropped by only 17.4%. This reduction was less than the four patients who experienced AVI clinically. In the catheterization lab, left CA compression had been observed during balloon angioplasty, and, therefore, this patient did not receive a stented valve.
3.3 Comparison between model and PPVI clinical outcomes
Table 2 summarizes clinical outcomes and model outputs, and Figure 5 plots the model-predicted reduction in left CA diameter versus the model-predicted reduction in aortic sinus diameter. The most striking result is that patients whose simulated stent expansion induced only low or moderate vessel compression (<20% diameter change in all vessels) had experienced no aortic insufficiency or coronary artery compression in the catheterization lab. For the right CA, all simulations were in the low-to moderate compression range, and no right CA compression was observed in any retrospective case Central Illustration 1.
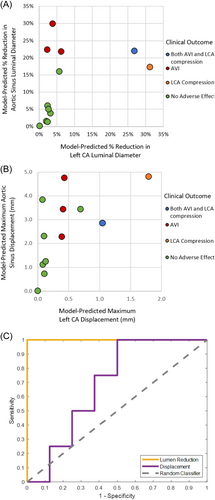
The four patients that experienced AVI clinically had models with large (>20%) AR lumen diameter reductions. These reductions exceeded all AR lumen reductions in simulations of cases where AVI was not observed clinically, and six of the eight patients that did not experience AVI had models with small (<10%) AR reductions. Two patients (#7 and #12) experienced moderate reductions (10%–20%) to AR diameter in the simulations, but no significant AVI was observed on balloon sizing in the cardiac catheterization laboratory (Table 2).
The two patients who experienced left CA compression clinically had high (>20%) model-predicted left CA lumen reductions, while patients without left CA compression during balloon sizing had simulated left CA compression in the low (<10%) range. For both high-compression simulations, oversizing the stent by 30% created conflicting boundary conditions between the stented vessel and the fixed underside of the left CA where it is embedded in heart tissue. This error was an indication of severe left CA compression, but to achieve model convergence, the stent oversizing condition was lowered to 20%, making the reported lumen diameter reductions underestimates of what one might expect in the clinic.
4 DISCUSSION
In our small retrospective cohort of 12 patients (for both native RVOT and RV-PA conduits), we were able to classify high versus low potential risks of AVI and/or CA compression during placement of balloon-expandable pulmonary valves using a simplified FE stent expansion model, with our classifications of high versus low risk agreeing with the clinical decision that had been made. Our simulations have run times of 2–6 min, which is much faster than previously reported16 and eliminates the need for supercomputing capabilities. The greater computational efficiency and retained clinical accuracy improve the outlook for pre-procedural FE-based PPVI risk assessment in our preliminary study.
We found lumen diameter change to be an excellent classifier for estimating patient risk in our small cohort (Figure 5). However, in four cases (# 3, 7, 10, and 12 in Table 2), 10%–20% lumen diameter reductions did not correlate with significant aortic insufficiency or coronary artery compression during balloon sizing in the cardiac catheterization laboratory. Lumen reductions of this magnitude may not have a substantial impact on aortic valve function or CA blood flow, or it could be that our FE model overestimates the extent of diameter loss. It is also possible that other metrics of lumen reduction, such as cross-sectional area or hydraulic radius, would be of comparable or even better predictive value; in the extreme limit of this argument, one could perform FEM simulations of flow in the compressed versus uncompressed vessel, including the mechanics of the aortic valve, but the computational cost of such simulations would be inconsistent with our goal of a simplified model.
Our model's clinical relevance is most pronounced at the two extremes of simulation outcomes: either when it predicts very small lumen reductions, indicating that PPVI may be a safe and effective treatment, or when it predicts substantial lumen reductions, signaling a higher risk associated with PPVI for the patient. In cases such as those between 15% and 25% aortic sinus lumen diameter reduction (see Figure 5 above), although the model classifications were consistent with the clinical decision in the cases studied, one would expect there to be a range of model-predicted diameter reductions for which uncertainty in the classification would arise over a larger patient pool. Catheterization laboratory testing would be required for patients in the borderline region.
Our scope was a single, specific question: Can anatomical information alone be used to predict the risk of compressing nearby vessels? With that narrow focus, we simplified the model and improved run times dramatically over previous studies. More detailed CA-compression risk assessment models developed by others,16, 17 which required hundreds to thousands of CPU hours in contrast to our few-minute simulations, have allowed for the analysis of stent-tissue interactions, stent deformation, stress distributions in the stents, asymmetric expansion due to calcifications and RVOT curvature, and comparison of specific stents (Melody vs. Sapien). Additionally, there are several studies that model patient-specific PPVI procedures to assess other risks (i.e., stent fracture),30 compare different devices (i.e., balloon-expandable vs. self-expandable),31 and estimate stresses in the stent and RVOT wall.32 Our procedure provides an accurate risk assessment of AVI or CA compression but is not intended to perform any of those other calculations. Despite the use of uniform, non-patient-specific mechanical properties, our simplified model enabled accurate predictions of the clinical outcomes even in patients with RVOT conduits and asymmetrical anatomies; again, if one wished to answer more specific questions, a more detailed model might be necessary.
While our models have significantly faster run times than previous studies, image segmentation and model generation are still relatively slow and tedious processes. Improving the efficiency of image segmentation is the aim of many advanced computational studies that utilize machine learning and artificial intelligence tools.33-36 Combining our FE workflow with automatic image segmentation would result in an improved clinical tool for assessing the risks of PPVI.
Despite its limitations, our preliminary study demonstrates the potential for a simplified FE modeling approach to assess possible risk of AVI and CA compression during PPVI provides impetus for further study, and lays the foundation for potential development of a new tool for pre-procedural risk assessment. A computationally efficient method, which would significantly reduce simulation time when compared to existing PPVI simulations, would be advantageous if it can be developed and validated across a larger patient population. The approach presented herein complements more detailed computational strategies and is part of the growing body of research aimed at improving the safety and effectiveness of PPVI, ultimately benefiting patients with congenital heart diseases.
ACKNOWLEDGMENTS
We thank Casey Hokanson for assistance with image segmentation and Dr. Ryan Mahutga for aid in model generation and troubleshooting. This work was supported by NIH (U01-HL139471, T32-HL139431), and by an Andrew David Sit Foundation Innovators Fund award through the University of Minnesota.
CONFLICT OF INTEREST STATEMENT
The authors declare no conflicts of interest.
APPENDIX: DETAILED DISCUSSION OF THREE SPECIAL CASES
-
Patient 7 had a much larger RVOT (28.5 mm diameter vs. 17.9 ± 2.9 mm for others), too large for a 30% stent oversize because no stented valve that large were available at the time of the cardiac catheterization. The simulation in this patient was performed to achieve a 5% oversize (~30 mm diameter), which agreed with the available balloon expandable valves intended for pulmonic position and procedural outcome.
-
For cases 11 and 12, the simulation failed for 30% stent expansion because it would require the RVOT to expand into the heart wall, completely crushing the left CA and violating the prescribed boundary conditions. In reality, the heart wall would deform, or the stent would not expand to the full 30%, but that question is not relevant to the clinical question—even when the stent expansion was reduced to 20%, the model still predicted pronounced compression of the left CA. For our predictive goals, this outcome is entirely sufficient.
In all three of these cases (7, 11, and 12), flexibility to adjust the model based on the specific procedure was necessary, as one might expect given the patient-specific geometry. In the future, aside from altering the stent size, our code could also adjust the stent's position upstream and downstream, offering the potential for virtual testing of various stent sizes and positions.
Open Research
DATA AVAILABILITY STATEMENT
Research data are not shared.


