The influence of hyperglycemia on the safety of ultrasound in retinal pigment epithelial cells
Abstract
Ultrasound (US) assisted drug delivery is receiving interest in treating posterior eye diseases, such as diabetic retinopathy due to its ability to maximize drug penetration into difficult to reach tissues. Despite its promise, the technique has only been investigated using healthy cell and tissue models, with no evidence to date about its safety in active disease. As a result, the aim of this study was to evaluate the safety of US administration in vitro in retinal pigment epithelial cells under normal and high glucose conditions. US protocols within the presently accepted safety threshold were applied and their influence on cell membrane and tight junction integrity as well as intracellular inflammation was evaluated using lactate dehydrogenase (LDH), zona occludens-1 (ZO-1), fluorescein isothiocyanate (FITC)-dextran dye leak and nuclear factor-kappaB (NF-κB) assays, respectively. Under high glucose conditions, US application increased LDH release and resulted in loss of ZO-1 labeling at 2 h; however, normal levels were restored within 24 h. US within its safety parameters did not induce any FITC-dextran dye leak or NF-κB nuclear translocation in normal or high glucose conditions. In conclusion, our results suggest that while high glucose conditions increase cell susceptibility to US-mediated stress, basal conditions can be restored within 24 h without long-lasting cell damage.
Abbreviations
-
- DR
-
- diabetic retinopathy
-
- LDH
-
- lactate dehydrogenase
-
- NF-κB
-
- nuclear factor-kappaB
-
- RPE
-
- retinal pigment epithelium
-
- US
-
- ultrasound
-
- VEGF
-
- vascular endothelial growth factor
-
- ZO-1
-
- zonula occludens-1
1 INTRODUCTION
Diabetic retinopathy (DR) is a chronic inflammatory condition that affects the retina and can lead to vision loss. DR, in its late stages, is associated with severe vascular pathology characterized by the presence of microaneurysms, hemorrhages, and neovascularisation (Nentwich & Ulbig, 2015). Currently, the gold-standard to treat DR includes anti-vascular endothelial growth factors (anti-VEGF) although their long-term use has been linked to the development of geographic atrophy (Gemenetzi et al., 2017, Martin et al., 2012), a decrease in choroidal thickness (Grunwald et al., 2014), and loss of retinal ganglion cells (Nishijima et al., 2007). Furthermore, anti-VEGF therapy requires repeated intravitreal injections, which are a painful and inconvenient method of treatment associated with risks of infections and accidental retinal detachment.
Despite the limitations associated with intravitreal anti-VEGF therapy, alternative treatment avenues are not forthcoming because of the notable difficulty in reaching the cells implicated in posterior eye diseases, such as DR (Thrimawithana et al., 2011). This is because DR affects cells in the retina, which are located on the inside at the back of the eye and are protected by many anatomical and physiological barriers. Treatment using an eyedrop would require the drug to first withstand being washed away by the tear fluid and next permeate through the collagenous corneal or scleral external layers of the eye before migrating across various intraocular tissues or choroidal blood vessels to finally reach the retina (Geroski & Edelhauser, 2000, Hughes et al., 2005). In the case of systemic administration, drug in the bloodstream would need to traverse the poorly permeable blood-retinal barrier, which features a collection of endothelial and epithelial cells along with pericytes and glial cells packed in close association (Cunha-Vaz, 2013). In both cases, only a fraction of the administered dose can reach the target site, with both high wastage and a prevalence for off-target effects observed. Recent studies have suggested that the current difficulties faced in treating posterior eye disease may be addressed using ultrasound (US; Huang et al., 2017, Thakur et al., 2017, Thakur et al., 2019). This technique has been widely explored given its routine use on the human body. When used in the realm of drug delivery, the technique has demonstrated an ability to improve molecular permeation through many tissues within the body (Pereira et al., 2017, Thakur et al., 2017, Wei et al., 2019, Zhang et al., 2018). In the context of posterior eye disease, US has demonstrated an ability to improve molecular permeation through the sclera (Lafond et al., 2017, Shah & Zderic, 2009, Suen et al., 2013), vitreous humor (Sonoda et al., 2012, Thakur et al., 2019), and blood-retinal barrier (Park et al., 2012) as well as into specific cells of the retina (Huang et al., 2017, Thakur et al., 2017).
US improves drug delivery into tissues via acoustic cavitation. Here, the applied stimulus induces the formation and growth of tiny gas cavitation nuclei within body fluids (Domenici et al., 2014). US causes the gas nuclei to oscillate, which results in stable and inertial cavitation. The periodic oscillation of stably cavitating gas bubbles may produce microstreams, which are shear forces exerted by the fluid circulation onto the plasma membranes of nearby cells (Lentacker et al., 2014). Conversely, the rapid growth and subsequent collapse of inertial cavitating bubbles produces an instantaneous release of a high volume of energy (Paliwal & Mitragotri, 2006). This occurs in the form of a microjet, which may perforate nearby cells. Both microstreaming and microjets exert mechanical stresses onto the membrane of cells which result in temporary minute wound-like pores in the plasma membrane. This phenomenon is known as sonoporation (De Cock et al., 2015, Paliwal & Mitragotri, 2006), which is thought to reversibly and transiently enhance drug molecule permeation, after which the wound-like pores are repaired through endogenous mechanisms. This is essential to maintain cell integrity and normal physiological function (Schlicher et al., 2006).
Several studies have suggested different ways in which US-mediated drug delivery can increase drug uptake into the retina when combined with clinically relevant administration strategies. It has been proposed that intravitreal, trans-scleral or suprachoroidal injection of a depot formulation (Agban et al., 2019, Huang et al., 2017, Kim et al., 2013) could be followed by trans-scleral US application to induce drug release as and when required. In one such instance, US application following intravitreal injection encouraged particle movement through the vitreous humor toward the retina thereby increasing the proximity of the dosage form with the target tissue (Thakur et al., 2019). Despite the potential benefits observed with the use of US for retinal drug delivery, its use in susceptible unhealthy tissue carries additional risks of causing mechanical, chemical and thermal stress to the tissue (Phenix et al., 2014). Additionally, previous studies have assessed US safety under normal conditions despite the fact that, in reality, US would likely be applied to enhance drug delivery in disease where the safety threshold may be different (Park et al., 2012, Peeters et al., 2008, Thakur et al., 2017, Xie et al., 2010). This is particularly important in chronic diseases where repeated treatments are often required over several years. It is therefore imperative to assess US safety in both healthy and diseased conditions to establish whether the nature of a disease may increase susceptibility to US-related injury. In light of this, we evaluated the safety of US administration in retinal pigment epithelial (RPE) cells under normal and hyperglycemic conditions. Hyperglycemia is a key pathology in DR and we previously observed in vitro and in vivo that hyperglycemia increases the cells' susceptibility to inflammatory cytokine-mediated injury (Kuo et al., 2020, Mugisho, Green, Squirrell, et al., 2018, Mugisho, Green, Kho, et al., 2018). Other studies have also reported that high glucose can induce oxidative stress during RPE migration which could make the cells more susceptible to other forms of injury (Farnoodian et al., 2016).
In the first instance, we identified a series of US protocols that cause differing levels of temperature elevations in RPE cells. Second, changes in cell membrane permeability were assessed using a lactate dehydrogenase (LDH) assay. To assess the integrity of an RPE monolayer following US application, zonula occludens-1 (ZO-1; tight junction marker) and fluorescein isothiocyanate (FITC)-dextran dye leak were measured under normal and high glucose conditions. Finally, we determined US induced inflammation in the cells by labeling for nuclear factor-kappa B (NF-κB) using immunohistochemistry.
2 MATERIALS AND METHODS
2.1 Materials
Human adult RPE cells (ARPE-19) were purchased from the American Type Culture Collection. Dulbecco's modified Eagle's medium nutrient mixture F-12 (DMEM-F12) and 100x antibiotic–antimycotic (AA) were purchased from Thermofisher Scientific Inc. Fetal bovine serum (FBS) as well as rabbit anti-ZO-1 and goat anti-rabbit Alexa488 antibodies were purchased from Invitrogen. LDH detection kit was purchased from Roche Diagnostics. Rabbit anti-NF-κB antibody was purchased from Abcam. Cell nuclei stain, 4′,6-diamidino-2-phenylindole (DAPI), was purchased from Sigma-Aldrich.
2.2 Cell culture
ARPE-19 cells were cultured in growth medium containing DMEM-F12 supplemented with 10% FBS, and 1X AA. Cells were grown in T75 flasks and incubated at 37°C in a humidified 5% CO2 incubator until confluent. Cells were used between passages 6 and 12. For experiments, cells were seeded at a density of 2.5 × 10⁵ cells/well in 24-well plates without (for LDH assays) or with coverslips (for immunohistochemistry).
2.3 Thermal study
Infrared thermography was used to evaluate culture medium temperature changes following US exposure. US of 1 MHz was applied to the bottom of the culture plates for 1 min using a SONOPLUS 190 US machine equipped with a 10 mm diameter probe (Enraf-Nonius). US intensity and duty cycle (DC) were varied from 0 to 1 W/cm2 and 0%–100%, respectively. A thermographic camera TVS-200EX (NEC Avio Infrared Technologies Co.) was used to take heat zone images and record the medium temperature before and after US application.
2.4 High glucose treatment
High glucose conditions were induced as previously described (Mugisho, Rupenthal, et al., 2018). Briefly, cells were first placed in media containing normal glucose for 48 h until confluence was achieved. Cell culture media were then changed to either normal (17.5 mM) or high glucose (37.5 mM) conditions for 24 h.
2.5 US administration
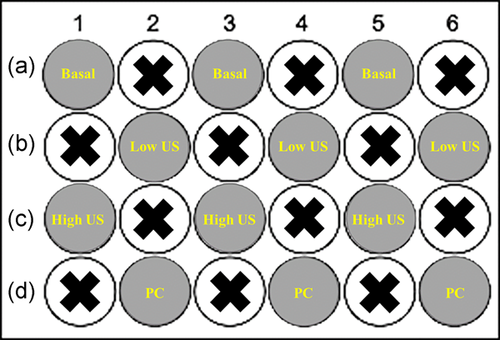
Administration of US was carried out in alternating wells of a 24-well plate to prevent overlap (Figure 1). Four US doses of varying intensity and DC were selected based on the findings of the thermal study. These were basal (no US), low US (0.2 W/cm2 and 50% DC), high US (0.5 W/cm2 and 50% DC), and positive control (PC; 1.0 W/cm2 and 100% DC). Each US treatment was applied for 1 min. The four US doses were tested in both normal and hyperglycemic conditions.
2.6 Assessment of LDH release
An LDH assay was used as previously described (Mugisho, Rupenthal, et al., 2018) to assess the degree of mechanical stress that US may place on cells. LDH may be released by cells via pores induced by sonoporation or other openings due to cellular injury. Briefly, following US administration, samples were re-incubated and 50 µl aliquots of the medium were withdrawn 30 min and 2 h after, respectively. The amount of LDH released into the cell culture medium was measured using an LDH assay kit according to manufacturer instructions. Absorbance was measured at 490 nm using a SpectraMax i3x spectrophotometer (Molecular Devices).
2.7 Metabolic activity using an 3-(4,5-dimethylthiazol-2-yl)-2,5-diphenyltetrazolium bromide assay
Metabolic activity was measured using an 3-(4,5-dimethylthiazol-2-yl)-2,5-diphenyltetrazolium bromide (MTT) assay. ARPE-19 cells were seeded onto 24-well plates at a density of 2 × 10⁵ cells/ml. Cells were incubated with high or normal glucose for 24 h before US application. After 2 h, spent media was removed and 200 μl of MTT solution (5 mg/ml) was added to each well and incubated at 37°C for 4 h. The MTT solution was then removed and replaced with 100 μl of 0.04 M HCl in absolute isopropanol. The absorbance was measured using a SpectraMax i3x spectrophotometer (Molecular Devices) at a wavelength of 570 nm with background subtraction at 650 nm.
2.8 Measurement of FITC-dextran paracellular permeability
Cells were seeded at 2.5x10⁵ cells/ml on polyester membranes in Transwell® 24-well plates (Corning Incorporated) in growth medium and incubated for 24 h in normal or high glucose media. Inserts were removed and placed gently into a six-well plate without media to optimize contact between the US probe and the cell layer. US treatment was then conducted on the inserts in the six-well plate as previously described. Once the inserts were returned to their respective treatment media, cellular barrier integrity was measured by assessing the movement of 70 kDa FITC-dextran (D1820; Thermo Fisher Scientific Inc.) across a monolayer of cells as previously described. Briefly, 100 µl of FITC-dextran (10 µg/ml) was added to the inserts and incubated for 15 min. Inserts were then removed and samples transferred to 96-well plates for quantification by spectrophotometry (excitation 490 nm and emission 520 nm). FITC-dextran permeability was expressed as a percentage relative to basal conditions. The sample size was three readings per well for each treatment then the entire experiment was repeated three times.
2.9 Immunohistochemistry
Cells were seeded in 24-well plates containing coverslips for immunohistochemistry. Following treatments, cells were fixed with 4% paraformaldehyde for 10 min and permeabilised with 0.1% Triton X-100 in phosphate-buffered saline (PBS) for 10 min. Cells were then incubated with either rabbit anti-ZO-1 (1:500) or rabbit anti-NF-κB (1:500) at 4°C overnight followed by washing in PBS three times for 15 min. Goat anti-rabbit Alexa-488 (1:500) secondary antibody was applied and incubated at room temperature for 3 h. Secondary-only controls revealed no nonspecific labeling. Cell nuclei were stained with DAPI (1:1000) and slides were mounted using Citifluor™ anti-fade reagent. ZO-1 expression was assessed at 2 and 24 h while NF-κB was only assessed at 24 h. Labeling was repeated three times in separate experiments.
2.10 Statistical analysis
Data are presented as arithmetic mean + SEM. Statistical comparisons between groups were performed using one-way or two-way analysis of variance with Dunnett's multiple corrections test using GraphPad Prism 6. The specific statistical method used for each data set is provided in the respective figure legend. Adjusted p < .05 was considered to indicate statistically significant differences.
3 RESULTS
3.1 An increase in US intensity correlates with an increase in medium temperature
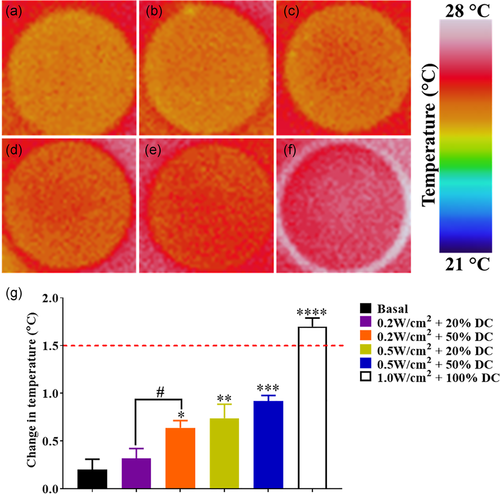
To determine the effect of US on the medium temperature, we looked at the effect of both US power (W/cm2) and DC (%). DC corresponds to the percentage of the time during which ultrasound is on during it application; therefore, a DC of 50% means that over a 100 ms application time, the US is on for 50 ms and off for 50 ms. As can be seen in Figure 2, an increase in US intensity resulted in an increase in medium temperature. At the lowest US dose used (0.2 W/cm2 + 20% DC), there was no statistically significant change in temperature relative to basal conditions. However, increasing the US intensity to 0.5 W/cm2 or the DC to 50% led to a significant increase in temperature (p < .05). In spite of this, all test US conditions only increased the medium temperature by 0.5°C to 1.0°C. Conversely, the US dosage used for the PC (1.0 W/cm2 + 100% DC) caused an increase in temperature which exceeded the recommended safety maximum of higher than 1.5°C. Based on these thermal research outputs, the PC US dose was maintained to represent the effect of a detrimental US dose while the low and high US dosages of 0.2 W/cm2 + 50% DC and 0.5 W/cm2 + 50% DC, respectively, were chosen to be below this threshold.
3.2 High glucose conditions intensify US-mediated LDH release
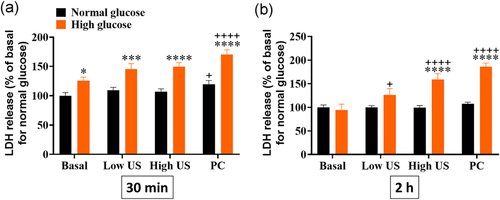
All subsequent evaluations were performed in both normal and high glucose conditions. In normal conditions, US application did not significantly change LDH release from ARPE-19 cells (Figure 3a). An increase in LDH was observed 30 min following administration of the PC (p< .05), however this returned to baseline levels by 2 h. In the high glucose group, no changes in LDH release were seen 30 min following application of either the low or high treatment protocols. However, 2 h after administration, there was a dose-dependent increase in LDH release with the high US treatment group being significantly greater than baseline (Figure 3b, p< .01). PC settings resulted in significantly greater LDH release than baseline at both timepoints under high glucose conditions.
3.3 US does not affect metabolic activity in normal or high glucose conditions
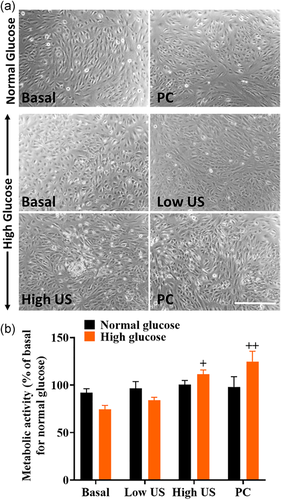
To determine whether changes in LDH release were due to cell death or transient transcellular permeability, cell images were analyzed, and metabolic activity was measured using the MTT assay (Figure 4). Cell images showed no changes in cell morphology across all treatment groups. While there were no significant changes in metabolic activity in normal glucose conditions, results showed that high glucose levels led to significantly increased metabolic activity following high US and PC treatments.
3.4 High glucose conditions worsen US-mediated loss of ZO-1 localization at the cell membrane at 2 h
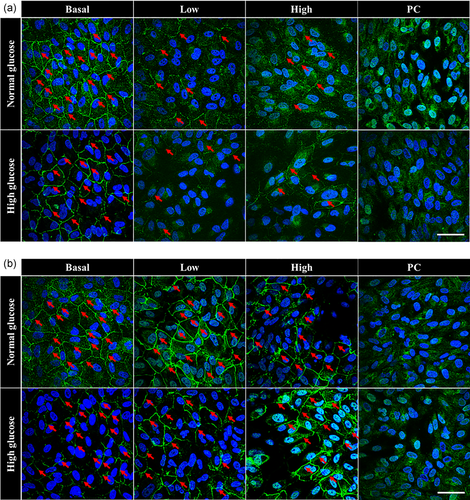
Given that the most significant changes in LDH release were observed at 2 h, the effect of high glucose and US treatment on tight junction protein expression and localization was also studied at this timepoint. In both normal and high glucose conditions, ZO-1 was localized to the cell membrane (red arrows; Figure 5a) without US application. On the contrary, there was a complete loss of ZO-1 at the tight junctions in PC groups under both glucose conditions. In the normal glucose group, some ZO-1 was still localized at the cell membrane with the low and high US dose, however this localization was greatly reduced compared with basal levels. In the high glucose group, there appeared to be an increasing loss of ZO-1 localization at the cell membrane with increasing US dose. Overall, the loss of ZO-1 localization at the cell membrane observed in the high glucose group was more pronounced compared with the normal glucose group.
3.5 ZO-1 protein is restored to the cell membrane in both normal and high glucose conditions by 24 h
To determine the longevity of US-mediated changes to tight junctions, ZO-1 expression was evaluated again at 24 h. Results showed that by 24 h, there was a recovery of cell membrane-localized ZO-1 protein expression in both normal and high glucose groups and for both low and high US doses (Figure 5b). However, the PC groups for both glucose conditions did not show recovery of ZO-1 localization.
3.6 US treatment induces prolonged changes in paracellular dye permeability only in the PC group in high glucose conditions
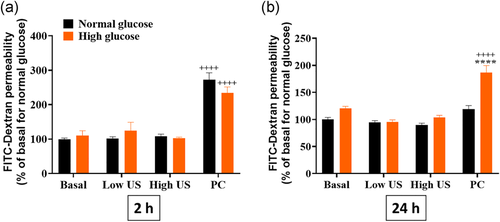
To determine whether the changes to ZO-1 expression translated into loss of barrier integrity, the permeability of a monolayer of ARPE-19 cells was assessed using FITC-dextran (Figure 6). At 2 h, results showed that only the PC groups induced FITC-dextran dye leak across the monolayer in both normal and high glucose conditions. By 24 h, FITC-dextran dye leak persisted in the PC treated group for the high glucose condition only while barrier integrity was recovered in all other cases.
3.7 US treatment does not induce nuclear translocation of NF-κB under high glucose conditions
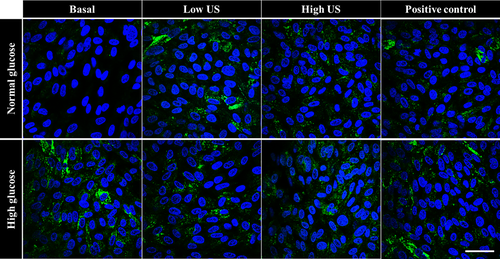
To evaluate the effect of glucose levels and US treatment on cellular inflammation, translocation of NF-κB from the cell membrane into the nucleus was examined (Figure 7). Results showed that there was no NF-κB translocation into the cell nucleus at both 2 h (results not shown) and 24 h (Figure 7) in all groups studied.
4 DISCUSSION
The primary objective of this study was to evaluate whether US was equally safe when administered to cells in normal and high glucose conditions. Earlier studies on the use of clinical US have identified 1.5°C as the maximum temperature increase allowable for the technique to be considered as “safe” for application to the eye (Nabili et al., 2015). As a result, we first set out to identify how different ultrasonic parameters influence post-administration temperature. Due to the fact that higher baseline temperatures result in lower heatmap image resolution, experiments were conducted at room temperature. As a result, media without cells were used because normalizing cells to room temperature was likely to induce cell stress itself negatively impacting the results. The highest US parameter was set to 1.0 W/cm2 and 100% DC (PC) based on observations made using our apparatus in previous studies on ocular tissues (Huang et al., 2017). A range of US parameters were chosen lower than the PC by varying both the intensity and DC. Unsurprisingly, it was revealed that increasing both the intensity and DC increased the medium temperature, with PC increasing the temperature above the recommended safety threshold of 1.5°C. Interestingly, 20% DC resulted in higher temperature variability compared to 50% DC suggesting that the output from lower DC was less predictable. As a result, we elected to progress with two safe protocols with increasing intensity while keeping the DC constant at 50%.
While the thermal stress caused by US may be a useful measure to indicate its ocular safety, it does not allude to molecular changes that might occur due to mechanical and chemical stresses created by this technique. As a result, to understand the various mechanisms by which US may cause cellular stress, we assessed the cellular responses to the stimuli through a variety of assays. The LDH assay was used to evaluate the leakiness of the cellular membrane. It is well established that US increases cell permeability, but it is also important to ensure that this occurs in a transient manner (Schlicher et al., 2006, Thakur et al., 2017). At 30 min, only the PC settings induced significant LDH release in the normal glucose state and this was restored to basal levels by 2 h indicating that US-mediated cellular leakage was transient with no long-term impact on cellular wellbeing. Interestingly, in high glucose conditions, a significant and prolonged increase in permeability was observed in both the high US (0.5 W/cm2 and 50% DC) and PC groups, providing the first evidence that the cellular response to the US stimulus may differ based on the glycemic state. These results were not entirely surprising given that previous studies have reported that hyperglycemia increases cellular susceptibility to stress and inflammation (Calado et al., 2016, Mugisho, Green, Squirrell, et al., 2018). Nonetheless, given that the purpose of US application is therapeutic in nature, it is important to ensure that its negative effects in high glucose conditions is only temporary to support its role in enhancing cellular drug uptake without causing long-term damage. As a result, the next experiment evaluated cell morphology and metabolic activity at 2 h, the timepoint at which US appeared to mediate the most significant changes in LDH release. Interestingly, the results suggested that despite having a pronounced effect on LDH release, US treatment did not change the cell morphology or reduce the metabolic activity in both normal and high glucose conditions. Taken together, these findings suggest that the utilized US parameters increased transcellular permeability without inducing cell death in both normal and high glucose conditions.
Having assessed transcellular permeability, the study evaluated paracellular permeability first by assessing the effect of US on the tight junction protein ZO-1 in ARPE-19 cells. This is of significance because RPE cells form the outer blood-retinal barrier that separates the choroid from the photoreceptors in the retina, a role that is crucial in the maintenance of retinal homeostasis (Xu et al., 2011). Furthermore, for US-mediated drug delivery across this barrier, transient weakening of tight junctions may be advantageous to enable drug passage to the retina. Previous use of US to increase blood-brain barrier permeability showed that the stimulus disassembled the molecular structure of tight junctions at the cell junction and caused an overall decrease in the expression of tight junction proteins, such as occludin, claudin-5, and ZO-1 (Sheikov et al., 2008). However, the study reported that the changes in tight junction proteins were restored back to basal levels after 4 h.
At 2 h, ZO-1 localization at the cell membrane was significantly reduced in all applied protocols indicating an increase in outer blood-retinal barrier permeability. While delocalization was greater in the hyperglycemic group after 2 h, normal ZO-1 localization was restored by 24 h in both glycemic conditions for the low and high US groups, showing that the tight junctions were able to recover in both instances. In addition to ZO-1 localization, FITC-dextran dye leak was evaluated as a direct measure of paracellular permeability. Interestingly, only the PC induced FITC-dextran dye leak at 2 h in both normal and high glucose conditions. By 24 h, FITC-dextran dye leak persisted following PC treatment in the high glucose group only. A failure of ZO-1 recovery as well as significantly increased FITC-dextran dye leak in the PC group demonstrated the importance of ensuring this technique is used below its temperature safety threshold. A prolonged loss of ZO-1 localization at the cell membrane as well as loss of cell permeability is associated with loss of RPE functionality, a pathology associated with chronic retinal diseases, such as age-related macular degeneration (McLeod et al., 2009) and late-stage DR (Simo et al., 2010).
Finally, while it has been established that on a structural level, US-mediated cellular and paracellular permeability is transient, it is also important to ensure that no long-lasting inflammatory stress has been induced following stimulus administration. Consequently, we evaluated NF-κB expression and potential nuclear translocation. During inflammatory stress, NF-κB translocates from the cell cytoplasm into the nucleus where it acts as a transcription factor to induce expression of several pro-inflammatory cytokines (Barnes & Karin, 1997). Our results showed an absence of nuclear translocation of NF-κB in all treatment groups at both 2 and 24 h, indicating that stimulus administration did not trigger any inflammatory response in the cells. More importantly, our study found that US did not induce NF-κB translocation in hyperglycemic cells, known to be more prone to inflammatory stress. Our findings contradict studies that suggests that US application induces NF-κB nuclear translocation (Hou et al., 2009; Tang et al., 2009). Tang et al. (2009) showed that US induced apoptosis of tumor cells therefore induction of NF-κB was a possibility. On the hand, Hou et al. (2009) used US at a relatively low intensity of 30 mW/cm2 but applied it for 20 min, which is 20 times longer than in our study, resulting in induction of inflammation. The differences between our findings and others reflect the adaptability of US with regard to its use and further highlights the need for careful consideration of its intended purpose when determining its optimum dosage.
Although a temperature increase threshold of 1.5°C has remained the commonly utilized guidance for ocular ultrasound safety, our studies demonstrate that cell stress markers can be increased at temperatures lower than this value. Importantly, LDH release and ZO-1 localization were affected, especially in the hyperglycemic state, even below this temperature threshold. While the exact reasons for the heightened susceptibility of cells in high glucose conditions are currently unknown, these findings highlight a need for caution in the use of US for drug delivery in tissues with underlying retinal pathology. In terms of DR, it may be important to either ensure well-controlled glycemic levels or reduce the applied dose when US therapy is considered within a clinical setting to improve DR therapeutic outcomes. It may also be prudent to look beyond temperature increase alone to better characterize ultrasound safety.
ACKNOWLEDGMENTS
Odunayo O. Mugisho was supported by an Auckland Medical Research Foundation Grant (1117015). Ilva D. Rupenthal's directorship is supported by the Buchanan Charitable Foundation.
Open Research
DATA AVAILABILITY STATEMENT
The data that support the findings of this study are available from the corresponding author upon reasonable request.


