The mammalian target of rapamycin signaling pathway regulates myocyte enhancer factor-2C phosphorylation levels through integrin-linked kinase in goat skeletal muscle satellite cells
Abstract
Mammalian target of rapamycin (mTOR) signaling pathway plays a key role in muscle development and is involved in multiple intracellular signaling pathways. Myocyte enhancer factor-2 (MEF2) regulates muscle cell proliferation and differentiation. However, how the mTOR signaling pathway regulates MEF2 activity remains unclear. We isolated goat skeletal muscle satellite cells (gSSCs) as model cells to explore mTOR signaling pathway regulation of MEF2C. We inhibited mTOR activity in gSSCs with PP242 and found that MEF2C phosphorylation was decreased and that muscle creatine kinase (MCK) expression was suppressed. Subsequently, we detected integrin-linked kinase (ILK) using MEF2C coimmunoprecipitation; ILK and MEF2C were colocalized in the gSSCs. We found that inhibiting mTOR activity increased ILK phosphorylation levels and that inhibiting ILK activity with Cpd 22 and knocking down ILK with small interfering RNA increased MEF2C phosphorylation and MCK expression. In the presence of Cpd 22, mTOR activity inhibition did not affect MEF2C phosphorylation. Moreover, ILK dephosphorylated MEF2C in vitro. These results suggest that the mTOR signaling pathway regulates MEF2C positively and regulates ILK negatively and that ILK regulates MEF2C negatively. It appears that the mTOR signaling pathway regulates MEF2C through ILK, further regulating the expression of muscle-related genes in gSSCs.
Abbreviations
-
- ATP
-
- adenosine triphosphate
-
- bHLH
-
- basic helix-loop-helix
-
- DMEM
-
- Dulbecco's modified Eagle's medium
-
- gSSCs
-
- goat skeletal muscle satellite cells
-
- SCs
-
- satellite cells
-
- ILK
-
- integrin linked kinase
-
- IRS 1
-
- insulin receptor substrate-1
-
- MEF2
-
- myocyte enhancer factor 2
-
- MRF
-
- myogenic regulatory factor
-
- mTOR
-
- mammalian target of rapamycin
-
- mTORC
-
- mTOR complex
-
- MS
-
- mass spectrometry
-
- P
-
- phosphorylated
-
- PI
-
- propidium iodide
-
- PI3K
-
- phosphoinositol 3-kinase
-
- PINCH
-
- particularly interesting new cysteine-histidine–rich protein
-
- S6K
-
- S6 kinase
-
- S
-
- serine
-
- T
-
- threonine
Introduction
mTOR plays an important role in mediating skeletal muscle hypertrophy, which regulates protein synthesis in cells, and also participates in intercellular signal transduction in skeletal muscle cells (Foster and Fingar, 2010). There is increased synthesis of skeletal muscle-associated proteins during recovery following resistance exercise, and the major phosphoinositol-3-kinase (PI3K)/AKT/mTOR pathway is involved in this process. Muscle hypertrophy is blocked following the use of mTOR-specific inhibitors (Bodine et al., 2001; Park et al., 2005), demonstrating that mTOR and the downstream target proteins S6K and 4E-BP 1 are likely the key regulatory factors in muscle hypertrophy (Park et al., 2002).
Skeletal muscle is formed by differentiated myoblasts originating from the mesoderm; myogenic regulatory factor (MRF) genes play an important role in skeletal muscle genesis and development (Perry and Rudnick, 2000). MRFs have a basic helix-loop-helix (bHLH) structure, while the MADS box region of myocyte enhancer factor-2 (MEF2) interacts with the bHLH structure to activate the expression of skeletal muscle-specific genes to regulate skeletal muscle development. In skeletal muscle generation, MEF2 is expressed following MRF expression (Molkentin et al., 1996). Therefore, it is believed that MRFs trigger MEF2 expression, which magnifies and maintains MRF expression levels.
A member of the MADS box transcription factor regulator family, MEF2 is a protein found in developing skeletal muscle myotubes and of which there are four members: MEF2A, MEF2B, MEF2C, and MEF2D (Potthoff et al., 2007; Angelelli et al., 2008; Al Madhoun et al., 2011). The DNA-binding site of MEF2 is a segment of the conservative DNA sequence CTA(A/T)4TAG, which exists widely in the regulatory region of muscle tissue-specific expression genes, such as that for muscle creatine kinase (MCK) (Black and Olson, 1998). However, the C-terminal of MEF2, containing phosphorylation sites, is the target of multiple kinases and is the main region of MEF2 responsible for activity regulation and function. Phosphorylation of serine residue 59 (S59) in MEF2C, located between the MADS and MEF2 structural domains, enhances the DNA-binding activity of MEF2C, and the residue is conserved in MEF2 family members (Molkentin et al., 1996). Therefore, MEF2C plays a vital role in skeletal muscle development.
Thus, mTOR signaling and MEF2C are necessary for skeletal muscle growth. However, whether mTOR regulates the expression of skeletal muscle-related genes by regulating MEF2C phosphorylation activity in addition to facilitating muscle cell protein synthesis has not been reported. Here, we studied the transcription regulatory factor MEF2C, investigating its interaction with the mTOR signaling pathway, and illustrated how the mTOR signaling pathway regulates skeletal muscle growth through MEF2C.
Materials and methods
gSSCs culture
The method of separating gSSCs was described by Wu et al. (2012). gSSCs were cultured in Dulbecco's modified Eagle's medium (DMEM)/F12 supplemented with 15% horse serum at 37°C and 5% CO2 under saturated humidity. The muscle induction medium was DMEM/F12 supplemented with 2% horse serum.
Immunostaining
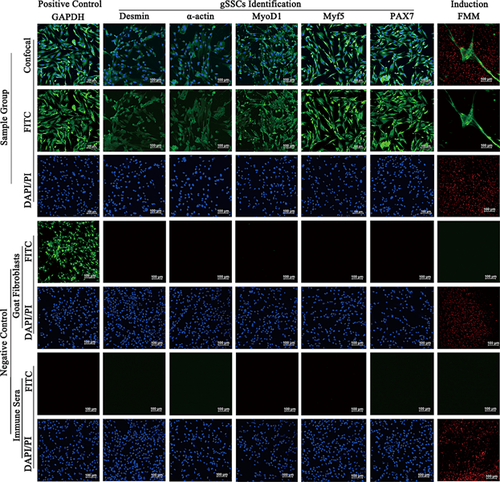
gSSCs (1 × 10⁵/mL) were seeded in 24-well plates and cultured until >80% confluent. Referencing the immunostaining method described by Wu et al. (2012), the following primary antibodies (1:200) were added to bind with their respective target proteins: mouse polyclonal antibodies to GAPDH, MyoD1, and α-actin, rabbit polyclonal antibodies to desmin and Myf5, mouse monoclonal antibody to Pax7, rabbit polyclonal antibody to fast muscle myosin (FMM), anti-ILK (goat) and anti-MEF2C (rabbit) (Abcam, Cambridge, MA). Then, samples were incubated with goat, rabbit, or donkey Rhodamine and FITC–labeled and secondary antibody, and the nuclei were stained with DAPI or PI. The positive control was GAPDH. Negative controls were goat fibroblasts and immune sera (IS) in place of gSSCs and primary antibodies, respectively. The experiments were performed in triplicate.
Immunoblotting
When gSSCs grew to 80% confluence in 100-mm culture dishes, 0, 1, 10, 100, 1000 nM PP242 (a specific and potent small-molecule inhibitor of mTORC1, IC50 = 8 nM), 0, 10, 100, 1000, 10000 nM Cpd 22 (a specific small-molecule inhibitor of ILK, IC50 = 600 nM), or 100 nM PP242 plus 1000 nM Cpd 22 were supplemented into the medium and incubated for 3 h. The cells were lysed, and then immunoblotting was carried out as previously described (Troussard et al., 2003) to detect S6K, (p)-S6K (T389), MEF2C, p-MEF2C (S59), ILK, p-ILK (T173), and α-Tubulin.
Coimmunoprecipitation
Coimmunoprecipitation was performed according to the instructions of a Millipore Catch and Release kit. Briefly, samples containing 1–3 mg total protein were precleared with Protein A/G Sepharose for 30 min. The cleared lysates were incubated with 4 μg anti-ILK or anti-MEF2C antibody for 2 h to overnight at 4°C. Normal IgG and BSA were used as controls in place of the ILK and MEF2C antibodies, respectively.
Protein mass spectrometry analysis
The co-IP product of MEF2C was used for SDS-PAGE. Normal IgG was used as the control. Following Coomassie brilliant blue staining, SDS-PAGE bands were compared before and after 100 nM PP242 treatment, and bands that exhibited changes following mass spectrometry (MS, performed by BGI, Beijing, China) were excised.
ILK activity analysis
ILK activity was measured as previously described (Tan et al., 2004). Briefly, the medium was supplemented with 100 nM PP242 or 1000 nM Cpd 22 for 3 h, and then gSSCs total proeins were harvested. Equivalent amounts (250 µg) of supernatant were immunoprecipitated overnight with 4 µg mouse monoclonal anti-ILK antibody and rabbit polyclonal anti-MEF2C (S59) antibody at 4°C. Immune complexes were isolated with protein A/G agarose beads and washed twice with cell lysis buffer and kinase buffer (Cell Signaling Technology). Pellets were resuspended in kinase buffer added 200 µM ATP and incubated for 60 min at 30°C.
ILK RNA interference
Three ILK short hairpin RNA (shRNA) sequences were designed as follows, with nucleotide start positions based on the NCBI entry for ILK (accession XM_005689759.1): ILK-198, 5′-GGGCACGAATCAATGTGATGA-3′; ILK-398, 5′-GCCCTTGTCAGCATCTGTAAC-3′; and ILK-717, 5′-GGAAGAGCAGGGACTTCAATG-3′. In parallel, shRNA negative control (NC-shRNA) is 5′-TTCTCCGAACGTGTCACGTTT-3′. The sequences were subcloned into PGPU6/GFP/Neo vectors (GenePharma, China) and transiently transfected into gSSC cultures. After 48-h transfection, ILK and MCK mRNA expression detected with qPCR. The ILK-198 shRNA (ILK-shRNA) reduced the level of ILK mRNA to the greatest extent, and we selected it for further study.
qPCR
qPCR was performed with SYBR® Green Master Mix using a qTOWER 2.2 sequence detector (Analytik-jena.AG, Germany). The following primers were used for ILK (GenBank Acc: XM_005689759.1): forward (F): 5′-GTCATGGGCACCGTGATAT-3′; reverse (R): 5′-ATTCGCCACAAGGTCCTCT-3′; MCK (GenBank Acc: XM_004015317.1): F: 5′-GGAATACCCAGACCTCAGCAA -3′; R: 5′-GACTCCTCATCACCAGCCACA-3′; and GAPDH (GenBank Acc: XM_005680968.1): F: 5′-TGAACCACGAGAAGTATAACAACA -3′; R: 5′-GGTCATAAGTCCCTCCACGAT-3′. Data from triplicate experiments were expressed relative to GAPDH, which was used to normalize for any differences in reverse transcriptase efficiency. Fold change in gene expression relative to the control was determined by the standard comparative cycle threshold (2-ΔΔCt) method.
Statistical analysis
Data are presented as means ± SD. The significance of differences between experimental or treated groups and control groups was determined by analysis of variance; P < 0.05 by the Student t-test was considered statistically significant.
Results
Identification and differentiation of gSSCs
Adherent gSSCs were visible as fibrous cells, and desmin, α-actin, MyoD1, Myf5, and Pax7 were positive expression (Figure 1, green fluorescence, gSSC Identification of Sample Groups). After induction, gSSCs merged into polynuclear myotubes, and FMM was expressed (Figure 1, green fluorescence, Induction of Sample Groups). The multiple nuclei stained red by PI (Figure 1, red spots in green fluorescence, induction). The positive control GAPDH was expressed in gSSCs and goat fibroblasts (Figure 1, green fluorescence, sample group positive control and goat fibroblasts). The negative control goat fibroblasts did not express desmin, α-actin, MyoD1, Myf5, Pax7or FMM in the same culture conditions and treatment. There was no staining in gSSCs in which the primary antibodies had been replaced with IS (Figure 1, negative control). The results suggest that we successfully obtained gSSCs.

mTOR signaling pathway regulated S6K and MEF2C positively
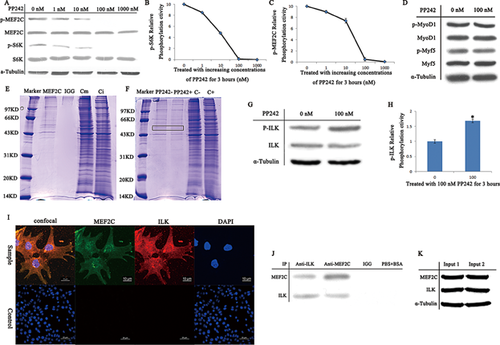
When gSSCs were treated with increasing concentrations of PP242 for 3 h, S6K (T389) and MEF2C (S59) phosphorylation levels decreased as PP242 concentration increased; there was no change to the amounts of S6K and MEF2C in cells (Figure 2A). S6K and MEF2C activity was greatly suppressed following 3-h treatment with 100 nM PP242, which was selected for further study. Based on the two curves, 100 nM PP242 was the optimum concentration for phosphorylating S6K (T389) and MEF2C (S59) (Figures 2B and 2C). MyoD1 and Myf5 expression and phosphorylation levels were not affected following treatment with 100 nM PP242 (Figure 2D). These novel findings suggest that the mTOR signaling pathway regulates MEF2C (S59) phosphorylation positively but not that of MyoD1 and Myf5.

Proteins interacting with MEF2C in the mTOR pathway
We used gSSC lysates obtained before and after PP242 treatment for co-IP detection of MEF2C. In the 50-kD band, more proteins had bound with MEF2C before treatment and that PP242 treatment had reduced it. The MEF2C co-IP product contained more protein than the control (normal IgG replacing anti-MEF2C) (Figures 2E and 2F, bands in black box). Controls (Cm, Ci, C−, C+) were from the total protein of different samples. Compared with the UniProt sheep protein amino acid sequence database, the results are listed in Table 1. We selected protein #8, that is, ILK, as a candidate regulator of MEF2C and an mTOR pathway component.
| NO. | UniProt accession number | Score | Protein name |
|---|---|---|---|
| 1.1 | D0VWZ0 | 5628 | Tubulin-alpha chain |
| 1.2 | C5ISA2 | 4215 | Tubulin-alpha 4a |
| 1.3 | Q307H5 | 190 | Tubulin-alpha (Fragment) |
| 2.1 | D0VWY9 | 4934 | Tubulin beta chain |
| 2.2 | C7F7S5 | 2431 | Beta-tubulin (Fragment) |
| 3 | A4ZYA6 | 509 | Vimentin (Fragment) |
| 4 | D7RIF5 | 228 | Beta-actin variant 2 |
| 5 | C8C9Q2 | 173 | Keratin 5 (Fragment) |
| 6 | O77727 | 103 | Keratin, type I cytoskeletal 15 |
| 7 | Q30B70 | 100 | Elongation factor-1 alpha (Fragment) |
| 8 | H9CH14 | 67 | Integrin-linked kinase |
| 9 | Q8MIP8 | 56 | Glutamate dehydrogenase (Fragment) |
| 10 | B0LKN9 | 52 | Keratin 27 |
| 11 | C5IWV2 | 52 | Aspartyl-tRNA synthetase |
| 12 | P00922 | 51 | Carbonic anhydrase 2 |
| 13 | Q3S331 | 39 | Pyruvate kinase (Fragment) |
| 14 | P14639 | 33 | Serum albumin |
| 15 | G3ER53 | 27 | Keratin type II cytoskeletal 71 (Fragment) |
| 16 | Q30B72 | 27 | Elongation factor-1 alpha (Fragment) |
| 17 | B0LRN1 | 21 | Glutamate dehydrogenase 1 (Fragment) |
| 18 | Q9GLG6 | 16 | Ca2+/calmodulin-dependent protein kinase II (Fragment) |
| 19 | Q9XT50 | 15 | Copper-transporting ATPase 2 |
MEF2 co-IP proteins were included cytoskeleton protein, kinases, and protein factors in the band. As signal transduction and MEF2C phosphorylation were involved, kinases were the key to this study. ILK (Hannigan et al., 2007; McDonald et al., 2008) and Ca2+/calmodulin-dependent protein kinase II (CaMK II) (Bennecib et al., 2001; Bassel-Duby and Olson, 2006) are both part of the mTOR signaling pathway and induce muscle hypertrophy (Table 2). However, CaMK II mediates MEF2-dependent gene transcription (Ginnan et al., 2012) and does not affect MEF2C (S59) phosphorylation. Therefore, ILK, an S/T protein kinase involved in negative feedback regulation of the mTOR signaling pathway and one of the proteins in the mTOR signaling network, was appropriate (McDonald et al., 2008). We infer that ILK is likely the intermediate link in mTOR signaling pathway regulation of MEF2C.
| NO. | Protein name | Relative functions |
|---|---|---|
| 8 | Integrin-linked kinase | Cell survival (mTOR) and regulate muscle hypertrophy (muscle development). |
| 18 | Ca2+/calmodulin-dependent protein kinase II | Dephosphorylated by PP2A (mTOR) and regulate HDAC/MEF2 transcriptional responses (muscle development). |
The mTOR signaling pathway regulated ILK negatively
Compared to the untreated control, ILK phosphorylation levels increased following 3-h treatment with 100 nM PP242. ILK protein expression was not significantly different (Figure 2G). Moreover, ILK activity following treatment with 100 nM PP242 increased approximately 1.7-fold (1.6816 ± 0.061, P < 0.05) compared to that in untreated cells (1.0 ± 0.054, P > 0.05) (Figure 2H). The results suggest that mTOR regulates ILK negatively. The results are the mean ± SD of triplicate experiments. *P < 0.05.
Interaction between ILK and MEF2C
Analysis of the intracellular localization of MEF2C showed that it colocalized with ILK in the gSSCs (Figure 2I). Moreover, both ILK and MEF2C were detected in the co-IP products of ILK and MEF2C (Figure 2J, Anti-ILK and Anti-MEF2C, respectively). The controls normal IgG and PBS+BSA were both negative. From two gSSC samples, input 1 (the resulting ILK co-IP product) and input 2 (the resulting MEF2C co-IP product) contained ILK and MEF2C (Figure 2K), respectively. These results suggest that there is interaction between ILK and MEF2C.
ILK regulated MEF2C negatively
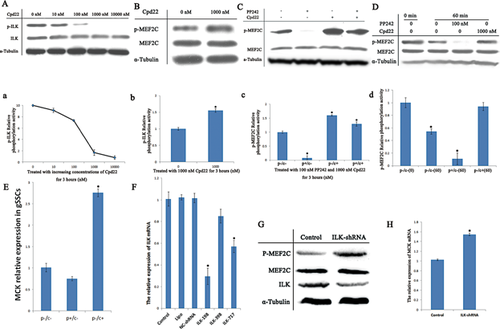
ILK activity decreased gradually as Cpd 22 concentrations increased (Figure 3A: p-ILK; and a), but ILK expression was not affected (Figure 3A: ILK). ILK phosphorylation activity was sharply inhibited following 3-h treatment with 1000 nM Cpd 22 (Figure 3A: ILK; and a), which we selected for further study. Subsequently, MEF2C activity following 3-h 1000 nM Cpd 22 treatment was approximately 1.6 times higher (1.5526 ± 0.054, P < 0.05) than that in untreated cells (1.0 ± 0.042, P > 0.05) (Figure 3B and b), suggesting that ILK regulates MEF2C negatively.

We treated gSSCs with 100 nM PP242 (p+/c−), 1000 nM Cpd 22 (p−/c+), and 100 nM PP242 plus 1000 nM Cpd 22 (p+/c+), or left gSSCs untreated (p−/c−). Compared with the control (1.0 ± 0.037, P > 0.05), MEF2C (S59) relative phosphorylation activity decreased greatly following treatment with PP242 only (0.0808 ± 0.076, P < 0.05) (Figure 3C: p-MEF2C; c: p+/c−), or was approximately 1.7-fold higher (1.6005 ± 0.023, P < 0.05) following treatment with Cpd 22 only (Figure 3C: p-MEF2C; c: p−/c+). However, Cpd 22 blocked ILK activity when we decreased mTOR activity using PP242, and MEF2C activity was increased by approximately 1.3-fold (1.2923 ± 0.074, P < 0.05) (Figure 3C: p-MEF2C; c: p+/c+), and might not have been regulated by mTOR. These findings indicate that inhibiting ILK activity partially blocked mTOR signaling pathway interaction with MEF2C.
The differing ILK activities derived from three groups of gSSCs (p−/c−; p+/c-; p−/c+) were combined with that of MEF2C (from untreated gSSCs) to detect MEF2C dephosphorylation of ILK. Compared to the control (1.0 ± 0.079, P > 0.05) (in the presence of ATP and kinase buffer but without incubation at 30°C), ILK from untreated gSSCs dephosphorylated MEF2C by approximately 0.5-fold (0.5425 ± 0.043, P < 0.05) (Figure 3D: p-MEF2C; d: p−/c−(60)). ILK from gSSCs treated with 100 nM PP242 greatly dephosphorylated MEF2C by approximately 0.1-fold (0.1110 ± 0.091, P < 0.05) [Figure 3D: p-MEF2C; d: p+/c−(60)] compared to the control. However, ILK dephosphorylated MEF2C only slightly when ILK activity was blocked by Cpd 22 (0.9401 ± 0.043, P > 0.05) [Figure 3D: p-MEF2C; d: p−/c+ (60)]. The ILK kinase assay suggested that ILK promotes MEF2C (S59) dephosphorylation in vitro.
In this study, MCK mRNA expression in gSSCs treated with 100 nM PP242 was about 0.75 times (0.7488 ± 0.051, P > 0.05) lower than that in untreated gSSCs (1.0119 ± 0.108, P > 0.05). However, MCK mRNA expression in gSSCs treated with 1000 nM Cpd 22 (2.7556 ± 0.091, P < 0.05) was greater than that in the untreated gSSCs (Figure 3E). These data suggest that mTOR and ILK regulate MCK expression.
ILK-shRNA enhanced MEF2C activity and MCK expression in gSSCs
After three ILK-shRNAs (ILK-198, ILK-398, ILK-717), NC-shRNA, Lipofectamine reagent alone (Lipo), and untransfected control cells (Control) were transiently transfected into gSSCs for 48-h (Figure 3F), Control, Lipo, and NC-shRNA had similar levels of ILK mRNA: 1.0082 ± 0.065, 1.0236 ± 0.025, 1.0156 ± 0.043, respectively (P > 0.05), but three ILK-shRNAs had different levels of ILK mRNA: ILK-198, 0.2956 ± 0.075 (P < 0.05); ILK-398, 0.8506 ± 0.064 (P > 0.05); ILK-717, 0.5706 ± 0.056 (P < 0.05). Of the ILK-shRNAs tested, ILK-198 was the most potent and was selected for further study.
We transfected gSSCs with ILK-shRNA for 48 h, and then there was an obvious decrease in ILK expression compared to that of the control untransfected gSSCs (Figure 3G). There was a similar decrease in MEF2C expression; MEF2C activity increased distinctly, and MCK mRNA levels (1.5431 ± 0.026, P < 0.05) were significantly higher than that of the control (1.0231 ± 0.018, P > 0.05) (Figure 3H). The similarity of the results to that of the drug treatments suggested that ILK downregulates MEF2C.
Discussion
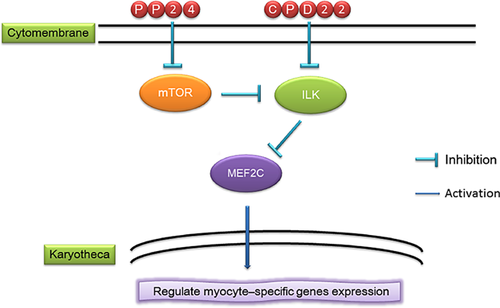
mTOR signaling pathway plays a vital role in muscle cell growth, differentiation, and signal transduction (Goodman et al., 2010). The classic PI3K/AKT/mTOR pathway is well-known, but mTOR signaling pathway feedback and cross-regulation should not be neglected. Our findings suggest that feedback and cross-regulation in the mTOR signaling network plays an irreplaceable role in signal transduction. We determined that mTOR regulates ILK negatively and that ILK regulates MEF2C negatively; the resulting phenotype is positive mTOR regulation of MEF2C.
Desmin and α-actin are skeletal muscle fiber structural proteins, and MyoD1, Myf5, and Pax7 are specifically expressed in SCs. MyoD1 is only expressed in activated SCs. Myf5 and MyoD1 are functionally complementary; both are responsible for upstream regulation of skeletal muscle generation. Pax7 is expressed in myoblast differentiation, proliferation, and activation, sharing a very close relationship with myoblast growth and repair (Grounds and McGeachie, 1992; Yablonka-Reuveni and Rivera, 1994; Wu et al., 2012). Here, gSSC expression of desmin, α-actin, MyoD1, Myf5, and Pax7 demonstrated that gSSCs are derived from skeletal muscle, and have SC characteristics. In SCs, nutrient reduction stimulates the generation of serum response factor, which is required for skeletal muscle growth and maturity (Li et al., 2005; Wu et al., 2012). Then, the FMM is expressed in the myoblasts. These data indicate that the gSSCs we obtained had SC characteristics and differentiation ability.
The obvious and according inhibition of S6K (T173) and MEF2C (S59) activity by PP242 in the gSSCs suggests that the mTOR signaling pathway regulates MEF2C (S59) activity via S6K or proteins downstream of S6K. MEF2C regulates the expression of many skeletal muscle-related genes, such as those for creatine kinase, myosin, actin, and vimentin (Kelly et al., 2002). The DNA-binding activity of MEF2C is also associated with the level of MEF2C (S59). Moreover, in this study, the synchrony between MCK expression and MEF2C (S59) suggested that MEF2C regulates the expression of the related genes and is in turn regulated by mTOR signaling. This suggests that mTOR signaling induces skeletal muscle hypertrophy, which is consistent with the report of Goodman et al. (2010).
Generally, cell signaling transduction relies on phosphorylation between proteins. In the study, the MEF2C activity of and the mTOR pathway was reduced following PP242 treatment. It is possible that all of the proteins that bind with MEF2C were reduced, and we could not obtain any protein that interacts with MEF2C. Therefore, we only detected proteins in the band from the control. (Bennecib et al., 2001; Bassel-Duby and Olson, 2006; Hannigan et al., 2007; McDonald et al., 2008; Ginnan et al., 2012)
In recent years, it has been reported that mTORC1 is involved in the upstream negative feedback regulatory mechanism of the pathway (Tzatsos and Kandror, 2006; Tzatsos and Tsichlis, 2007; Zhang et al., 2008; Efeyan and Sabatini, 2010). mTOR regulates ILK activity through PI3K (Serrano et al., 2013). In C2C12, mTORC1 activates S6K1, which in turn phosphorylates insulin receptor substrate-1 (IRS-1), thereby inhibiting PI3K (Manning, 2004; Harrington et al., 2005), eventually inhibiting the ILK activation. Consistent with these reports, our results also suggest that mTOR signaling regulates ILK negatively.
As ILK inhibited MEF2 activity, we suggest that the molecular structure of ILK is important for MEF2C (S59). ILK has three structural units and has a relative molecular mass of 59 kD; its phosphoinositide motif proteomics studies recently confirmed binds with phosphatidylinositol-3, 4, 5-(PO4)3 (Pasquali et al., 2007). This also demonstrates why PI3K activates ILK. Moreover, inhibiting ILK phosphorylation blocked mTOR signaling pathway-regulated MEF2C (S59) obviously. From this and their co-IP and colocalization results, we infer that ILK dephosphorylates MEF2C (S59). The ILK C-terminal has a protein kinase structural domain. Following activation, ILK activates protein kinase B (PKB) and glycogen synthase kinase (GSK3) by phosphorylating the S473 of PKB and GSK3, and thereby regulating cell proliferation (Chiswell et al., 2008; Engelman Mde et al., 2013; Serrano et al., 2013). This suggests that ILK or its multi-protein complex dephosphorylates MEF2C (S59). The MCK expression not only demonstrated that ILK dephosphorylates MEF2C (S59) and that inhibiting mTOR increases the MEF2C (S59)-dephosphorylating activity of ILK in vitro but that it also regulates the MCK expression promoted. These evidences suggest that mTOR and ILK may be involved in muscle growth. However, ILK partially blocked mTOR signaling pathway regulation of MEF2C (S59) phosphorylation, suggesting the involvement of a protein other than ILK in mTOR regulation of MEF2C.
In conclusion, the mTOR signaling pathway regulates MEF2C activity through ILK, further regulating muscle cell growth. We used gSSCs to investigate mTOR signaling pathway inhibition of ILK activity through the S6K negative feedback loop (Figure 4). This study sheds more light on the molecular mechanism of mTOR signaling pathway regulation of MEF2C, revealing more of mTOR signaling pathway regulation of muscle development.

Acknowledgments
Special thanks go to Kuan Lu and Shaoqing Liu (Yi Wei White Cashmere Goat Farm, Inner Mongolia Autonomous Region of China) for their help with the sample preparation and collection.
Ethics statement
All studies adhered to procedures consistent with the Council for the International Organizations of Medical Sciences International Guiding Principles for Biomedical Research Involving Animals, and the studies were approved by the Institutional Animal Care and Use Committee of Inner Mongolia University. The owner of the YiWei White Cashmere Goat Farm also granted permission for the study.


