N-acetyltransferase 10 promotes colon cancer progression by inhibiting ferroptosis through N4-acetylation and stabilization of ferroptosis suppressor protein 1 (FSP1) mRNA
Abstract
Background
N-acetyltransferase 10 (NAT10) is the only enzyme known to mediate the N4-acetylcytidine (ac4C) modification of mRNA and is crucial for mRNA stability and translation efficiency. However, its role in cancer development and prognosis has not yet been explored. This study aimed to examine the possible role of NAT10 in colon cancer.
Methods
The expression levels of NAT10 were evaluated by immunohistochemical analyses with a colon cancer tissue microarray, and its prognostic value in patients was further analyzed. Quantitative real-time polymerase chain reaction (qRT-PCR) and Western blotting were performed to analyze NAT10 expression in harvested colon cancer tissues and cell lines. Stable NAT10-knockdown and NAT10-overexpressing colon cancer cell lines were constructed using lentivirus. The biological functions of NAT10 in colon cancer cell lines were analyzed in vitro by Cell Counting Kit-8 (CCK-8), wound healing, Transwell, cell cycle, and ferroptosis assays. Xenograft models were used to analyze the effect of NAT10 on the tumorigenesis and metastasis of colon cancer cells in vivo. Dot blotting, acetylated RNA immunoprecipitation-qPCR, and RNA stability analyses were performed to explore the mechanism by which NAT10 functions in colon cancer progression.
Results
NAT10 was upregulated in colon cancer tissues and various colon cancer cell lines. This increased NAT10 expression was associated with shorter patient survival. Knockdown of NAT10 in two colon cancer cell lines (HT-29 and LoVo) impaired the proliferation, migration, invasion, tumor formation and metastasis of these cells, whereas overexpression of NAT10 promoted these abilities. Further analysis revealed that NAT10 exerted a strong effect on the mRNA stability and expression of ferroptosis suppressor protein 1 (FSP1) in HT-29 and LoVo cells. In these cells, FSP1 mRNA was found to be modified by ac4C acetylation, and this epigenetic modification was associated with the inhibition of ferroptosis.
Conclusions
Our study revealed that NAT10 plays a critical role in colon cancer development by affecting FSP1 mRNA stability and ferroptosis, suggesting that NAT10 could be a novel prognostic and therapeutic target in colon cancer.
Abbreviations
-
- ac4C
-
- N4-acetylcytidine
-
- ANOVA
-
- One-way analysis of variance
-
- CCK-8
-
- Cell Counting Kit-8
-
- CRP
-
- C-reaction protein
-
- DMEM
-
- Dulbecco's Modified Eagle Medium
-
- EdU
-
- 5-ethynyl-2′-deoxyuridine
-
- FSP1
-
- ferroptosis suppressor protein 1
-
- GEO
-
- Gene Expression Omnibus
-
- GSH
-
- glutathione
-
- LDH
-
- Lactate dehydrogenase
-
- MDA
-
- malondialdehyde
-
- NAT10
-
- N-acetyltransferase 10
-
- qRT-PCR
-
- Quantitative Realreal-time polymerase chain reaction
-
- RIP
-
- RNA immunoprecipitation
-
- ROS
-
- reactive oxygen species
-
- γH2AX
-
- phosphorylated H2A.X variant histone
1 BACKGROUND
Colon cancer remains a leading cause of cancer-related death worldwide, and 30%-50% of patients experience recurrence, metastasis, and even death within 5 years of treatment [1-4]. Although screening and treatment strategies for colon cancer have improved in recent years, the prognosis of advanced colon cancer remains poor largely due to a lack of understanding of the molecular mechanisms underlying its development [5-11].
Since the 1950s, evidence about chemical modifications of nucleosides in RNA, which extensively affect RNA structure, biogenesis, and function, has been increasing; thus our understanding of the complexity of RNA has been increasing [12]. N-acetyltransferase 10 (NAT10) is a lysine acetyltransferase that acetylates RNA [13, 14]. NAT10 is found in the nucleolus and regulates telomerase activity, ribosomal RNA transcription, and cytokinesis [15-17]. A previous study reported that self-acetylated NAT10 activated ribosomal RNA biogenesis, while NAT10 was inhibited by Sirtuin 1-mediated deacetylation [17]. In addition, NAT10 activates p53 via the acetylation of damaged DNA and stabilizes microtubules via the acetylation of α-tubulin [18]. Notably, NAT10 has been associated with various cancers, such as breast cancer [16] and hepatocellular carcinoma [19]. The addition of N4-acetylcytidine (ac4C) is a conserved chemical RNA modification [20]. Several studies have shown that the addition of ac4C improved the fidelity or accuracy of protein translation [21-23]. Recent studies have also found that ac4C is widely present in oscillating sites of mRNA, where it helps to maintain mRNA stability and improve translation efficiency [24, 25]. It should be noted that ac4C acetylation, the first acetylation modification identified in mRNA, is associated with the occurrence and prognosis of various diseases [20, 26–29]. However, the precise role of NAT10-mediated ac4C acetylation in the progression and metastasis of colon cancer remains unclear.
Ferroptosis is involved in physiological processes and various diseases, such as cancer, and it is characterized by unique properties and recognition functions [30-33]. Unlike autophagy and apoptosis, ferroptosis is a form of cell death characterized by cytological changes, including reduced or absent mitochondrial crests, reactive oxygen species production, and membrane damage [34-36]. Although cancer cells are in a state of constant oxidative stress, the delicate balance between mercaptan and catalytic iron prevents iron sagging during cancer development [37-39]. However, the molecular mechanism underlying iron sagging has not yet been elucidated.
In this study, we evaluated the functional role of NAT10 in colon cancer progression and analyzed its prognostic value for colon cancer patients. We further explored whether the regulation of ferroptosis is a critical mechanism by which NAT10 functions in colon cancer and whether ferroptosis regulators are direct targets of ac4C acetylation.
2 MATERIALS AND METHODS
2.1 Patients and tissue samples
Samples of colon cancer tissues (International Classification of Diseases, 11th edition, code 2B90) and normal adjacent tissues were collected from patients undergoing surgical resection at the Third Affiliated Hospital of Soochow University (Changzhou, Jiangsu, China) between January 2014 and December 2017. The following patients were excluded: (1) those who received neoadjuvant chemotherapy or radiotherapy and (2) those who had other cancers. All the patients were classified according to the 8th edition of TNM staging system released by the Union for International Cancer Control and American Joint Committee on Cancer. Written informed consent was obtained from all the participants. Their clinicopathological characteristics are presented in Supplementary Table S1. The samples were frozen in liquid nitrogen and stored at −80°C until use.
2.2 Immunohistochemistry (IHC) of NAT10
IHC assays were performed to evaluate NAT10 expression in human colon cancer tissues as well as adjacent normal tissues following a previously described protocol [40]. Briefly, a paraffin-embedded colon cancer tissue microarray (HColA180Su21, Shanghai Outdo Biotech Co. Ltd., Shanghai, China) was dried, dewaxed, and then rehydrated in gradient ethanol solutions. After the sections were immersed, they were rinsed phosphate-buffered saline solution (PBS, C0221A, Beyotime, Shanghai, China) and blocked with bovine serum albumin (1 mg/mL, ST2254, Beyotime) in PBS. The sections were incubated with a rabbit anti-human NAT10 monoclonal antibody (1:200, ab194297, Abcam, Cambridge, MA, USA) at 4°C overnight. The sections were washed the next morning and incubated with a secondary antibody (ab205719, Abcam) for 30 min at 37°C. The dehydrated sections were then cleared and mounted; diaminobenzene was used as the chromogen, and hematoxylin was used as the nuclear counterstain. The immunostaining intensity of NAT10 was measured based on the previously described H-score method [40]. Two pathologists who were blinded to the patients' clinical data made the diagnosis according to the 8th edition of the Union for International Cancer Control and American Joint Committee on Cancer TNM Staging Manual. According to the immunoreactivity scores, the colon cancer patients were divided into two groups: low expression (H-score ≤ 100) and high expression (H-score > 100).
2.3 RNA extraction and quantitative real-time polymerase chain reaction (qRT-PCR) analysis
Following a previously described protocol [40], RNA extraction and qRT-PCR were performed using the ABI vii7 system (Applied Biosystems, Foster City, CA, USA). The reaction conditions were as follows: denaturing at 95°C for 30 s, followed by 40 cycles of annealing at 60°C for 30 s and elongation at 72°C for 30 s. The SYBR green reagent (4472908, Thermo Fisher, Waltham, MA, USA) was used, and human glyceraldehyde-3-phosphate dehydrogenase (GAPDH) was chosen as the housekeeping gene. The following primers were synthesized and used: human NAT10 forward primer: 5’-TCACTCCCCGGAAGGACCTG-3’, and reverse primer: 5’-AGCCTGGGGGTCAAGCCATA-3’; ferroptosis suppressor protein 1 (FSP1) forward: 5′-CAAGTGGCCCTGGCTGACAA-3′, and FSP1 reverse: 5’-TGGCCACCTCTGTGCCTTTG-3’; GAPDH forward: 5′-TGACTTCAACAGCGACACCCA-3′, and GAPDH reverse: 5’-CACCCTGTTGCTGTAGCCAAA-3’. Relative gene expression was normalized to GAPDH mRNA expression and analyzed using the comparative CT method (ΔΔCT).
2.4 Western blotting analysis
Western blotting analysis was performed as previously described [40]. Anti-NAT10 (1:1000, ab194297, Abcam) and HRP-labeled anti-GAPDH antibodies (1:5000, KC5G4, Kancheng Biotechnology, Shanghai, China) were used. A chemiluminescence detection kit from Thermo Fisher was used to visualize the immunoreaction. A video documentation system (Gel Doc 2000, Bio-Rad, Hercules, CA, USA) was used to quantify the band densities.
2.5 Total ac4C quantification
Total RNA from each sample was harvested, and the quantification of the ac4C levels was performed by using a Total ac4C acetylation Quantification kit (GK-4040, Colorimetric, Genelily Biotech, Shanghai, China) according to the manufacturer's instructions.
2.6 Ac4C dot blotting
Total RNA from each sample was heated to 75°C for 5 min, cooled for 1 min, and loaded onto Amersham Hybond-N+ membranes (0.45 μm, YA1760, Solarbio, Beijing, China). The membranes were crosslinked, blocked, and incubated with an anti-ac4C antibody (1:2000, ab252215, Abcam) at 4°C overnight. The membranes were then washed and probed with an HRP-conjugated secondary anti-rabbit IgG at 25°C for 1 h. We then washed the membranes three times and visualized the proteins of interest with the Chemiluminescent HRP substrate (WBKLS0500, Millipore, Billerica, MA, USA). After exposure, the membranes were stained with methylene blue staining buffer with gentle shaking for 30 min and then washed with ribonuclease-free water. Then, the input RNA was scanned to determine its total content.
2.7 Cell lines and cell culture
The human colon cancer cell lines (HT-29, HCT-116, SW480, SW620, LoVo, SW48, DLD-1, Caco-2, HCT-15) and a normal human colon mucosal epithelial cell line NCM460 were purchased from the Chinese Academy of Sciences, Shanghai Institutes for Biological Sciences (Shanghai, China) and verified by short tandem repeat genotyping. Dulbecco's Modified Eagle Medium (DMEM, 11960077, Gibco, Grand Island, NY, USA) supplemented with 10% fetal bovine serum (10099141, Gibco) was used to maintain all the cell lines under standard conditions (5% CO2, 37°C). For the ferroptosis inhibition groups, ferrostatin-1 (2 μmol/L, HY-100579, MedChemExpress, Princeton, NJ, USA) was added to the complete culture medium.
2.8 Construction of stable NAT10-knockdown and NAT10-overexpressing colon cancer cell lines
To construct stable NAT10-knockdown colon cancer cell lines (HT-29 and LoVo), short hairpin RNA (shRNA) specifically targeting NAT10 was designed by the Invitrogen online tool (https://rnaidesigner.thermofisher.com/rnaiexpress/) and cloned into the lentiviral pLVX-sh1 vector. For the construction of stable NAT10-overexpressing colon cancer cell lines (SW-480 and DLD-1), the human NAT10-coding sequence (NM_024662.3) was purchased from Generalbiol Biotech (Hefei, Anhui, China) and cloned into the lentiviral pLVX-IRES-puro vector. The shRNA sequences and NAT10-coding sequences are presented in Supplementary Table S2. Lentiviruses carrying NAT10 shRNA or the NAT10-coding sequences were constructed by Genelily Biotech Co., Ltd. The colon cancer HT29 and SW480 cell lines were infected with lentivirus in 6-well plate following the manufacturer's instructions. The medium was replaced with complete medium the next day. Stably infected colon cancer cells were selected by incubation with 2 μg/mL puromycin for two weeks. The efficiency of NAT10 knockdown or overexpression was examined by qRT-PCR and Western blotting.
2.9 Cell proliferation assay
Cell proliferation was measured by Cell Counting Kit-8 (CCK-8, Dojindo, Tokyo, Japan) assays as previously described [40]. Briefly, cells were seeded in a 96-well plate at a density of 1 × 10³ cells/well and cultured for the indicated time points (0, 24, 48, 72 h). After incubation with 10 μL of CCK-8 reagent for 1 h, the absorbance at 450 nm was measured.
2.10 Colony formation assay
Colon cancer cells were cultivated in 6-well plates at a concentration of 1 × 10⁴ cells per well. A 10-day culture was terminated by fixation with 4% paraformaldehyde and staining with 1% crystal violet. The colony forming units within each well were subsequently photographed and recorded by an Olympus CX53 microscope (Tokyo, Japan).
2.11 Cell cycle analysis
Cell cycle distribution was assessed by propidium iodide (PI, A601112, Sango Biotech, Shanghai, China) staining, followed by flow cytometry analysis. Colon cancer cells were harvested, washed, and resuspended in DMEM at a concentration of 1 × 10⁵ cells/tube. Then, the cells were fixed and incubated with RNase A (BioLegend, San Diego, CA, USA) and PI solution. A flow cytometer (FACS CantoTM II, BD Biosciences, Franklin Lakes, NJ, USA) was used to generate DNA histograms to assess the cell cycle distribution.
2.12 Cell migration assay
Cell migration was assessed using a wound healing assay as previously described [40]. Briefly, a 200 μL pipette tip was used to scratch the cell monolayer, and the wound width was captured after 0 and 24 h by an Olympus CX53 microscope with a digital camera. The migration distance was analyzed using ImageJ software (National Institutes of Health, Bethesda, MD, USA).
2.13 Cell invasion assay
Cell invasion was examined using Matrigel (BD Bioscience)-coated Transwell chambers (8 μm pore size, BD Bioscience) as previously described [40]. Briefly, colon cancer cells in a total of 200 mL serum-free medium were seeded in the Matrigel-coated upper chamber. The chambers were fixed in 4% paraformaldehyde for 10 min and stained with crystal violet after 24 h. Images were captured by an Olympus CX53 microscope with a digital camera, and the number of metastatic cells was counted using ImageJ software.
2.14 Tumor xenografts
BALB/c nude mice (5 weeks old, male) were purchased from the Shanghai Laboratory Animal Center (Shanghai, China). For the tumorigenesis assay, knockdown negative control (shNC) HT-29 cells, NAT10-knockdown (shNAT10) HT-29 cells, overexpression control (oeNC) SW480 cells and NAT10-overexpression (oeNAT10) SW480 cells were subcutaneously injected into the backs of nude mice. In the ferroptosis inhibition groups, ferrostatin-1 (1 mg/kg) was injected via the tail vein every five days. The tumor size was measured every five days, and the tumor volume was calculated as follows: tumor volume = (length × width2) / 2. For the EdU incorporation assay, the mice were intraperitoneally injected with EdU (100 mg/kg, Beyotime) 24 h before being euthanized. After 30 days, the mice were euthanized by CO2 inhalation, and the tumors were removed, photographed, weighed, and fixed for EdU staining according to the manufacturer's protocol.
For the lung metastasis experiment, HT29 (shNC and shNAT10) and SW480 (oeNC and oeNAT10) cells were injected into the tail veins of nude mice to assess their metastatic ability. In the ferroptosis inhibition groups, ferrostatin-1 (1 mg/kg) was injected via the tail vein every five days. After 30 days, the mice were euthanized by CO2 inhalation. The lungs were then excised and fixed for H&E staining and IHC analysis. The number of lung tumor metastases was calculated.
2.15 RNA-sequencing (RNA-seq)
RNA-seq was conducted to screen the potential NAT10-regulated mRNAs following a previously described protocol [40]. We used HiSeq RNA-Seq using a HiSeq 4000 (Illumina, San Diego, CA, USA) for total RNA-seq, and HISAT2 (http://daehwankimlab.github.io/hisat2/) was used to map the transcriptome reads to the reference genome (hg19). Next, gene expression levels were quantified using the Ballgown package.
2.16 Acetylation site prediction
The conserved acetylation sites in the FSP1 messenger RNA-coding sequences were predicted by PACES tools (http://rnanut.net/paces/) with a specificity of 99%.
2.17 ac4C RNA immunoprecipitation (RIP) assay and qRT-PCR
ac4C-RIP was performed using an RNA immunoprecipitation kit (GK-5044, Genelily Biotech) according to the manufacturer's instructions. Briefly, cells were lysed with 1 mL RIP lysis buffer for 10 min, and then 100 μL of the lysates were stored at −80°C. An anti-ac4C antibody (1:50, ab252215, Abcam) or normal rabbit IgG (1:50, 2729S, Cell Signaling Technology, Beverly, MA, USA) was mixed with protein A/G beads at 4°C for 2 h and then incubated with 450 μL of the lysate at 4°C for 2 h. After washing the beads with buffer, the RNA was extracted, and then qRT-PCR was performed as previously described.
2.18 Gene Expression Omnibus (GEO) database analysis
The FSP1 expression in colon cancer tissues was analyzed with the GEO dataset (GSE31782, https://www.ncbi.nlm.nih.gov/geo/).
2.19 RNA stability assay
HT-29 cells were treated with actinomycin D (5 μg/mL, HY-17559, MedChemExpress) for 0, 1, 3, and 6 h in 6-well plates. The FSP1 mRNA half-life was estimated by linear regression analysis of total RNA collected using the method described above for quantitative real-time PCR analysis.
2.20 Luciferase report assay
We first constructed two luciferase reporter plasmids by inserting partial FSP1 mRNA sequences with wild-type or C132A-mutated ac4C sites. For luciferase assays, colon cancer cells were seeded in 24-well plates at a concentration of 1 × 10⁵ cells/well. The cells were transfected with the plasmid with Lipofectamine 3000 (L3000015, Thermo Fisher). After transfection for 24 h, we measured the activity of luciferase in the harvested cells using the Dual-Luciferase Reporter Assay System (Promega, E1910, San Luis Obispo, CA, USA). The relative luciferase activity was normalized to the Renilla luciferase activity.
2.21 Ferroptosis assay
It is well known that lipid-reactive oxygen species (ROS) accumulation, lipid peroxidation, glutathione (GSH) depletion, and iron accumulation are critical indicators of ferroptosis. Therefore, we measured the levels of intracellular ROS with the 2’-7’dichlorofluorescin diacetate (DCFH-DA) dye (S0033S, Beyotime) according to the manufacturer's instructions. The level of GSH was analyzed using a Glutathione Assay Kit (CS0260, Sigma-Aldrich, CA, USA) according to the instructions. The level of malondialdehyde (MDA) was analyzed with a TBA method Kit (A003, Nanjing Jiancheng, Nanjing, Jiangsu, China) following the manufacturer's instructions. The cellular concentration of iron was measured by an Iron Assay Kit (ab83366, Abcam) according to the manufacturer's instructions. The lactate dehydrogenase (LDH) activity in serum was measured with an LDH Activity Kit (BC0680, Solarbio). The serum levels of C-reaction protein (CRP) were measured with a CRP ELISA kit (EK1316, Boxter, Wuhan, Hubei, China). The level of phosphorylated H2A.X variant histone (γH2AX) was measured by a phospho-gamma H2A.X (S139) ELISA Kit (ab279816, Abcam).
2.22 Transmission electron microscopy (TEM)
The morphological characteristics of ferroptosis in colon cancer cells were analyzed by TEM. Briefly, a total of 2 × 10⁴ cells were seeded onto a chambered cover glass (Thermo Fisher). TEM images were captured by a Hitachi HT-7700 transmission electron microscope (Hitachinaka, Ibaraki, Japan).
2.23 Statistical analysis
The data are expressed as the mean ± standard deviation. The experiments were repeated three times, and all the statistical analyses were conducted using GraphPad Prism 9.0 (GraphPad Software, Inc., San Diego, CA, USA). Student's t test, one-way analysis of variance (ANOVA), and two-factor ANOVA were used to compare differences between and among groups. For all the statistical tests, P < 0.05 (bilateral) was considered to indicate statistical significance.
3 RESULTS
3.1 NAT10 was upregulated in colon cancer cells and was associated with a short survival
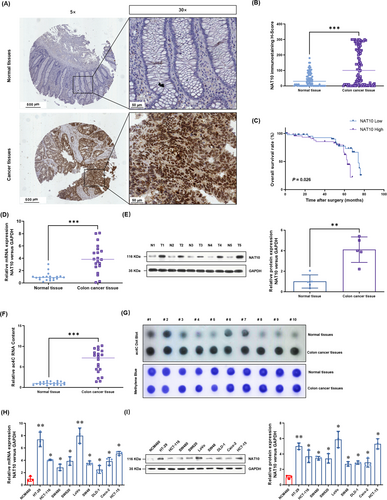
To understand the potential role of NAT10 in colon cancer, we performed IHC analyses with a tissue microarray that included tumor tissues and paired adjacent tissues from 90 patients. Clinicopathological characteristics of these patients are summarized in Table 1. The IHC results showed that the NAT10 protein levels were predominantly localized in the nuclei of colon cancer cells (Figure 1A) and were significantly higher than those in adjacent normal tissues (Figure 1B). The overall survival of patients with low NAT10 expression seemed to be longer than that of patients with high NAT10 expression (P = 0.026, hazard ratio = 0.48, 95% confidence interval = 0.21-1.09, Figure 1C). Moreover, we performed a chi-square test to evaluate the associations between NAT10 expression and clinicopathological characteristics. The results showed that the expression of NAT10 was associated with lymph node metastasis and T stage (Table 1). We further evaluated the NAT10 mRNA and protein levels in 20 paired fresh colon cancer tissues and adjacent tissues. The results showed that the NAT10 mRNA (Figure 1D) and protein levels (Figure 1E) were significantly higher in colon cancer tissues than in the paired adjacent tissues. Consistently, the total ac4C acetylation of RNA, which was quantified by the Colorimetric Kit (Figure 1F) and dot blotting (Figure 1G), was also significantly increased in the colon cancer tissues. Moreover, the NAT10 mRNA (Figure 1H) and protein levels (Figure 1I) in cultured colon cancer cell lines HT-29, HCT-116, SW480, SW620, LoVo, SW48, DLD-1, Caco-2, and HCT-15 were significantly higher than those in a normal human colon mucosal epithelial cell line NCM460. Collectively, these results suggest that NAT10 expression is upregulated in colon cancer and that this upregulated NAT10 expression is associated with a poor prognosis.
| NAT10 expression level [cases (%)] | |||||
|---|---|---|---|---|---|
| Clinical parameter | Total [cases (%)] | Low | High | χ2 | P |
| Total | 90 | 43 (47.8) | 47 (52.2) | ||
| Gender | 0.156 | 0.693 | |||
| Female | 48 (53.3) | 22 (45.8) | 26 (54.2) | ||
| Male | 42 (46.7) | 21 (50.0) | 21(50.0) | ||
| Age (years) | 0.062 | 0.803 | |||
| <65 | 41 (45.6) | 19 (46.3) | 22 (53.7) | ||
| ≥65 | 49 (54.4) | 24 (49.0) | 25 (51.0) | ||
| Tumor size (cm) | 0.556 | 0.456 | |||
| ≤5 | 35 (38.9) | 15 (42.9) | 20 (57.1) | ||
| >5 | 55 (61.1) | 28 (50.9) | 27 (49.1) | ||
| Pathological stage | 0.569 | 0.451 | |||
| I+II | 58 (64.4) | 26 (44.8) | 32 (55.2) | ||
| III | 32 (35.6) | 17 (53.1) | 15 (46.9) | ||
| Lymph node metastasis | 2.392 | 0.039 | |||
| Negative | 57 (63.3) | 26 (45.6) | 31 (54.4) | ||
| Positive | 33 (36.7) | 7 (21.2) | 26 (78.8) | ||
| T stage | 2.258 | 0.042 | |||
| T1-T2 | 39 (43.3) | 26 (66.7) | 13 (33.3) | ||
| T3-T4 | 51 (56.7) | 17 (33.3) | 34 (66.7) | ||
| N stage | 0.584 | 0.445 | |||
| N0-N1 | 56 (62.2) | 25 (44.6) | 31 (55.3) | ||
| N2-N3 | 34 (37.8) | 18 (52.9) | 16 (47.1) | ||
| M stage | 1.637 | 0.201 | |||
| M0 | 85 (94.4) | 42 (49.4) | 43 (50.6) | ||
| M1 | 5 (5.6) | 1 (20.0) | 4 (80.0) | ||
| TNM stage | 3.110 | 0.375 | |||
| I | 9 (10.0) | 3 (33.3) | 6 (66.7) | ||
| II | 46 (51.1) | 25 (54.3) | 21 (45.7) | ||
| III | 30 (33.3) | 14 (46.7) | 16 (53.3) | ||
| IV | 5 (5.6) | 1 (20.0) | 4 (80.0) | ||
3.2 NAT10 promoted the proliferation of colon cancer cells both in vitro and in vivo
To evaluate the functional role of NAT10 in colon cancer, we established several stable NAT10-knockdown cell lines (HT-29 and LoVo cell lines) and NAT10-overexpressing cell lines (SW480 and DLD-1 cell lines) via the lentivirus method. The real-time PCR results showed that the mRNA level of NAT10 was significantly decreased in HT-29 and LoVo cells after NAT10 knockdown (Figure 2A), and the decreased NAT10 protein levels in these cells were then verified using Western blotting (Figure 2B). CCK-8 assay results showed that cell proliferation was significantly suppressed after NAT10 knockdown (Figure 2C). The numbers of colonies formed by NAT10-knockdown colon cancer cells were significantly lower than those formed by vector control cells (Figure 2D). Cell cycle analysis also showed that NAT10 knockdown caused significant cell cycle arrest, with an increased cell population in the G0-G1 phase and a decreased cell population in the G2-M phase (Figure 2E). DNA damage, as indicated by the level of γH2AX, was consistently observed after NAT10 knockdown (Figure 2F).
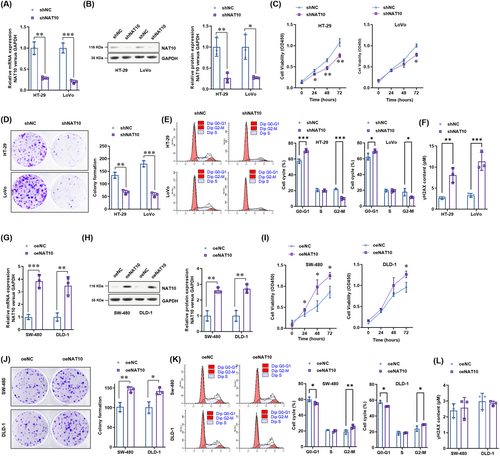
Next, we explored the oncogenic role of NAT10 in two colon cancer cell lines with comparably low NAT10 expression (SW480 and DLD-1 cell lines). The NAT10 mRNA and protein overexpression efficiency was confirmed using real-time PCR (Figure 2G) and Western blotting analysis (Figure 2H). The results showed that cell proliferation, as indicated by the CCK-8 assay (Figure 2I) and colony formation assay (Figure 2J), was significantly enhanced by NAT10 overexpression. Cell cycle analysis further showed that NAT10 could promote colon cancer cell progression from the G0/G1 phase to the G2-M phase, thus promoting cell proliferation (Figure 2K). However, NAT10 did not affect the level of γH2AX (Figure 2L). These results suggest that NAT10 promotes the proliferation of colon cancer cells in vitro.
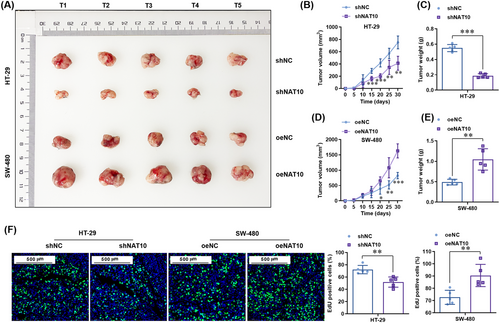
To study whether NAT10 promotes the proliferation of colon cancer cells in vivo, subcutaneous transplantation tumor models in nude mice were established using stable NAT10-knockdown HT-29 cells and stable NAT10-overexpressing SW480 cells. The results showed that NAT10 knockdown significantly decreased the growth (Figure 3A-B) and weight (Figure 3C) of tumors derived from HT-29 cells. In contrast, NAT10 overexpression significantly enhanced the growth (Figure 3A and 3D) and weight (Figure 3E) of tumors derived from SW480 cells. Consistently, the EdU staining in the tumors showed that NAT10 knockdown significantly reduced the numbers of EdU-positive cells, whereas NAT10 overexpression significantly increased the numbers of EdU-positive cells (Figure 3F). Altogether, these results demonstrate that NAT10 promoted the proliferation of colon cancer cells both in vitro and in vivo.
3.3 NAT10 promoted the metastasis of colon cancer cells both in vitro and in vivo
The effect of NAT10 on the metastasis of colon cancer cells was evaluated using wound healing and invasion assays. According to the results, NAT10 knockdown significantly inhibited the migration of HT-29 and LoVo cells (Figure 4A) and decreased the number of invasive cells (Figure 4B). Consistently, the role of NAT10 overexpression in promoting the migration (Figure 4C) and invasion (Figure 4D) of SW480 and DLD-1 cells was observed.
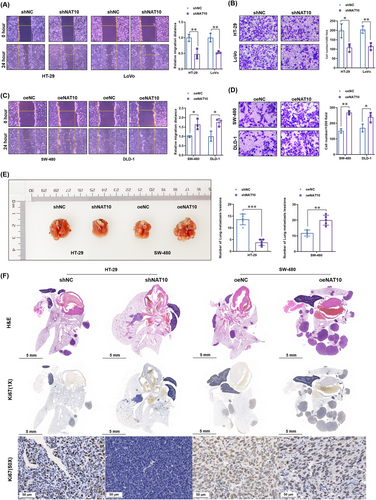
Next, we explored whether NAT10 promotes the metastasis of colon cancer cells in vivo. Similar to the changes in the subcutaneous transplantation tumor model, NAT10 knockdown significantly decreased the number of lung metastatic lesions generated by HT-29 cells, whereas NAT10 overexpression increased the number of lung metastatic lesions generated by SW480 cells (Figure 4E). Moreover, histopathological diagnosis (H&E staining) further confirmed the decreased numbers of metastatic lesions in the NAT10 knockdown group and increased numbers of metastatic lesions in the NAT10 overexpression group (Figure 4F). Ki67 staining showed proliferation in the resected lung tissues, which also suggested that NAT10 knockdown impaired the proliferation in lung metastasis lesions derived from HT-29 cells, whereas NAT10 overexpression promoted the proliferation in those derived from SW-480 cells (Figure 4F). Overall, these results suggest that NAT10 promotes the metastatic ability of colon cancer cells both in vitro and in vivo.
3.4 NAT10 improved the mRNA stability of FSP1 and enhanced its expression in colon cancer cells
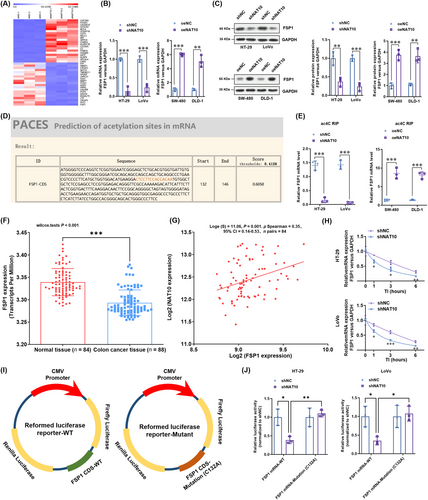
To further explore the underlying mechanisms by which NAT10 promotes the proliferation and metastasis of colon cancer cells, a transcriptomic comparison was carried out to analyze the dysregulated genes between NAT10-knockdown and vector control HT-29 cells. A heatmap of the transcriptome (Figure 5A) showed that FSP1, a glutathione-independent ferroptosis suppressor, was mostly deregulated in NAT10-knockdown HT-29 cells. The decreased level of FSP1 expression in NAT10-knockdown HT-29 and LoVo cells was verified using real-time PCR analysis (Figure 5B) and Western blotting (Figure 5C). Elevated FSP1 levels were observed in NAT10-overexpressing SW-480 and DLD-1 cells by real-time PCR (Figure 5B) and Western blotting analysis (Figure 5C). In addition, a highly conserved acetylation site (Figure 5D) was predicted by PACES tools. The ac4C RIP-PCR results showed that the level of ac4C-acetylated FSP1 mRNA was consistently decreased in NAT10-knockdown HT-29 and LoVo cells (Figure 5E) and increased in NAT10-overexpressing SW-480 and DLD-1 cells (Figure 5E). To understand the expression of FSP1 in colon cancer tumor tissues, we queried the GEO dataset (GSE31782). The results confirmed the lower expression of FSP1 in colon cancer tissues than in adjacent normal tissues (Figure 5F). Interestingly, a positive correlation was observed between the expression of NAT10 and FSP1 in colon cancer tissues (Figure 5G). The mRNA stability of FSP1 was significantly reduced by NAT10 knockdown (Figure 5H). To confirm that NAT10-mediated ac4C modification affected FSP1 mRNA stability, we constructed recombinant luciferase reporter plasmids by inserting partial FSP1 mRNA sequences with wild-type or C132A-mutated ac4C sites (Figure 5I). The results showed that NAT10 knockdown failed to decrease the luciferase activity of the construct with the C132A mutation in the ac4C site (Figure 5J). Collectively, these results suggest that NAT10 improves the stability of FSP1 mRNA and enhances its expression in colon cancer cells.
3.5 NAT10 knockdown significantly increased ferroptosis in colon cancer cells
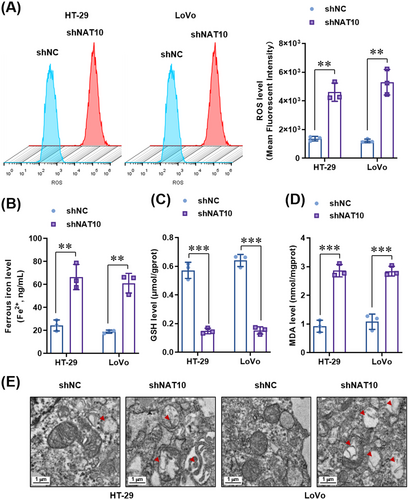
Considering that FSP1 is a glutathione-independent ferroptosis suppressor [41, 42], we explored whether NAT10 alters the level of ferroptosis. We measured the levels of intracellular ROS, GSH, and malondialdehyde (MDA), an oxidative stress marker, in NAT10-knockdown HT-29 and LoVo cells. The intensity of DCFH-DA indicated that lipid ROS levels were significantly increased in NAT10-knockdown HT-29 and LoVo cells compared to vector control HT-29 and LoVo cells (Figure 6A). In addition, ferrous iron (Figure 6B), GSH depletion (Figure 6C), and MDA levels (Figure 6D) were significantly increased after NAT10 knockdown. Furthermore, TEM was performed, and the results showed mitochondrial matrix condensation and the formation of enlarged cristae in NAT10-knockdown HT-29 and LoVo cells (Figure 6E). Taken together, these findings strongly suggest that NAT10 knockdown triggers ferroptosis in colon cancer cells.
3.6 Ferroptosis inhibition reversed the suppressive effects of NAT10 knockdown on the proliferation and metastasis of colon cancer cells both in vitro and in vivo
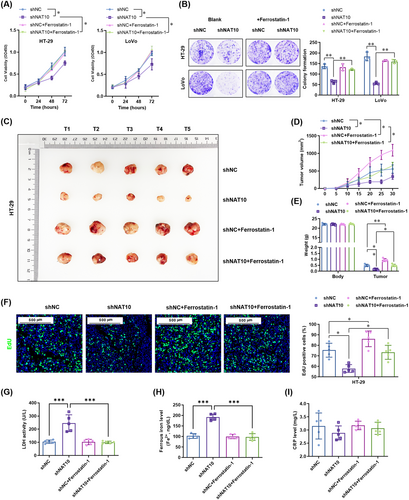
To further confirm whether ferroptosis contributes to the suppression of colon cancer cell proliferation after NAT10 knockdown, we treated colon cancer cells with a specific ferroptosis inhibitor (ferrostatin-1, 2 μmol/L). As expected, inhibition of ferroptosis by ferrostatin-1 did not affect cell proliferation, as indicated by the CCK-8 assay (Figure 7A) and colony formation assay (Figure 7B). However, cell proliferation was significantly increased by ferrostatin-1 in NAT10-knockdown HT-29 and LoVo cells (Figure 7A-B). Interestingly, in the subcutaneous transplantation tumor model in nude mice, ferrostatin-1 significantly improved the growth (Figure 7C-D) and increased the weight (Figure 7E) of the tumors derived from the vector control HT-29 cells. Moreover, ferrostatin-1 significantly abrogated the inhibitory effect of NAT10 knockdown on the growth (Figure 7D) and weight (Figure 7E) of tumors derived from NAT10-knockdown HT-29 cells. Consistently, the EdU incorporation assay showed that NAT10 knockdown reduced the proliferation of cells in the tumors derived from HT-29 cells, and this effect was reversed by ferrostatin-1 treatment (Figure 7F). Regarding ferroptosis, NAT10 knockdown-increased serum levels of LDH (Figure 7G) and ferrous iron (Figure 7H) were significantly reversed by ferrostatin-1, whereas it did not affect the CRP level (Figure 7I). These results demonstrate that inhibition of ferroptosis reversed the NAT10 knockdown-mediated suppression of proliferation in colon cancer cells both in vitro and in vivo.
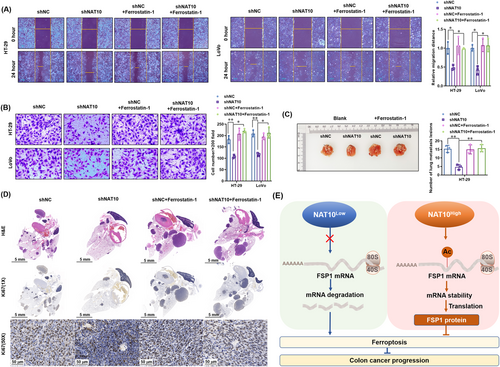
Furthermore, we determined whether ferroptosis contributes to the suppression of metastasis by NAT10 knockdown in colon cancer cells in vitro and in vivo. The results showed that ferrostatin-1 did not affect the migration and invasion of the vector control HT-29 and LoVo cells, but it significantly increased the migration distance and invasion of NAT10-knockdown HT-29 and LoVo cells (Figure 8A-B). Similar to the in vitro results, ferrostatin-1 did not affect the number of lung metastasis lesions derived from the vector control HT-29 cells, but increased the lesions derived from NAT10-knockdown HT-29 cells (Figure 8C). Histopathological diagnosis further confirmed the effect of ferrostatin-1 in promoting the growth of NAT10-knockdown HT-29 cells (Figure 8D). Simultaneously, Ki67 staining showed proliferation in the resected lung tissues, which was not altered by ferrostatin-1 treatment, in the vector control HT-29 group. Ferrostatin-1 enhanced the proliferation in lung metastasis lesions derived from NAT10-knockdown HT-29 cells (Figure 8D). Collectively, these results suggest that the inhibition of ferroptosis reversed the NAT10 knockdown-mediated suppression of proliferation and metastasis of colon cancer cells both in vitro and in vivo (Figure 8E).
4 DISCUSSION
In this study, we revealed several interesting findings regarding the oncogenic functions of NAT10 in the growth and metastasis of colon cancer. We found that NAT10 was upregulated in cancer tissues and cell lines, and upregulated NAT10 expression was associated with shorter survival of colon cancer patients. Functionally, an oncogenic role of NAT10 was revealed in in vitro and in vivo experiments that investigated the proliferation and metastasis of colon cancer cells. Regarding molecular mechanisms, the FSP1 mRNA stability and expression in colon cancer cells were found to be improved by NAT10-mediated ac4C acetylation. Moreover, the results showed that inhibition of ferroptosis by FSP1 is critical to the NAT10-mediated improvement of proliferation and metastasis of colon cancer cells.
Colon cancer has a high mortality, and its incidence is increasing worldwide [2, 3]. Despite advances in colon cancer treatment over the past few decades, the mortality of colon cancer is still very high, mainly due to recurrence and distant organ metastases [6, 8]. NAT10 is a histone acetyltransferase which is mainly localized to the nucleoli and is involved in many biological processes [13, 15]. Evidence suggests that NAT10 can bind to acetyltransferases and RNA, and it is the only enzyme that can catalyze the ac4C modification of eukaryotic RNA [12]. Studies have also shown that ac4C acetylation, an mRNA modification, regulated telomerase activity, RNA synthesis, DNA damage repair, and mRNA stability [12, 43]. It is also associated with the development, progression, and prognosis of various human diseases, especially cancer [19, 44, 45]. Given that it is the only acetyltransferase that catalyzes the ac4C modification, NAT10 is significantly associated with the prognosis of a variety of malignant tumors and may promote tumor progression. High expression of NAT10 in liver cancer [19], breast cancer [16], gastric cancer [26], and head and neck squamous cell carcinoma [46] was associated with poor prognosis. However, few studies have explored the role of NAT10 in colon cancer. Zhang et al. [29] reported that glycogen synthase kinase-3beta-regulated NAT10 was involved in colorectal cancer invasion. Cao et al. [47] found that NAT10 promoted micronucleus formation, activated mechanism underlying the senescence-related secretion phenotype, and promoted colorectal cancer progression. Similar to our observations, these authors found that downregulation of NAT10 inhibited cell proliferation according to cell cycle and BrdU incorporation assays. Furthermore, they showed a critical role of NAT10 under the conditions of oxidative stress or DNA damage. The present study demonstrated that NAT10 was upregulated in colon cancer tissues and cell lines, and high expression of NAT10 was associated with short survival according to a tissue microarray analysis. The expression of NAT10 was also related to lymph node metastasis, clinical stage, and T stage. Interestingly, it seems that the difference appeared later during patient follow-up, which may suggest a limited prognostic value of NAT10 in colon cancer. Furthermore, it was found that knockdown of NAT10 in the colon cancer cell lines with low expression levels (HT-29 and LoVo) impaired the proliferation, migration, and invasion of the cells, whereas overexpression of NAT10 in the colon cancer cell lines with high expression (SW480 and DLD-1) promoted these activities both in in vitro experiments and xenograft models. Collectively, these results suggest an oncogenic role of NAT10 in colon cancer.
To further explore the mechanism by which NAT10 contributes to the progression of colon cancer, we performed a transcriptomic comparison between NAT10-knockdown and vector control HT-29 cells. The results showed a significant decrease in the expression of FSP1, also known as apoptosis-inducing factor mitochondria-associated 2 (AIFM2), in NAT10-knockdown HT-29 cells. Notably, a recent study revealed FSP1 as a glutathione-independent ferroptosis suppressor [42]. Ferroptosis is an iron-dependent form of necrotic cell death characterized by phospholipid oxidative damage, and it is antagonized by glutathione peroxidase 4 (GPX4) and FSP1. In addition, tumor cells that survive other forms of cell death are known to become or remain resistant to ferroptosis [48]. In recent years, there has been evidence that ferroptosis was associated with a multitude of cancers, including head and neck squamous cell carcinoma [30], renal cell carcinoma [39], breast cancer [49], lung cancer [50], pancreatic cancer [51], and diffuse large B-cell lymphoma [52]. Additionally, researchers have found that CD8+ T cell activation increased ferroptosis-specific lipid peroxidation in tumor cells, activating ferroptosis and contributing to the effectiveness of immunotherapy against tumors [53]. Therefore, the therapeutic exploitation of ferroptosis in cancer has become a research hotspot. The present study has shown that NAT10 knockdown significantly induced ferroptosis in colon cancer cells. Moreover, inhibition of ferroptosis using ferrostatin-1 reversed the NAT10 knockdown-mediated suppression of proliferation and metastasis in colon cancer cells both in vitro and in vivo. Interestingly, ferrostatin-1 did not affect the proliferation of colon cancer cells in vitro, but it promoted the tumorigenesis of colon cancers in a subcutaneous transplantation tumor model in nude mice. This result suggests a more complicated role of ferroptosis in the progression of colon cancer in vivo.
Dysregulation of programmed cell death may largely affect the efficiency of colon cancer treatment [48]. Emerging studies have shown that activation of ferroptosis-related pathways was effective in preventing tumor progression and enhancing the benefits of chemotherapy, targeted therapy, and even immunotherapy in colon cancer patients [53]. It is certainly interesting to determine whether NAT10-regulated ferroptosis can improve the therapeutic effect of chemotherapy, targeted therapy, and immunotherapy in colon cancer, and this topic needs further study.
Meanwhile, we recognize some limitations of the present study. Firstly, the in vivo study was performed with a cell line-derived xenograft in Balb/c NOD mice. Colon cancer patient-derived xenograft (PDX) models would be more helpful to understand the critical role of NAT10 in colon cancer progression. Secondly, we concluded that FSP1 is the major target of NAT10-mediated acetylation in the regulation of ferroptosis in colon cancer cells, further evaluation of some other functional acetylated RNAs is required. Thirdly, following dramatic success in many types of advanced solid tumors, immunotherapy has rapidly become established as a major treatment modality for multiple types of solid cancers. Ferroptosis is a promising target for cancer immunotherapy. It would be interesting to identify whether NAT10-FSP1-ferroptosis signaling regulates the immunotherapy efficiency in colon cancer.
5 CONCLUSIONS
Our present study revealed that NAT10 was upregulated in colon cancer tissues and associated with shorter patient survival. We found that NAT10 promoted the proliferation and metastasis abilities of colon cells by increasing the mRNA stability and expression of FSP1, indicating that NAT10-FSP1-ferroptosis signaling is a novel mechanism underlying tumor growth and metastasis in colon cancer.
DECLARATIONS
AUTHOR CONTRIBUTIONS
Jingting Jiang and Xiao Zheng designed this study. Xiao Zheng performed all the experiments; Xiao Zheng, Qi Wang, You Zhou, and Dachuan Zhang collected the tissue samples and the clinical data; Yiting Geng and Wenwei Hu analyzed and interpreted the data; Xiao Zheng and Jingting Jiang drafted the manuscript; Changping Wu and Yufang Shi analyzed the data and revised the manuscript. All the authors read and approved the final manuscript.
ACKNOWLEDGEMENT
This study was supported by the National Natural Science Foundation of China (81902386, 81972869, 82002479), the Natural Science Foundation of Jiangsu Province (BK20211065, BK20200179), China Postdoctoral Science Foundation (2021M700547), Youth Talent Science and Technology Project of Changzhou Health Commission (QN202103), and the open fund of state key laboratory of Pharmaceutical Biotechnology, Nanjing University, China (KF-202203).
COMPETING INTERESTS
The authors declare no conflicts of interest.
AVAILABILITY OF DATA AND MATERIALS
The corresponding author will provide all the data used in this study upon request.
ETHICS APPROVAL AND CONSENT TO PARTICIPATE
Each patient who participated in the study provided written informed consent for the biological studies, and the study was approved by the Ethics Committee at the Third Affiliated Hospital of Soochow University (2019-003). The animal experiments conducted at the Third Affiliated Hospital of Soochow University were approved by the Animal Experimental Committee of the Third Affiliated Hospital of Soochow University (2019-003).
CONSENT FOR PUBLICATION
Not applicable.


