CRISPR/Cas9 screening identifies a kinetochore-microtubule dependent mechanism for Aurora-A inhibitor resistance in breast cancer
Abstract
Background
Overexpression of Aurora-A (AURKA) is a feature of breast cancer and associates with adverse prognosis. The selective Aurora-A inhibitor alisertib (MLN8237) has recently demonstrated promising antitumor responses as a single agent in various cancer types but its phase III clinical trial was reported as a failure since MLN8237 did not show an apparent effect in prolonging the survival of patients. Thus, identification of potential targets that could enhance the activity of MLN8237 would provide a rationale for drug combination to achieve better therapeutic outcome.
Methods
Here, we conducted a systematic synthetic lethality CRISPR/Cas9 screening of 507 kinases using MLN8237 in breast cancer cells and identified a number of targetable kinases that displayed synthetic lethality interactions with MLN8237. Then, we performed competitive growth assays, colony formation assays, cell viability assays, apoptosis assays, and xenograft murine model to evaluate the synergistic therapeutic effects of Haspin (GSG2) depletion or inhibition with MLN8237. For mechanistic studies, immunofluorescence was used to detect the state of microtubules and the localization of Aurora-B and mitotic centromere-associated kinesin (MCAK).
Results
Among the hits, we observed that Haspin depletion or inhibition marginally inhibited breast cancer cell growth but could substantially enhance the killing effects of MLN8237. Mechanistic studies showed that co-treatment with Aurora-A and Haspin inhibitors abolished the recruitment of Aurora-B and mitotic centromere-associated kinesin (MCAK) to centromeres which were associated with excessive microtubule depolymerization, kinetochore-microtubule (KT-MT) attachment failure, and severe mitotic catastrophe. We further showed that the combination of MLN8237 and the Haspin inhibitor CHR-6494 synergistically reduced breast cancer cell viability and significantly inhibited both in vitro and in vivo tumor growth.
Conclusions
These findings establish Haspin as a synthetic lethal target and demonstrate CHR-6494 as a potential combinational drug for promoting the therapeutic effects of MLN8237 on breast cancer.
Abbreviations
-
- AURKA/Aurora-A
-
- aurora kinase A
-
- AURKB/Aurora-B
-
- aurora kinase B
-
- BUB1B
-
- BUB1 mitotic checkpoint serine/threonine kinase B
-
- CHEK1
-
- checkpoint kinase 1
-
- CPC
-
- chromosomal passenger complex
-
- CRISPR
-
- clustered regularly interspaced short palindromic repeats
-
- CSNK1A1
-
- casein kinase 1 alpha 1
-
- GSG2
-
- germ cell-specific gene 2
-
- DAPI
-
- 4′,6-diamidino-2-phenylindole
-
- DDR1
-
- discoidin domain receptor tyrosine kinase 1
-
- EGFP
-
- enhanced green fluorescent protein
-
- EGFP-sgCtrl
-
- cells labeled with EGFP and introduced with a non-targeting sgRNA
-
- ExMD
-
- extends mitotic duration
-
- K-fibers
-
- kinetochore fibers
-
- KMN network
-
- kinetochore null protein 1 (KNL1) -missegregation 12 (MIS12) complex-nuclear division cycle 80 (NDC80) complex
-
- KT
-
- kinetochore
-
- KT-MT
-
- kinetochore-microtubule attachment
-
- MAGeCK
-
- model-based analysis of genome-wide CRISPR/Cas9 knockout
-
- MCAK
-
- mitotic centromere-associated kinesin
-
- mCherry-sgCtrl
-
- cells labeled with mCherry and introduced with a non-targeting sgRNA
-
- mCherry-sgGSG2
-
- cells labeled with mCherry and introduced with a sgRNA targeting GSG2
-
- MINK1
-
- misshapen like kinase 1
-
- MOI
-
- multiplicity of infection
-
- MT
-
- microtubule
-
- NEK1
-
- NIMA related kinase 1
-
- NGS
-
- next-generation sequencing
-
- PCA
-
- principal component analysis
-
- PCM
-
- pericentriolar material
-
- pH3T3
-
- phosphorylated threonine 3 of histone H3
-
- QC
-
- quality control
-
- RB1
-
- retinoblastoma
-
- sgRNAs
-
- single guide RNAs
-
- TCGA
-
- The Cancer Genome Atlas
1 BACKGROUND
Aurora kinase A (Aurora-A, AURKA) plays a major role in centrosome duplication, maturation and separation, mitotic spindle establishment, chromosomal alignment, spindle assembly checkpoint, and cytokinesis [1]. We and others have shown that the overexpression of Aurora-A caused by gene amplification or epigenetic dysregulation is a common feature of breast cancer, the most common cancer diagnosed in women [2-5]. Moreover, high expression levels of Aurora-A in breast cancer are correlated with poor survival [3, 4]. Our team has also shown that the oncogenic functions of Aurora-A are mediated by its ability to promote cell proliferation, invasion, mesenchymal phenotype, stemness, and chemotherapy resistance [6-10]. Inhibition of Aurora-A can lead to abnormal spindle formation, mitotic defects, and cell death [1]. Thus, Aurora-A is widely believed to be a rational drug target in breast cancer.
As a consequence, several small-molecule kinase inhibitors of Aurora-A such as alisertib (MLN8237) [11], danusertib [12], and ENMD-2076 [13], have been developed. Among these Aurora-A inhibitors, MLN8237, a second-generation compound, is the most clinically advanced Aurora-A inhibitor that has been proved to improve the progression-free survival and duration of disease stability in various tumor types with manageable toxic effects [14-17]. MLN8237 binds to and inhibits Aurora-A kinase in cells with a 200-fold higher selectivity over Aurora-B kinase [18]. MLN8237 was the first oral selective Aurora-A kinase inhibitor to enter phase III clinical trials for patients with relapsed or refractory peripheral T-cell lymphoma (NCT01482962). However, this clinical trial was announced as a failure because MLN8237 could not prolong the survival of patients compared with existing commonly used single agents, such as pralatrexate, gemcitabine, and romidepsin [19]. In breast cancer, the objective response rate has been reported as 18% (9/49 subjects) with single-agent MLN8237 [15]. These findings suggest that further investigations on new treatment options, i.e. combination therapy, are necessary for MLN8237. Hitherto, the combination of drug targets and the molecular biomarkers for MLN8237 is largely uncharacterized.
In recent years, synthetic lethality has become a new concept for the development of antitumor therapies. With the advance of genome-wide clustered regularly interspaced short palindromic repeats (CRISPR)/Cas9 screening and analytic tools, high-throughput loss-of-function screens have been widely used to decipher novel synthetic lethal combination targets [20-23]. In combination therapy, the simultaneous inhibition of two synthetic lethal targets can generate high specificity and low toxicity [24]. It has been demonstrated that Aurora-A inhibition is synergistic with the loss of the tumor suppressor gene retinoblastoma (RB1) or the inhibition of checkpoint kinase 1 (CHEK1) [25, 26]. However, an unbiased screening of the synthetic lethal genes for Aurora-A inhibition can potentially accelerate the discovery of highly specific and potent combination drug targets.
In this study, we conducted a systematic screening using a CRISPR-Cas9 knockout library targeting 507 kinases to decipher MLN8237 synthetic lethal targets in breast cancer cells.
2 MATERIALS AND METHODS
2.1 Cell culture and compounds
HEK293T, MDA-MB-231, SKBR3, and MCF7 cell lines were obtained from the American Tissue Culture Collection (ATCC) (Manassas, VA, USA) and grown in Dulbecco's modified Eagle's medium (DMEM) nutrient mixture (Gibco, Grand Island, NY, USA) which was supplemented with 10% fetal bovine serum (FBS, Gibco). MLN8237 was purchased from Selleck Chemicals (Houston, TX, USA). CHR-6494 was purchased from MedChemExpress (Monmouth Junction, NJ, USA).
2.2 CRISPR library screening
We selected 507 kinases and designed 10 single guide RNA (sgRNA)s for each gene as shown in Supplementary Table S1. The oligo sgRNA sequences with flanking adaptors were synthesized by Synbio Technologies (Monmouth Junction, NJ, USA). The oligo pool was then amplified by polymerase chain reaction (PCR) using primers with homologous arms to the lenti-CRISPR V2 vector. The PCR product was subsequently inserted into the lenti-CRISPR V2 vector using the Gibson assembly according to the manufacturer's directions.
Lentiviral libraries were produced by co-transfecting 2 × 10⁶ HEK293T cells with 36 μg of CRISPR-kinome library plasmids, 12 μg of pMD2.G (Addgene, Watertown, MA, USA), and 24 μg of psPAX2 (Addgene) using 2 μg/mL polyethyleneimine (PEI, Sigma-Aldrich, St. Louis, MO, USA). Twelve hours later, fresh medium (DMEM) was added to the cells. Forty-eight hours later, viral supernatant was collected and filtered through a 0.22 μm Minisart® Syringe Filters (Sartorius, Otto-Brenner-Straße, Goettingen, Germany). Viral transduction was carried out using a multiplicity of infection (MOI) of 0.3 at 37°C for 24 hours. The cells were then trypsinized and transferred to 10 cm culture dishes containing growth media (DMEM) plus 2 μg/mL puromycin (MP Biomedicals, Santa Ana, CA, USA) to select successful transduction. After 7 days of selection, all remaining cells were successfully transduced and were divided into three parts. One part (>2 × 10⁶ cells) was collected directly. The other two parts (>2 × 10⁶ cells) were treated with dimethyl sulfoxide (DMSO) or MLN8237. The cells were passaged after reaching 90% confluence and were then collected for DNA extraction at a series of time points.
2.3 sgRNA sequencing and enrichment analysis
DNA was extracted from cells using the Tissue & Cell Culture DNA kit (Tiangen, Beijing, China). The sgRNA fragments were amplified through PCR using primers that were attached to Illumina sequencing recognition sites and barcodes. A total of 9 μg of the genomic DNA template was used per sample. For each sample, we performed 9 separate 100 μL reactions with 1 μg genomic DNA in each reaction using PrimeSTAR Max DNA Polymerase (Takara, Kusatsu, Japan) and then combined the resulting amplicons. Primer sequences used to amplify lentiCRISPR sgRNAs for PCR were as follows: forward, 5’-NNNNNNTCTTGTGGAAAGGACGAAACACCG-3’ (NNNNN: variable base sequence to introduce diversity); reverse, 5’-CCTAGCTAGCGAATTCAAAAAAGCAC-3’. The PCR product was loaded with 2% agarose and purified using the HiPure Gel Pure Micro Kit (Magen, Guangzhou, Guangdong, China). The purified PCR product was then sequenced on an Illumina HiSeq 2000 (Illumina, Inc., San Diego, CA, USA). The data were processed and analyzed with MAGeCK software (Wei Li lab, Washington, DC, USA).
2.4 Immunoblotting
Total proteins were extracted from cells using the RIPA buffer (50 mmol/L Tris pH7.4, 150 mmol/L NaCl, 1% Triton X-100, 1% Sodium deoxycholate, 0.1% SDS, 1 mmol/L PMSF) and were quantified by Bradford assay. Samples with 30 μg protein were separated using 10% TGX Stain-Free™ FastCast™ Acrylamide Kit (Bio-Rad, Hercules, CA, USA) and blotted to Immobilon® PVDF membranes (Merck Millipore, Bedford, MA, USA). The membranes were blocked in 5% skimmed milk in TBS-T (25 mmol/L Tris pH 7.5, 150 mmol/L NaCl, 0.05% Tween). Primary antibodies were added to the membranes at suggested concentrations in 5% skimmed milk and incubated overnight at 4°C. The membranes were then washed with TBS-T and incubated with secondary antibodies (Invitrogen, Waltham, MA, USA) diluted as 1:5000 for 1 hour at room temperature. They were then washed with TBS-T again and covered with Immobilon Western Chemiluminescent HRP Substrate (Millipore), followed by photographing for chemiluminescence using ChemiDoc MP Imaging System (Bio-Rad). The primary antibodies used were rabbit anti-phosphorylated AURKA/AURKB/AURKC (Cat#2914S), rabbit anti-AURKA (Cat#14475S), rabbit anti-H3 (Cat#4499S), rabbit anti-phosphorylated H3T3 (Cat#9849T) purchased from Cell Signaling Technologies (Boston, MA, USA), rabbit anti-AURKB (Cat#GTX132702) purchased from Genetex (Irvine, CA, USA), mouse anti-GAPDH (Cat#60004-1-Ig, Proteintech, Rosemont, IL, USA), rabbit anti-cyclin B (Cat#55004-1-AP, Proteintech, Rosemont, IL, USA).
2.5 Cell synchronization
Cells were synchronized at the G2/M boundary by treatment with thymidine-thymidine-Ro-3306. At first, the cells were treated with 2 mmol/L thymidine (MP Biomedicals, Santa Ana, CA, USA) for 14 hours, and then released to thymidine-free medium for 10 hours. Subsequently, the cells were treated with 2 mmol/L thymidine for 14 hours, and then released to thymidine-free medium for 2 hours. Finally, the cells were treated with 10 μmol/L Ro-3306 (MedChemExpress, Monmouth Junction, NJ, USA) for 16 hours. The medium was replaced with a Ro-3306-free medium to allow the cells to re-enter the cell cycle and progress through mitosis.
2.6 Establishment of CRISPR-edited cell lines
CRISPR-Cas9 plasmid (Lenti-V2, Addgene, Watertown, MA, USA) was digested with the endonuclease BsmBI (Thermo Fisher Scientific, Waltham, MA, USA). sgRNA oligos were designed according to the GeCKOv2 library [27] and Eric Lander library [28], and then cloned into the plasmid using T4 ligase (Thermo Fisher Scientific). Plasmids were introduced to 3 × 10⁵ cells using stable transfection mediated by lentivirus which were produced as described in the CRISPR library screening. Twenty-four hours later, the cells were cultured with DMEM plus 2 μg/mL puromycin (MP Biomedicals, Santa Ana, CA, USA) for at least one week. sgRNA sequence were as follows: GSG2 sgRNA1, 5’-CAGAAGTGCAGCACACCCTG-3’; GSG2 sgRNA2, 5’-GGTCCAGGGAGACTTCTGGG-3’; GSG2 sgRNA3, 5’-GGGAAGGGCGGAAGTCGGAG-3’.
2.7 Competitive growth assay
EGFP- and mCherry-expressing cells with candidate genes knocked out were counted and mixed together at a certain ratio. Before treating with drugs, EGFP, and mCherry intensities within each of the mixed cell populations were measured using the CytoFLEX Platform (Beckman Coulter, Inc., Brea, CA, USA). The cells were then treated with DMSO and 150 nmol/L MLN8237 for 8 days, after that, EGFP and mCherry intensities were measured again.
2.8 Flow cytometry
For apoptosis analyses, the cells were treated with candidate drugs for 72 hours. The attached cells were trypsinized and collected together with the supernatant. All the cells were washed twice with PBS and stained using the Annexin V-FITC Apoptosis Detection Kit (TransGen, Beijing, China). PI and FITC channels of CytoFLEX Platform (Beckman Coulter, Inc., Brea, CA, USA) were used to detect apoptosis in the samples. For cell cycle analysis, the cells were trypsinized and fixed with 70% alcohol overnight. A total of 1 × 10⁶ fixed cells per sample were washed with PBS and stained with 50 μg/mL propidium iodide, 100 μg/mL RNase A, 0.2% Triton X-100 in PBS solution. The cells were subsequently subjected to NovoCyte Flow Cytometer Systems (ACEA Biosciences, Inc., San Diego, CA, USA).
2.9 Colony formation assay
Cells were plated in each well of 6-well plates and treated with candidate drugs. The medium (DMEM) was renewed every 3 days. After one week, the cells were fixed using 4% paraformaldehyde for 15 min and stained with 1% crystal violet for 20 min at room temperature. Then, crystal violet was removed and the plates were washed several times in water. The plates were then photographed using the ChemiDoc MP Imaging System (Bio-Rad, Hercules, CA, USA).
2.10 Immunofluorescence microscopy
Cells plated on coverslips were fixed with 4% paraformaldehyde for 15 min and permeabilized in 0.5% Triton for 10 min at room temperature. The cells were then blocked with 3% bovine serum albumin (BSA) dissolved in PBS for 30 min and incubated with primary antibodies diluted at 1:200 with 3% BSA overnight. The cells were washed with PBS to remove the primary antibodies, followed by incubation with secondary antibodies diluted at 1:200 with 3% BSA for 1 hour. Immuno-stained samples were then incubated with 0.1 μg/mL 4', 6-diamidino-2-phenylindole (DAPI, Beyotime, Shanghai, China) diluted with PBS for 10 min. After washing with PBS, all immuno-stained samples were observed and captured using the LSM880 system (Zeiss, Oberkochen, Baden-Württemberg, Germany). The ZEN software (Zeiss) was used to process and analyze the images. Primary antibodies used were mouse anti-α-tubulin (Beyotime, Cat#AT819), rabbit anti-pericentrin (Cat#ab4448, Abcam, Cambridge, MA, USA), mouse anti-CENPA (Cat#GTX13939, Genetex, Irvine, CA, USA), rabbit anti-AURKB (Cat#GTX132702, Genetex, Irvine, CA, USA), rabbit anti-MCAK (Cat#12139-1-AP, Proteintech, Rosemont, IL, USA). Secondary antibodies used were Alexa Fluor 488, 546 (Invitrogen, Waltham, MA, USA).
2.11 Cold-stable microtubule assay
Cells were plated on coverslips in 6-well plates and arrested at the G2/M phase. The cells were then released to the indicated drugs for 40 min. After that, the cells were incubated on ice for 12 min and then incubated with Microtubule buffer (100 mmol/L Pipes pH 6.9 with KOH, 0.1 mmol/L CaCl2, 1 mmol/L MgCl2, 0.1% Triton X-100) for 30 s. Then, the cells were fixed using 4% of paraformaldehyde in Microtubule buffer for 25 min at room temperature, washed three times using PBS-T (PBS 1X + 0.1% Triton X-100 + 0.02% Sodium Azide), and incubated with PBST + 0.5% BSA for 1 hour at room temperature. Primary antibodies were incubated in PBST + 0.5% BSA overnight at 4°C. After washing, secondary antibodies were incubated in PBST + 0.5% BSA for 1 hour at room temperature. DAPI (Beyotime, Shanghai, China) was used to detect nuclear DNA as described in immunofluorescence.
2.12 Combination index calculation
MTT (3-[4, 5-dimethylthiazol-2-yl]-2, 5-diphenyl tetrazolium bromide) assays were performed to assess the inhibitory effect of each drug and the combinational treatment. The combination index was analyzed using the CompuSyn software (ComboSyn, Inc., Paramus, NJ, USA). Combination index of < 0.8, 0.8-1.2, and > 1.2 represented synergy, additivity, and antagonism, respectively [29].
2.13 Xenograft murine model
MDA-MB-231 cells (2 × 10⁶) were inoculated subcutaneously in the left and right flank of 4-week-old female nude mice (GemPharmatech, Nanjing, Jiangsu, China). Seven days later, the mice were randomly separated into four groups (6 mice per group) and treated with vehicle, MLN8237 (20 mg/kg in a final formulation in 10% 2-hydroxypropyl-β-cyclodextrin/1% sodium bicarbonate), CHR-6494 (20 mg/kg in a final formulation in 10% DMSO/20% 2-hydroxypropyl-β-cyclodextrin), or the combinational therapy for 15 consecutive days. MLN8237 and its control vehicle (100 μL of 10% 2-hydroxypropyl-β-cyclodextrin/1% sodium bicarbonate) were administered orally, while CHR-6494 and its control vehicle (100 μL of 10% DMSO/20% 2-hydroxypropyl-β-cyclodextrin) were administered by intraperitoneal injection. The length and width of each tumor were measured by calipers, and their volumes were calculated using the equation V = (length × width2) / 2. On day 21, the mice were euthanized, and the tumor xenografts were immediately dissected, weighed, stored, and fixed. All animal procedures were approved by the Institutional Animal Care and Use Committee of the Sun Yat-sen University Cancer Center (Guangzhou, China).
2.14 Statistical analysis
All the assays were independently repeated three times, and the results are presented as mean ± S.E.M, unless otherwise noted. All statistical calculations were performed using the SPSS 20.0 software (IBM, Armonk, NY, USA). For analysis between two groups, a Student's t-test was used, while for analyses among three or more groups, a one-way or two-way Analysis of Variance (ANOVA) with a post hoc test was used as indicated. For linear correlation analysis, the nonparametric Spearman's rank correlation was used. Statistical comparisons were made using the Chi-square test.
3 RESULTS
3.1 CRISPR/Cas9 screening identifies synergistic kinase targets related to MLN8237 sensitivity
Considering that kinases are the most promising targets for anticancer therapies, we performed a systematic screening of single-guide RNAs (sgRNAs) targeting 507 kinases (10 guides/kinase) (Supplementary Table S1) to identify genes whose depletion or inhibition could enhance the sensitivity to MLN8237 in breast cancer cells (Figure 1A). Briefly, the sgRNA-expressing input cells were treated with vehicle (dimethyl sulfoxide, DMSO) or MLN8237 (150 nmol/L, specifically to inhibit Aurora-A activity; Supplementary Figure S1A), and genomic DNA were extracted at day 3, 7, 12, and 14, respectively. The sgRNA cassettes were amplified from the genomic DNA and subsequently subjected to next-generation sequencing (NGS) to determine the abundance of each sgRNA.
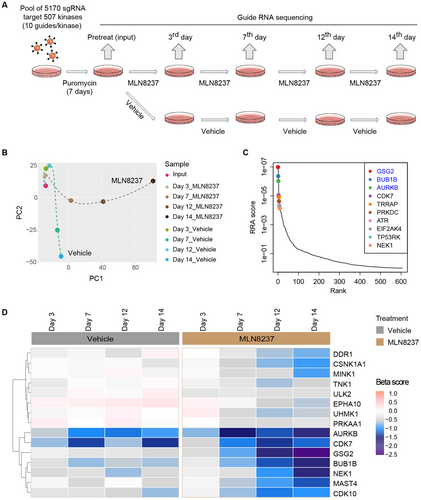
CRISPR/Cas9 screening to identify genes related to MLN8237 sensitivity. A. Schematic illustration for CRISPR/Cas9 screening to identify synergistic kinases with MLN8237 in MDA-MB-231 cells. B. The quality control of the CRISPR screening. Principal Component Analysis (PCA) plot was drawn to monitor the distribution and correlation of each group. C. Ranking of the genes whose sgRNAs were depleted in MLN8237-treated MDA-MB-231 cells for 14 days compared with the pretreatment groups. The top three genes on the list are in blue. D. Heatmap of sgRNA enrichment (β scores) in MDA-MB-231 cells of the MLN8237 and vehicle treatment groups. Abbreviations: PC1, Principal Component 1; PC2, Principal Component 2; RRA, robust ranking aggregation; GSG2, germ cell-specific gene 2; BUB1B, BUB1 mitotic checkpoint serine/threonine kinase B; NEK1, NIMA related kinase 1; DDR1, discoidin domain receptor tyrosine kinase 1; MINK1, misshapen like kinase 1; AURKB, aurora kinase B; CDK7, cyclin-dependent kinase 7; TRRAP, transformation/transcription domain associated protein; PRKDC, DNA-dependent protein kinase catalytic subunit; ATR, ATR serine/threonine kinase; TP53RK, TP53 regulating kinase; EIF2AK4, eukaryotic translation initiation factor 2 alpha kinase 4; TNK1, tyrosine kinase non-receptor 1; ULK2, Unc-51 like autophagy activating kinase 2; EPHA10, EPH receptor A10; UHMK1, U2AF homology motif kinase 1; PRKAA1, protein kinase AMP-activated catalytic subunit alpha 1; MAST4, microtubule-associated serine/threonine kinase family member 4; CDK10, Cyclin-Dependent Kinase 10; CSNK1A1, casein kinase 1 alpha 1
We applied the model-based analysis of genome-wide CRISPR/Cas9 knockout (MAGeCK) [30] to analyze the read counts of each sgRNA (Supplementary Table S2), and then applied MAGeCK-VISPR to call beta scores (β scores) to evaluate the positively and negatively selected genes relative to the input group. Quality control (QC) of the distribution of median-normalized read counts in each group (Supplementary Figure S1B), the sample clustering result (Supplementary Figure S1C), and the histogram of median-normalized read counts (Supplementary Figure S1D) in each group indicated that high-quality screening data were obtained. The Principal Component Analysis (PCA) presented two distinct evolutionary routes of the vehicle and MLN8237 treatment groups over time, suggesting a reasonable screening result (Figure 1B).
Next, we focused on the negatively selected genes to explore the potential synthetic lethal kinases interacting with MLN8237. The top negatively selected gene products on day 14, including germ cell-specific gene 2 (GSG2), BUB1 mitotic checkpoint serine/threonine kinase B (BUB1B), and aurora kinase B (AURKB), intensively located at centromeres (Figure 1C), suggested that centromere-related events were involved in the sensitivity of MLN8237.
To identify the gene targets that have relatively minor effects on the survival of breast cancer cells but could greatly enhance the killing effects of MLN8237, we generated a heatmap using the β scores of each group to present the selection process of these genes along with the MLN8237 or vehicle treatment. Specifically, the genes GSG2, BUB1B, NIMA related kinase 1 (NEK1), discoidin domain receptor tyrosine kinase 1 (DDR1), casein kinase 1 alpha 1 (GSNK1A1), and misshapen like kinase 1 (MINK1) displayed significantly different selection patterns in MLN8237 treatment groups versus the vehicle treatment groups over time (Figure 1D). Taken together, our unbiased CRISPR/Cas9 screening data suggested synthetic lethal interactions between the Aurora-A inhibitor MLN8237 and the genetic depletion of GSG2, BUB1B, NEK1, DDR1, GSNK1A1, and MINK1, respectively.
3.2 Genetic depletion of GSG2 marginally inhibits breast cancer cell growth but significantly sensitizes cells to MLN8237 killing
Among the identified candidate kinases, GSG2 showed the best differential selection patterns between the MLN8237 and vehicle treatment groups. The relative normalized counts at each time point in the MLN8237 and vehicle treatment groups were calculated (Figure 2A), and subsequent violin plots showed that the ratio of each sgRNA targeting GSG2 in the MLN8237 treatment groups, as compared to the vehicle treatment groups, significantly decreased with treatment time (Figure 2B).
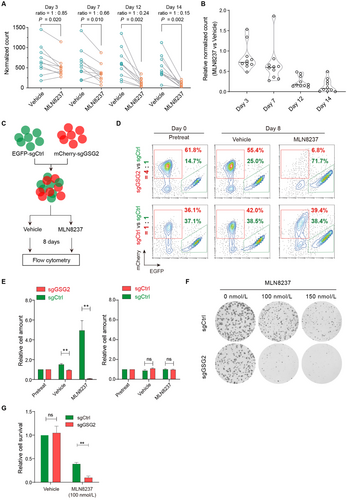
Genetic depletion of GSG2 sensitizes tumor cells to MLN8237. A. The normalized counts of sgRNA targeting GSG2 in MDA-MB-231 samples treated with DMSO and MLN8237 at days 3, 7, 12, and 14. The ratios of average normalized counts were calculated. Wilcoxon matched-pairs signed-rank test was performed. B. Violin plot shows the fold change of relative normalized sgRNA counts in MLN8237 and DMSO treatment groups. C. Diagram of in vitro competition assay. D. Ratio of cells with indicated genes knocked out before or after treatment with DMSO and MLN8237 for 8 days. E. Statistical result of in vitro competition assay. Two-tailed unpaired Students t-test was performed. n = 3 experiments; **P < 0.01; ns, not significant. F. Colony formation assays to examine cell clonogenicity in sgGSG2 cells and sgCtrl cells with MLN8237 treatment. G. Statistical result of colony formation assays. Two-tailed unpaired Students t-test was performed. **P < 0.01. Abbreviations: EGFP, enhanced green fluorescent protein; EGFP-sgCtrl, cells labeled with EGFP and introduced with a non-targeting sgRNA; mCherry-sgGSG2, cells labeled with mCherry and introduced with a sgRNA targeting GSG2; sgCtrl, cells introduced with a non-targeting sgRNA; sgGSG2, cells introduced with a sgRNA targeting GSG2
To validate the synthetic lethal interaction of GSG2 and MLN8237 in breast cancer, we performed in vitro competition assay. Briefly, we mixed the EGFP-sgCtrl (cells labeled with enhanced green fluorescent protein [EGFP] and introduced with a non-targeting sgRNA) and mCherry-sgCtrl (cells labeled with mCherry and introduced with a non-targeting sgRNA) cells in a 1:1 ratio or the EGFP-sgCtrl and mCherry-sgGSG2 (cells labeled with mCherry and introduced with a sgRNA targeting GSG2) cells in a 1:4 ratio and monitored the effects of different cell proportions during the 8-day treatment (Figure 2C). The results showed that the competitiveness of mCherry-labeled and EGFP-labeled cells, both with control sgRNA, were nearly equally matched (Figure 2D and E, 36.1% vs. 37.1% in the pretreatment group at day 0, and 42.0% vs. 38.5% in the vehicle treatment group, and 39.4% vs. 38.4% in the MLN8237 [150 nmol/L] treatment group at day 8). The percentage of cells with GSG2 knockout decreased marginally following DMSO treatment (61.8% vs. 14.7% in the pretreatment group at day 0, and 55.4% vs. 25.0% in the vehicle treatment group at day 8), while the proportion of GSG2-knockout cells decreased significantly following MLN8237 treatment (6.8% vs. 71.7% in the MLN8237 treatment group at day 8). To avoid the off-target effect, we further used another two sgRNAs targeting GSG2 to repeat the competition assays and obtained similar results (Supplementary Figure S2).
Next, we performed colony formation assays to confirm the synthetic lethal effects of GSG2 depletion using MLN8237. As expected, GSG2 gene knockout marginally reduced the colony formation of MDA-MB-231 cells but significantly inhibited the colony formation of MLN8237-treated cells (Figure 2F and G). Collectively, these results demonstrated that the genetic depletion of GSG2 marginally inhibited breast cancer cell growth but significantly sensitized breast cancer cells to MLN8237 killing.
3.3 CHR-6494 potentiates the killing efficacy of MLN8237 on breast cancer cells
GSG2 encodes the human Haspin kinase which is required for the recruitment of chromosomal passenger complex (CPC) to the centromere [31-33]. CHR-6494 is a potent and selective Haspin inhibitor [34]. Thus, we selected CHR-6494 to further evaluate its synergistic therapeutic effects with the Aurora-A inhibitor MLN8237.
Colony formation assays showed that the single-agent CHR-6494 (50-200 nmol/L) had almost no effects on the clonogenicity of MDA-MB-231, SKBR3, and MCF7 breast cancer cells, whereas the same doses significantly enhanced the antiproliferative effects of MLN8237 (Figure 3A and Supplementary Figure S3A). Annexin V assays demonstrated that CHR-6494 as a single agent (200 nmol/L) failed to trigger the apoptosis of MDA-MB-231 and SKBR3 cells, whereas the same dose significantly enhanced the apoptosis of these cells when combined with MLN8237 treatment (200 nmol/L in MDA-MB-231 cells, 70 nmol/L in SKBR3 cells) (Figure 3B and C).
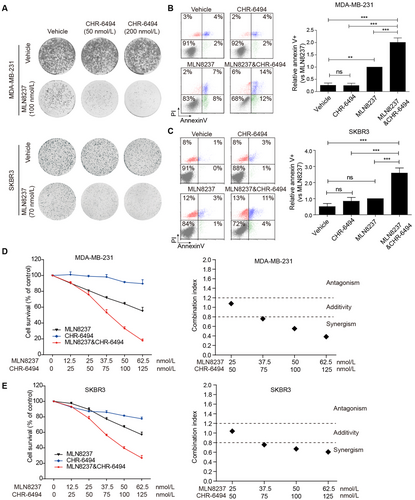
CHR-6494 potentiates the killing efficacy of MLN8237 on breast cancer cells. A. Colony formation assay shows the effects of CHR-6494 on MLN8237 sensitivity in MDA-MB-231 and SKBR3 cells. B and C. Relative apoptosis of MDA-MB-231 and SKBR3 cells treated with indicated drugs for 72 hours. The concentrations of MLN8237 were 200 nmol/L in MDA-MB-231 cells and 70 nmol/L in SKBR3 cells. The concentrations of CHR-6494 were 200 nmol/L in both cells. One-way ANOVA and LSD tests were used to evaluate the difference between groups. ns, not significant; n = 3 independent experiments; **P < 0. 01, ***P < 0.001. D and E. MDA-MB-231 and SKBR3 cells were treated with the indicated doses of MLN8237 and CHR-6494 for 96 hours, followed by MTT assay to determine the growth-inhibitory effects. n = 3 independent experiments. The combination index was analyzed with the CompuSyn software. Abbreviations: PI, Propidium iodide
We further evaluated the combination index of CHR-6494 and MLN8237 in MDA-MB-231, SKBR3, and MCF7 cells. Cell viability assay showed that combinational treatment resulted in more potent growth inhibition of these cells than individual drugs (Figure 3D, E, and Supplementary Figure S3B, left panel). These data were then subjected to combination index calculation, with combination index of less than 0.8, between 0.8 and 1.2, and more than 1.2 representing synergy, additivity, and antagonism, respectively. As shown in Figure 3D, E, and Supplementary Figure S3B, in the right panel, the result revealed that CHR-6494 and MLN8237 acted synergistically to inhibit the proliferation of these cells.
Considering that CHR-6494 is insufficiently characterized to be used solely as a Haspin-selective inhibitor, we confirmed the synthetic lethality of MLN8237 and Haspin inhibition using an alternative Haspin inhibitor 5-iodotubercidin. As shown in Supplementary Figure S3C and D, 5-iodotubercidin also showed synergistic effects with MLN8237.
3.4 Synergistic inhibition of Aurora-A and Haspin attenuates kinetochore-microtubule attachment
To explore the mechanism of synthetic lethal effects, we first performed immunofluorescence analysis to examine the spindle morphology of the breast cancer cells by staining for tubulin, pericentrin, and 4', 6-diamidino-2-phenylindole (DAPI). The representative morphologies of monopolar, bipolar, multipolar spindles, and small asters are shown in Figure 4A. The statistical results demonstrated that the combined treatment (200 nmol/L MLN8237 plus 200 nmol/L CHR-6494) resulted in over 60% of cells displaying small asters while MLN8237 alone only led to less than 20% of cells displaying small asters (Figure 4B). Considering the important role of Aurora-A in centrosome function, we explored whether the co-inhibition of Haspin and Aurora-A synergistically disrupted the maturation and separation of centrosomes. The results showed that, compared with inhibiting Aurora-A alone, the co-inhibition of Haspin and Aurora-A did not reduce the distance between centrosomes and the size of pericentriolar material (PCM) (Figure 4C).
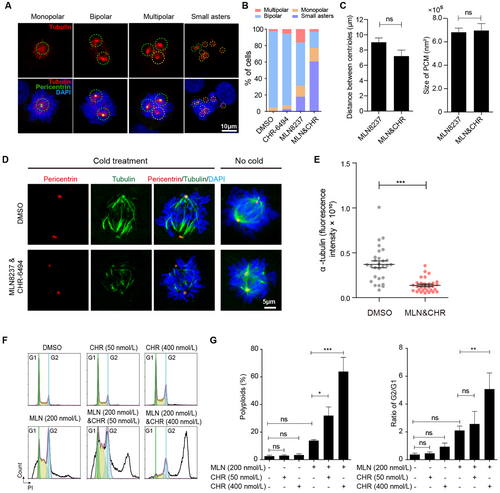
Synergistic inhibition of Aurora-A and Haspin attenuates kinetochore-microtubule attachment. A. Representative immunofluorescent images show the morphology of monopolar, bipolar, multipolar spindles, and small asters. B. Percentage of each kind of spindles with indicated treatments in MDA-MB-231 cells (≥ 60 cells per condition). C. The distance between centrioles and the size of pericentriolar material (PCM) measured in the MLN8237 treatment group or co-treatment group (≥ 60 cells per condition). D. Immunofluorescence shows the tubulin intensity in cold-stable microtubule assay after releasing MDA-MB-231 cells from G2/M synchronization to indicated drugs for 30 min. The concentrations of MLN8237 and CHR-6494 were 200 nmol/L, respectively. E. The intensity of tubulin in cold-stable microtubule assay was analyzed. Two-tailed unpaired Student t-test were performed (≥ 28 cells per condition). ***P < 0.001. F. Cell cycle analysis of MDA-MB-231 cells treated with indicated drugs for 48 hours. G. Percentage of polyploids and ratio of G2/G1 in MDA-MB-231 cells treated with indicated drugs for 48 hours. n = 3 independent experiments; ns, not significant; *P < 0.05; **P < 0.01; ***P < 0.001. Abbreviations: MLN, MLN8237; CHR, CHR-6494
The formation of small asters raised the possibility that the co-inhibition of Aurora-A and Haspin disrupts the kinetochore-microtubule (KT-MT) attachments. To validate this hypothesis, we tested the KT-MT attachment using cold-stable microtubule assay, which is used to induce depolymerization of most spindle microtubules, with the exception of the kinetochore fibers (K-fibers) [35]. Indeed, the co-treatment cells displayed significantly lower α-tubulin intensity, indicating attenuated kinetochore-microtubule attachments (Figure 4D and E).
Next, we performed flow cytometry to analyze the cell cycle of these cells. After 48 hours, CHR-6494 treatment (50 nmol/L and 400 nmol/L in MDA-MB-231 cells, 50 nmol/L and 200 nmol/L in SKBR3 cells) had little effect on the ratio of G2/G1 and population of polyploids when used alone but increased significantly when administered together with MLN8237 (Figure 4F, G, and Supplementary Figure S4). The increase in polyploidy is an outcome of transient mitotic arrest, and extends mitotic duration (ExMD) can induce mitotic slippage and re-replication of DNA [36-38]. These data indicated that the attenuated KT-MT attachment and the increased formation of small aster induced by co-inhibition of Aurora-A and Haspin would cause severe mitotic arrest.
3.5 Synergistic inhibition of Aurora-A and Haspin disrupts the mitotic centromere aggregation of Aurora-B and MCAK
Previous studies have reported that activated Haspin phosphorylated threonine 3 of histone H3 (pH3T3) recruited CPC to centromeres, which regulated microtubule attachments via Aurora-B activity [31, 33]. On one hand, Aurora-B destabilized erroneous KT-MT attachments by phosphorylating the kinetochore null protein 1 (KNL1) -missegregation 12 (Mis12) complex-nuclear division cycle 80 (Ndc80) complex (KMN network), especially Ndc80. On the other hand, Aurora-B recruited microtubule-destabilizing proteins, such as mitotic centromere-associated kinesin (MCAK) and stathmin 1 (STMN1), to the centromere and inactivated them to stabilize the microtubules around the kinetochore, thus, promoting KT-MT attachments [39-42].
Next, we investigated the activity and localization of Aurora-B. The results of Western blotting demonstrated that the activity of Aurora-B decreased by about 30% with the combined inhibition (200 nmol/L MLN8237 plus 200 nmol/L CHR-6494) (Figure 5A). The results of immunofluorescence assays demonstrated that over 90% of cells showed that Aurora-B was located on the chromosome arms instead of the inner centromere with combined treatment of MLN8237 and CHR-6494 (Figure 5B and C). Meanwhile, MCAK was almost absent from the centromere of co-treatment cells (Figure 5D and E). These results showed that inhibitors for Aurora-A and Haspin functioned synergistically, leading to the dispersion of Aurora-B and MCAK, which may explain the depolymerization of microtubule plus ends and the formation of small asters.
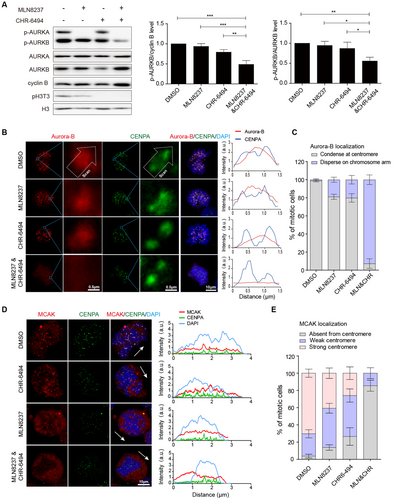
Synergistic inhibition of Aurora-A and Haspin disrupts the mitotic centromere aggregation of Aurora-B and MCAK. A. The kinase activity of Aurora-A and Aurora-B was examined using Western blotting assays after releasing MDA-MB-231 cells from G2/M synchronization to indicated drugs for 30 min. The concentrations of MLN8237 and CHR-6494 were 200 nmol/L. The repeated-measures ANOVA, followed by the least significant difference test was used to evaluate the difference between groups. n = 3 independent experiments; ns, not significant; *P < 0.05; **P < 0.01. B. Left panel, immunofluorescence shows the location of Aurora-B and CENPA. Right panel, the fluorescence intensity of Aurora-B and CENPA was measured. C. The localization of Aurora-B at centromere was analyzed (n = 3 independent experiments; ≥ 60 cells per condition). D. Immunofluorescence shows the location of MCAK. The arrows represent the direction of the line scan of fluorescence intensity for the entire cell. E. The localization of MCAK at the centromere was analyzed. “Strong” means that more than 50% of the centromeres show MCAK localization, while “weak” indicates that less than 50% of the centromeres show MCAK localization (n = 3 independent experiments; ≥ 123 cells per condition) Abbreviations: MLN, MLN8237; CHR, CHR-6494; DAPI, 4', 6-diamidino-2-phenylindole
3.6 Combined inhibition of Aurora-A and Haspin synergistically regresses breast tumors in vivo
We evaluated the in vivo antitumor effects of the combination of Haspin inhibitor CHR-6494 and Aurora-A inhibitor MLN8237 in a xenograft model. Nude mice bearing MDA-MB-231 xenograft tumors were subjected to the vehicle, MLN8237 (20 mg/kg), CHR-6494 (20 mg/kg), or the combination treatment for 15 consecutive days. The tumor volume and weight in the combinational treatment group were significantly lower than those in the single drug groups and the control group (P < 0.01, Figure 6A-C). The body weight of the mice showed no significant differences between the distinct groups (Figure 6D).
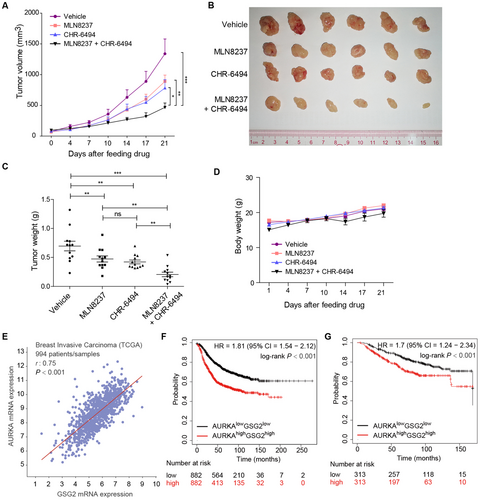
Combined inhibition of Aurora-A and Haspin synergistically regresses breast tumors in vivo. A. Nude mice bearing MDA-MB-231 xenograft tumors were treated with MLN8237 and CHR-6494 alone or in combination. The measured tumor volume from days 0 to 21 after treatment is plotted versus time. The repeated-measures ANOVA, followed by the least significant difference test were used to evaluate the difference between groups, n = 12; *P < 0.05; **P < 0.01; ***P < 0.001. B. Tumors removed from 6 mice in each group are shown. C. Statistical analysis of the weights of dissected tumors. The ANOVA test, followed by the least significant difference test, was used to evaluate the difference between groups, n = 12; ns, not significant; **P < 0.01; ***P < 0.001. D. The body weights of mice were measured and plotted against time, n = 6. E. Expression of AURKA and GSG2 in 994 breast cancer patient samples from the TCGA Pan-Cancer Atlas. Pearson's correlation and linear regression analyses were employed. F and G. Relapse-free survival and overall survival for AURKA/GSG2 transcription levels in breast cancer patients using the Kaplan–Meier plotter online tool. Abbreviations: HR, Hazard Ratio; TCGA, The Cancer Genome Atlas; 95% CI, 95% Confidence Interval
Next, we studied the expression of GSG2 and AURKA in primary human breast cancer samples. We analyzed the correlations between GSG2 and AURKA mRNA levels in a TCGA (The Cancer Genome Atlas) cohort of invasive breast carcinoma, consisting of 994 breast cancer patient samples using the cBioPortal database [43]. Pearson's correlation analysis indicated a strong positive correlation between the expression levels of GSG2 and AURKA mRNA (r = 0.75, P < 0.001, Figure 6E).
Finally, we analyzed the prognostic values of GSG2 and AURKA in primary human breast cancer samples using the Kaplan–Meier plotter database [44]. As shown in Figure 6F and G, the population with both high expression of GSG2 and AURKA was significantly associated with short relapse-free survival in 1764 breast cancer patients (HR = 1.81, log-rank P < 0.001) and short overall survival in 626 breast cancer patients (HR = 1.7, log-rank P < 0.001).
4 DISCUSSION
With the advance of the concept of synthetic lethality, we performed an unbiased CRISPR/Cas9 screening and uncovered the synthetic lethal interactions between the Aurora-A inhibitor, MLN8237, and several kinases including Haspin. We further demonstrated that the Haspin inhibitor, CHR-6494, was a promising inhibitor in combination with MLN8237 both in vitro and in vivo. Our results and previous studies have led us to propose a model in which upon Aurora-A inhibition, Haspin phosphorylates H3T3 and recruits Aurora-B to centromeres to deactivate MCAK and prevent microtubule depolymerization to guarantee KT-MT attachment success. Once Aurora-A and Haspin are co-inhibited, MCAK will be activated prematurely and dissociate from centromeres, resulting in aberrant microtubule depolymerization and KT-MT failure; leading to severe mitotic catastrophe and cell death (Figure 7).
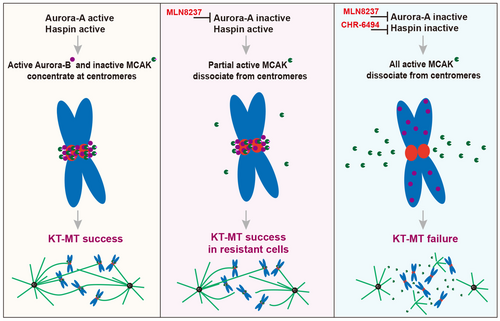
Graphic depiction of the molecular mechanism of a synthetic lethal interaction between Aurora-A inhibition and Haspin inhibition. Left panel, the activated Haspin recruits Aurora-B and MCAK to centromeres. Both Aurora-A and Aurora-B phosphorylate and deactivate MCAK to prevent microtubule depolymerization. Middle panel, when Aurora-A is inactivated, Haspin-Aurora-B still phosphorylates and deactivates most MCAK to guarantee KT-MT success in MLN8237-resistant cells. Right panel, when Aurora-A and Haspin are co-inhibited, MCAK is activated completely, resulting in excessive microtubule depolymerization, leading to severe mitotic catastrophe and cell death. Abbreviations: KT-MT, kinetochore-microtubule attachment
Except for the centrosome-related functions, Aurora-A is also involved in centromere-associated functions and microtubule-mediated microtubule nucleation [45-50]. Reports have shown that both Aurora-A and Aurora-B can phosphorylate MCAK at S196 to inhibit its microtubule depolymerization activity [51, 52]. In addition, Aurora-A has also been reported to phosphorylate and activate Haspin to facilitate H3T3 phosphorylation, thus recruiting Aurora-B to the centromere [53]. These studies can explain the synthetic lethal interactions between Aurora-A and Haspin inhibitors.
Our results showed that CHR-6494 had moderate effects on cell growth but significantly reduced tumor burden in vivo. The different phenotypes of CHR-6494 in vitro and in vivo are unclear and warrant further investigation. In addition to CHR-6494, other compounds such as 5-iodotubercidin [54-56], LDN-192960 [57], LDN-211898 [58], and CX-6258 [59] have also been reported to inhibit the kinase activity of Haspin with comparable selectivity. We believe that more efforts should be made to screen for more potent and selective Haspin inhibitors in future studies.
Further, in agreement with our finding, a very recent study using CRISPR/Cas9 screening also identified a synthetic lethal interaction between Haspin inhibition and the pan-Aurora (A and B) kinase inhibitor VX680 in HCT116 colon carcinoma cells [60]. However, at odds with our finding, the authors found that the pan-Aurora (A and B) inhibitor VX-680 played a synthetic lethal role by targeting Aurora-B, but not Aurora-A. In the present study, to confirm the synthetic lethal interaction between Aurora-A and Haspin inhibition, we used MLN8237, a highly specific Aurora-A inhibitor, at relatively low concentrations (150-200 nmol/L) to guarantee that Aurora-B kinase would not be affected and remained active. Subsequently, we uncovered a bona fide synthetic lethal interaction between Haspin and Aurora-A in breast cancer and elucidated the mechanism involved.
It is widely known that the cellular Aurora-A locates predominantly at the centrosome, which alludes to a key role of Aurora-A at the centrosome. Indeed, inhibition of Aurora-A induces abnormal mitotic spindle formation (e.g., monopolar and multipolar spindles). However, we also observed that the formation of multipolar spindles induced by Aurora-A inhibition led to the production of aneuploidy, where cancer cells could continue to proliferate rather than undergo cell death. Notably, our data showed that the loss of Aurora-A at the centromere could be functionally compensated by Aurora-B, and this overlapping role between Aurora-A and -B adversely affected the anticancer efficacy of Aurora-A inhibitors. Unfortunately, all the clinical trials of VX-680, a highly potent inhibitor that simultaneously targets Aurora-A, -B, and -C, had been terminated immaturely due to its off-target side effects of cardiac repolarization (i.e., QT prolongation) [1]. Nevertheless, our findings provide a rationale for examining further combinations of Haspin inhibitors with MLN8237 in order to target Aurora-A and -B pathways simultaneously in clinical trials.
5 CONCLUSIONS
Haspin (GSG2) depletion or inhibition sensitizes breast cancer cells to MLN8237, a promising Aurora-A inhibitor, by synergistically abolishing the recruitment of Aurora-B and MCAK to centromeres and inducing excessive microtubule depolymerization. Simultaneous inhibition of Haspin and Aurora-A is an alternative strategy for breast cancer treatment.
DECLARATIONS
AUTHOR CONTRIBUTIONS
QL, ALC, and ZFW contributed to the conception and design of the study proposal. ALC, ZFW, SJW, FL, ZJZ, MLL, YZW, BH, MY, and TBK contributed to the methodology. ZFW and ALC performed data analysis. ZFW, ALC, QL, and EW-FL wrote and revised the manuscript. ZFW and QL supervised the research process.
ETHICS APPROVAL AND CONSENT TO PARTICIPATE
All institutional and national guidelines for the care and use of laboratory animals were followed.
CONSENT FOR PUBLICATION
Not applicable.
CONFLICT OF INTEREST STATEMENT
The authors declare that they have no conflict of interests.
ACKNOWLEDGMENTS
The authors would like to thank Quentin Liu's lab members for their critical comments and technical support. This research work was supported by the National Key R&D Program of China (2019YFA0110300 and 2017YFA0505600-04 to QL), the National Natural Science Foundation of China (81820108024 and 81630005 to QL, 81773166 to ZFW), the Innovative Research Team at the University of Ministry of Education of China (IRT-17R15 to QL), the Natural Science Foundation of Guangdong (2016A030311038 and 2017A030313608 to QL, 2017A020215098 to ZFW), and the Science and Technology Planning Project of Guangzhou (201804020044 to QL).
Open Research
DATA AVAILABILITY STATEMENT
Not applicable


