The potential for facial artery injury during mandibular third molar extraction. An anatomical study using contrast-enhanced computed tomography
Abstract
The purpose of this study was to evaluate the risk of injury to the facial (FA) and related arteries during mandibular third molar (MTM) extraction using contrast-enhanced computed tomography (CE-CT). CE-CT images of the MTM region were retrospectively reviewed. The area of the MTM was equally divided into three zones in the coronal images from mesial to distal, that is, zone 1, zone 2, and zone 3. The FA, submental artery (SMA), and sublingual artery (SLA) were identified. The distance from the mandible to FA, SMA, and SLA and the diameter of the FA, SMA, and SLA was measured in three zones, respectively. The thickness of the facial soft tissues and width of the mandible were measured at their maximum. The mean distance from the FA to the buccal cortical bone in zone 1, zone 2 and zone 3 was 2.24 mm, 2.39 mm and 1.67 mm, respectively. The SMA and SLA were found to be distal to the mandible. The mean diameter of the FA was 1.26 mm in males and 1.04 mm in females, respectively (p < 0.0001). The distance between the FA and buccal cortical bone of the mandible, and the patients' weight showed moderate correlation in zones 1 and 2. Based on our findings, the FA can be damaged if the surgical invasion reaches the facial soft tissues during MTM surgery. The patients' weight might be a good predictor for FA injury when CE-CT is not available.
1 INTRODUCTION
Surgical complications of the mandibular third molar (MTM) extraction have been well described. When the mandibular canal is surgically invaded, the inferior alveolar nerve (IAN) and vessels are at a risk of injury. IAN injury is one of the most severe complications and causes neurosensory disturbance of the lower lip and lower buccal (labial) gingiva of the incisors to premolars (Bailey et al., 2020; Cheung et al., 2010). Lingual nerve (LN) injury is another serious complication by which patients could lose their general sensation and gustatory perception of the anterior two-thirds of the tongue (Standring, 2020). Anatomical studies have shown the course of the LN by various methods, for example, measuring distance from lingual cortical plate, showing LN movement based on the tongue position, and dissecting branching patterns (Behnia et al., 2000; Cheung et al., 2010; Iwanaga, 2017; Iwanaga, Cleveland, et al., 2020; Shimotakahara et al., 2019).
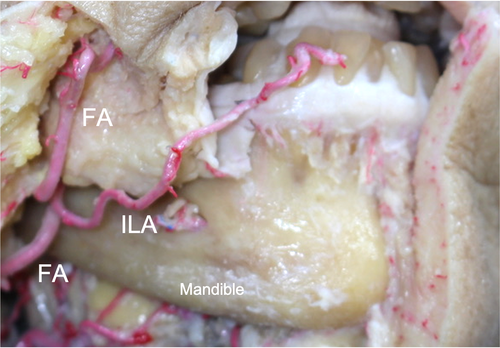
While iatrogenic injury of the vessels is also an undesirable complication of MTM extraction, injury to the mandibular canal can cause inferior alveolar vessel damage and result in hemorrhage. It is well known that the facial artery (FA) runs in close proximity to the mandible (Figure 1). One study using intraoral dissection of fresh-frozen cadavers showed the FA could be damaged by periosteal releasing incisions to the lower buccal mucosa, especially when the operator does not use a magnified surgical view (Iwanaga, Kato, et al., 2021; Iwanaga, Shiromoto, & Tubbs, 2020). In addition, some have reported pseudoaneurysms of the FA after MTM extraction that were treated by endovascular embolization (Marco de Lucas et al., 2008; Pukenas et al., 2012). Thus, the FA might be at a risk of injury by MTM extraction procedures. Most anatomical studies of the FA are based on extraoral dissection of the cadaver and/or computed tomography (CT) angiography studies and show the course and variation of the FA (Cong et al., 2021; Herrera-Núñez et al., 2020; Lee et al., 2020; Wu et al., 2019). A critical understanding of FA anatomy for dentists and oral surgeons is via an intraoral view of the FA and interpretation of the FA on imaging which has not been shown in previous studies. To provide a better anatomical insight that could potentially reduce iatrogenic injury of the FA during MTM surgery, we investigated the anatomical relationship between the FA and related arteries and the MTM using contrast-enhanced CT (CE-CT).
2 MATERIALS AND METHODS
2.1 Study subjects
We retrospectively reviewed the MTM using CE-CT images of the oral and maxillofacial regions in patients who were referred to our institution from January 2016 to September 2020.
- A MTM with or without caries
- The outline of the tooth is traceable
- The ipsilateral second molar is present
- Any major pathology, for example, tumor, cyst, or infection on the ipsilateral side
- A MTM with a fourth molar on the ipsilateral side
- Large caries/defects which makes tracing the outline of the tooth difficult
2.2 Image preparation and zoning
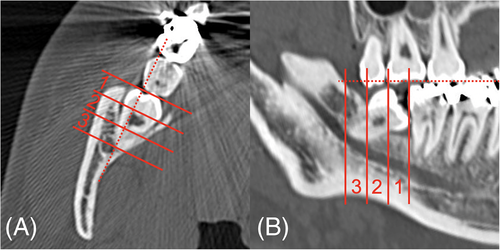
CE-CT images were taken with four types of CT (Aquilion ONE: Canon Medical Systems Corporation, Tochigi, Japan; Aquilion Precision: Canon Medical Systems Corporation; Discovery CT750 HD: GE Healthcare, Milwaukee, WI, USA; SOMATOM Definition Flash: Siemens AG, Munich, Germany). CT images were obtained with the following parameters: field of view: 24 × 24 cm; tube voltage: 120 kV; tube current: 114–300 mA. Axial images were slightly rotated so that the occlusal plane was used as the horizontal plane, then the coronal images of the molar region perpendicular to the horizontal plane were reconstructed and used for evaluation. The area from the distal surface of the second molar to the distal edge of the MTM was equally divided into three zones from mesial to distal, that is, zone 1, zone 2, and zone 3, to see if there was any difference for the risk of arterial injury in each zone, as mesially-angulated MTMs are often removed by sectioning the tooth close to its cervical area or more mesial/superior part of the tooth, these defined 3 zones simulated clinical practice. (Figure 2). The reconstructed images were exported as bone windows to study the outline of the MTM.
2.3 Identification of arteries
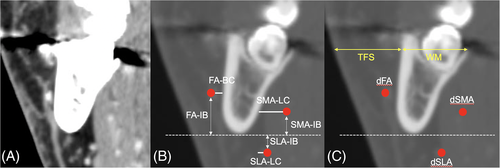
Before measurements, the FA, submental artery (SMA), and sublingual artery (SLA) were identified using CT images with the soft tissue in the same coronal section as the images in the bone windows (Figure 3A). Subsequently, the measurements were performed using bone windows to avoid the partial volume effect.
2.4 Measurements
2.4.1 Distance
When the cortical bone is perforated from inside by the surgical burr during MTM surgery, it would be better to know if both the horizontal and vertical distances from the cortical bone (not from the MTM) to each artery is close or not. Also the distance from bony landmarks is more stable than that of the MTMs. For these reasons, bony landmarks were used for the measurements instead of the teeth.
The horizontal distance between medial margin of the FA and buccal cortical bone (FA-BC), vertical distance between inferior margin of the FA and inferior border of the mandible (FA-IB), horizontal distance between lateral margin of the SMA and lingual cortical bone (SMA-LC), vertical distance between inferior margin of the SMA and inferior border of the mandible (SMA-IB), horizontal distance between the lateral margin of the SLA and lingual cortical bone (SLA-LC), vertical distance between the superior margin of the SLA and inferior border of the mandible (SLA-IB) were measured in three zones (Figure 3B).
2.4.2 Diameter, thickness, and width
The diameter of the FA (dFA), diameter of the SMA (dSMA), and diameter of the SLA (dSLA) were measured in three zones. When multiple arterial branches were identified in the same area, the largest one was chosen, and the maximum external diameter was measured. The thickness of the facial soft tissue (TFS) and width of the mandible (WM) were measured at their maximum in any zone (Figure 3C).
One oral and maxillofacial radiologist reconstructed the CE-CT images and performed all of the measurements. Measurements were performed twice over a one-month interval.
2.5 Statistical analysis
Intraobserver agreement between first and second measurements was evaluated using Kappa values and classified into five grades: poor agreement (<0.20); fair agreement (0.21–0.40); moderate agreement (0.41–0.60); good agreement (0.61–0.80); excellent agreement (0.81–1.00). The significance of differences among measurements was analyzed using the Shapiro–Wilk test and the Kruskal-Wallis test, and the Mann–Whitney U test using SPSS (version 27, IBM, NY, USA). Values of p < 0.05 were considered statistically significant.
The present study protocol was approved by the Okayama University Ethics Committee (approval No. 2012–003) and the study was performed in accordance with the requirements of the Declaration of Helsinki (64th WMA General Assembly, Fortaleza, Brazil, October 2013).
3 RESULTS
One hundred and ten MTMs from 96 Japanese patients were evaluated (Table 1). The mean age was 47.1 years (range 19–86 years). The mean height and weight in males were 169.6 cm (range 157.1–185.0 cm) and 65.4 kg (range 46.0–95.0 kg), respectively, and 158.0 cm (range 142.0–170.0 cm) and 54.7 kg (range 32.6–87.8 kg) in females, respectively. The FA was observed on 109 sides (109/110: 99.1%, 56 sides in 52 males and 53 sides in 43 females), the SMA was observed on 104 sides (104/110: 94.5%, 56 sides in 52 males and 48 sides in 40 females), and the SLA was observed on 99 sides (99/110: 90.0%, 52 sides in 49 males and 47 sides in 38 females).
| No. of patient | No. of MTM | Unilateral | Right | Left | Bilateral | |
|---|---|---|---|---|---|---|
| Male | 53 | 57 | 49 | 28 | 21 | 4 |
| Female | 43 | 53 | 33 | 23 | 10 | 10 |
| Total | 96 | 110 | 82 | 51 | 31 | 14 |
- Abbreviation: MTM, mandibular third molar.
3.1 Kappa values agreement
The Kappa values of FA-BC, FA-IB, SMA-LC, SMA-IB, SLA-LC, and SLA-IB in the three zones ranged from 0.546 to 0.592, 0.587 to 0.673, 0.512 to 0.563, 0.558 to 0.650, 0.573 to 0.653, and 0.527 to 0.634, respectively. The Kappa values of dFA, dSMA, and dSLA were 0.291, 0.250, and 0.198, respectively. The Kappa values of TFS and WM were 0.710 and 0.624, respectively. All Kappa values showed that intraobserver agreement was moderate to good except for the diameter of the three arteries. The results of the second evaluation were used for subsequent analysis.
3.2 Distance to FA
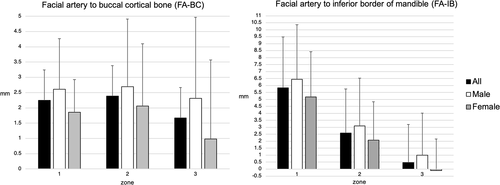
The FA-BC ranged from 0 to 8.49 mm, −8.02 to 8.83 mm, −9.46 to 11.11 mm in zones 1, 2, and 3, respectively. The mean FA-BC of zone 1, zone 2 and zone 3 was 2.24 mm, 2.39 mm and 1.67 mm, respectively (males: 2.61 mm, 2.70 mm and 2.32 mm, and females: 1.86 mm, 2.06 mm and 0.98 mm). FA-BC was the largest in zone 2 and smallest in zone 3 in both sexes. Males tended to have longer FA-BC in all zones. There was significant difference between zone 2 and zone 3 in females (p = 0.003, Shapiro–Wilk test and Kruskal-Wallis test).
FA-IB ranged from −2.63 to 17.53 mm, −3.74 to 13.68 mm, −4.93 to 8.26 mm in zone 1, 2, and 3, respectively.
The mean FA-IB of zone 1, zone 2 and zone 3 was 5.83 mm, 2.60 mm and 0.48 mm, respectively (6.45 mm, 3.10 mm and 1.00 mm in male and 5.18 mm, 2.07 mm and − 0.10 mm in female). FA-IB was the largest in zone 1 and smallest in zone 3. In zone 3, the mean FA-IB in females was <0 mm. Males tended to have longer FA-IB in all zones. There was significant difference between the sexes in all zones (p < 0.005, Shapiro–Wilk test and Kruskal-Wallis test) (Figure 4).
3.3 Distance to SMA
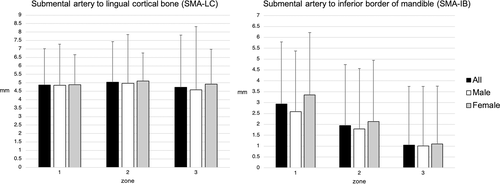
The mean SMA-LC of zone 1, zone 2, and zone 3 was 4.87 mm, 5.03 mm, and 4.74 mm (4.86, 4.97, and 4.59 mm in males and 4.89, 5.11, and 4.92 mm in females). Females tended to have slightly longer SMA-LC for all zones. There was no significant difference between sex in any zones (p ≥ 0.05, Shapiro–Wilk test and Kruskal-Wallis test). The mean SMA-IB in zone 1, zone 2, and zone 3 was 2.94 mm, 1.94 mm and 1.05 mm, respectively (2.58 mm, 1.78 mm, and 1.01 mm in males and 3.36 mm, 2.13 mm, and 1.10 mm in females). Zone 1 had the longest SMA-IB and zone 3 had the shortest SMA-IB. Females tended to have longer SMA-IB for all zones. There were significant differences between zones 1 and 3 in both males (p = 0.01, Shapiro–Wilk test and Kruskal-Wallis test) and females (p < 0.0001, Shapiro–Wilk test and Kruskal-Wallis test) (Figure 5).
3.4 Distance to SLA
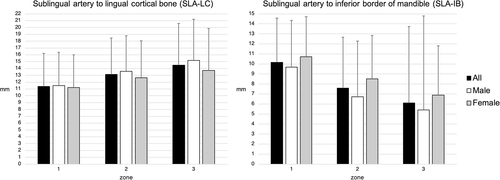
The mean SLA-LC of zone 1, zone 2, and zone 3 was 11.36 mm, 13.14 mm and 14.48 mm (11.50 mm, 13.59 mm, and 15.18 mm in males and 11.21 mm, 12.65 mm, and 13.70 mm in females). Zone 3 had the longest SLA-LC and zone 1 had the shortest SLA-LC. Males tended to have longer SLA-LC for all zones. There was significant differences between zones 1 and 3 in males (p = 0.004, Shapiro–Wilk test and Kruskal-Wallis test). The mean SLA-IB of zone 1, zone 2, and zone 3 were 10.16 mm, 7.58 mm, and 6.11 mm (9.67 mm, 6.73 mm, and 5.42 mm in males and 10.71 mm, 8.52 mm, and 6.88 mm in females). Zone 1 had the longest SLA-IB and zone 3 had the shortest SLA-IB. Females tended to have longer SLA-IB for all zones. There was significant difference between zones 1 and 2 in males (p = 0.021, Shapiro–Wilk test and Kruskal-Wallis test), between zones 1 and 3 in males (p < 0.0001, Shapiro–Wilk test and Kruskal-Wallis test), and between zones 1 and 3 in females (p < 0.0001, Shapiro–Wilk test and Kruskal-Wallis test) (Figure 6).
3.5 Diameter of arteries
The mean dFA was 1.15 mm (1.26 mm in male and 1.04 mm in female). There was significant difference between sex (p < 0.0001, the Mann–Whitney U test). The mean dSMA was 1.05 mm (1.09 mm in males and 1.00 mm in females). There was no significant difference between the sexes (p = 0.095). The mean dSLA was 1.03 mm (1.08 mm in males and 0.99 mm in females). There was no significant difference between the sexes (p = 0.14, Mann–Whitney U test) (Figure 7).

3.6 Thickness and width
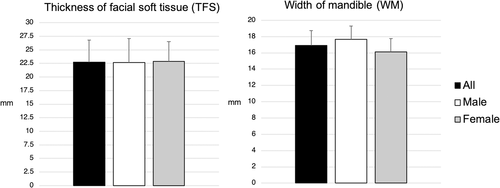
The mean TFS was 22.78 mm (22.68 mm in males and 22.86 mm in females). There was no significant difference between sex (p = 0.815, the Mann–Whitney U test). The mean WM was 16.91 mm (17.66 mm in males and 16.10 mm in females). There were significant differences between the sexes (p < 0.0001, the Mann–Whitney U test) (Figure 8).
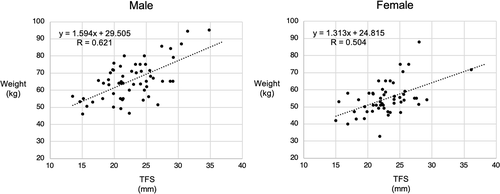
The coefficient of correlation between FA-BC and the TFS in zone 1, zone 2, and zone 3 were 0.432, 0.264, and 0.084, respectively. There was weak to moderate correlation in zones 1 and 2 (Figure 9). The coefficient of correlation between FA-BC and the patients' weight in zone 1, zone 2, and zone 3 was 0.543, 0.443, and 0.359, respectively. There was weak to moderate correlation for all zones (Figure 10). The coefficient of correlation between TFS and the patients' weight in males and females was 0.621 and 0.504, respectively. There was moderate correlation in both males and females (Figure 11).


4 DISCUSSION
To date, a number of anatomical studies regarding the vessels in the maxillofacial area have been conducted using CT. For example, Zhao et al. (2019) injected contrast dye into the external carotid artery of cadavers and analyzed the FA and its premasseteric branch with reconstructed three-dimensional CT. Cong et al. (2021) focused on the deviated FA for rejuvenation non-surgical procedures. Despite the warning by oral surgeons that iatrogenic injury of the FA can be caused by oral surgical procedures (Marco de Lucas et al., 2008; Pukenas et al., 2012), no previous research has attempted to localize the FA and other related vessels in relation to MTM surgery. Thus, this issue needs to be addressed in order to give surgeons better anatomical information so that iatrogenic injury can be minimized. In this study, 110 MTMs and related arteries were evaluated using CE-CT. The FA, SMA, and SLA were detected on 99.1%, 94.5%, and 90.0% of images, respectively.
4.1 Tooth sectioning/bone removal and arterial injury
The mean FA-BC of zone 1, zone 2, and zone 3 was 2.24 mm, 2.39 mm, and 1.67 mm, respectively. This result has shown that the FA in any zone of the MTM area runs adjacent to the buccal cortical bone. If the periosteum is invaded toward the facial soft tissue, there could be a greater chance for iatrogenic FA injury. Zone 3 in females had a greater chance of injury compared to zone 2 (p = 0.003).
The mean FA-BC tended to be larger in males and smaller in females for all zones although there was no significant differences. The FA in females in the MTM area could be encountered more frequently compared to male patients.
The inclination of the impacted MTM to the long axis of the second molar tooth was classified by Winter in 1926, that is, mesioangular, horizontal, distoangular, vertical, obliquity, buccal/lingual transverse, inverse (Winter, 1926). Mesial and horizontal angulations of the MTM are more common than distal and vertical angulations (Iwanaga, Kunisada, et al., 2021; Toedtling et al., 2019). In general, mesially-angulated MTMs are removed by sectioning the tooth close to the cervical area of the tooth or more mesial/superior part of the tooth (meaning zone 1 or 2). The mean FA-BC of zone 1, zone 2, and zone 3 was 2.24 mm, 2.39 mm, and 1.67 mm, respectively, and the mean FA-IB of zone 1, zone 2, and zone 3 was 5.83 mm, 2.60 mm, and 0.48 mm, respectively. Taking both the horizontal and vertical distances into consideration, the FA in zone 1 seems most likely to be injured if the surgical burr perforates the buccal cortical bone and the periosteum from inside. The SMA and SLA were found more distal compared to the FA; therefore, these did not seem to be at high risk of injury during MTM extraction.
4.2 Application to the osteotomy of the mandible
During osteotomy of the ramus of the mandible, for example, sagittal split osteotomy (SSRO), intraoral vertical ramus osteotomy, intraoral vertico-sagittal ramus osteotomy, and their modified techniques, the lateral surface of the ramus is exposed in order to attach the ramus retractor (Choung, 1992; Trauner & Obwegeser, 1957; Winstanley, 1968). The purpose of this retractor is to avoid the buccal soft tissues including the FA and this is well documented in anatomical studies (Hong et al., 2020; Lee et al., 2020). Pseudoaneurysm of the FA after SSRO has also been reported (Jo et al., 2013). Thus, osteotomy of the mandible, especially SSRO seems to be another procedure that might injure the FA. However, quantitative measurements of the FA for SSRO that can be easily applied to oral surgery, for example, intraoral or arterial measurements using CE-CT have not been reported.
The mean FA-BC in zone 3 in females was 0.98 mm. We believe that the buccal cortical bone in zone 3 is less likely to be injured by MTM extraction because zone 3 is a little too deep for using a surgical burr. For the vertical distance, the mean FA-IB in zone 3 was 0.48 mm, which might be considered too low to perforate the buccal cortical bone during a MTM extraction. However, during the osteotomy mentioned earlier, the periosteum in any of zones 1 to 3 can be elevated buccally. This potentially can damage the FA, especially when the FA-BC is short.
4.3 Prediction of the FA-BC
Based on reports in the extant literature, it is hard to predict the FA-BC unless a CE-CT is taken. The coefficient of correlation between FA-BC and the patients' weight in zones 1 and 2 (both were moderate) has shown that the thinner the patient the shorter the FA-BC.
5 CONCLUSIONS
We identified anatomical and radiological evidence that the FA can be damaged if surgical invasion in any zone of the MTM area reaches the facial soft tissues. Access to the lateral surface of the ramus during osteotomy of the mandible can also injure the FA. The FA might travel closer to the mandible in thinner patients. The SMA or SLA did not appear to be at risk of injury during MTM extraction.
6 LIMITATION
The arteries measured in this study were not always cut in their axial plane so the diameter could be larger than the actual size measured.
ACKNOWLEDGMENT
The authors sincerely thank those who donated their bodies to science so that anatomical research could be performed. Results from such research can potentially increase mankind's overall knowledge that can then improve patient care. Therefore, these donors and their families deserve our highest gratitude (Iwanaga, Singh, et al., 2021).


