Binding and thermodynamics of REV peptide−ctDNA interaction
Abstract
The thermodynamics of DNA-ligand binding is important as it provides useful information to understand the details of binding processes. HIV-1 REV response element (RRE) located in the env coding region of the viral genome is reported to be well conserved across different HIV-1 isolates. In this study, the binding characteristics of Calf thymus DNA (ctDNA) and REV peptide from HIV-1 were investigated using spectroscopic (UV–visible, fluorescence, and circular dichroism (CD)) and isothermal titration calorimetric (ITC) techniques. Thermal stability and ligand binding properties of the ctDNA revealed that native ctDNA had a Tm of 75.5 °C, whereas the ctDNA–REV peptide complex exhibited an incremental shift in the Tm by 8 °C, indicating thermal stability of the complex. CD data indicated increased ellipticity due to large conformational changes in ctDNA molecule upon binding with REV peptide and two binding stoichiometric modes are apparent. The ctDNA experienced condensation due to large conformational changes in the presence of REV peptide and positive B→Ψ transition was observed at higher molar charge ratios. Fluorescence studies performed at several ligand concentrations revealed a gradual decrease in the fluorescence intensity of EtBr-bound ctDNA in response to increasing ligand concentrations. The fluorescence data further confirmed two stoichiometric modes of binding for ctDNA–REV peptide complex as previously observed with CD studies. The binding enthalpies were determined using ITC in the temperature range of 293 K–308 K. The ITC binding isotherm was exothermic at all temperatures examined, with low ΔH values indicating that the ctDNA–REV peptide interaction is driven largely by entropy. The heat capacity change (ΔCp) was insignificant, an unusual finding in the area of DNA-peptide interaction studies. The variation in the values obtained for ΔH, ΔS, and ΔG with temperature further suggests that ctDNA–REV peptide interaction is entropically driven. ITC based analysis of salt dependence of binding constant gave a charge value (Z) = +4.01, as determined for the δlnK/δln[Na+] parameter, suggesting the participation of only 3–4 Arg out of 11 Arg charge from REV peptide. The stoichiometry observed for the complex was three molar charge of REV peptide binding per molar charge of ctDNA. ITC based analysis further confirmed that the binding between ctDNA and REV peptide is governed by electrostatic interaction. Molecular interactions including H-bonding, van der Waals forces, and solvent molecules rearrangement, underlie the binding of REV peptide to ctDNA.
1 Introduction
Interaction of small molecules with deoxyribonucleic acid (DNA) is an important area of research as DNA controls the structure and function of a cell. Many small molecules act as DNA binding agents and have been employed with proven significance in the treatment of genetic, oncogenic, bacterial, and viral infections or disease. To understand the function of these small molecules upon binding DNA and to develop novel therapeutics, an understanding of the binding modes and the thermodynamic parameters is important. The number of DNA-based peptide targets is limited compared to DNA-drug and protein-based targets.1 It is therefore important to study DNA-peptide interactions. DNA upon binding with small molecules such as peptides, experiences a change in conformation which can either stabilize or destabilize the B form of DNA.2 This change in DNA is paramount to the study of its binding thermodynamics which is important to understand molecular recognition. Biophysical characterization of DNA and peptides can furnish valuable information that will allow understanding of novel structures which can be utilized as models for targeted therapeutics.
Several biological processes are critically dependent on molecular recognition underlying intermolecular events such as DNA-ligand binding. DNA is a unique macromolecule carrying genetic information as well as participates as a “hub” in numerous intermolecular interactions. The physicochemical forces underlying these diverse interactions include Coulomb forces, hydrogen bonding, and van der Waals interactions. Small molecules can bind to DNA via intercalation, groove binding, covalent, or noncovalent interactions.3-5 Calf thymus DNA (ctDNA), is one of the macromolecules where binding possibly occurs by a combination of intercalation between stacked base pairs, noncovalent groove binding, or electrostatic interaction with the negatively charged nucleic acid sugar phosphate backbone.
Peptides and proteins containing arginine-rich motifs are able to bind with their cognate macromolecular (DNA or RNA) targets with high binding affinity.6 Interactions between DNA target macromolecules and peptides offer a simple and well-defined system to investigate the thermodynamic principles involved in macromolecular recognition. The REV peptide (DTRQARRNRRRRWRERQRAAAR) from Human Immunodeficiency Virus 1 (HIV1) upon binding to the REV Response Element (RRE) carries out its regulatory function of specific splicing of mRNA sequence in the nucleus for its transport to the cytoplasm. The RRE secondary structure has been probed7, 8 using chemical and enzymatic methods, which illuminated its importance in the sequence specificity of REV binding.9-11 REV forms a homo-oligomeric complex with RRE driven by hydrophobic interactions.9, 12-14 Structural studies have shown an alpha helix at the major groove of RRE–RNA complex, and this interaction is sequence base-specific with supplementary electrostatic contacts with phosphate backbone.15 The specificity of RSG-1.2 peptide binding to RRE-IIB RNA element of HIV-1 surpassing REV peptide is enthalpic in origin as reported by previous studies.16
DNA condensation phenomenon is particularly important due to the collapse of extended DNA chains into compact and overall characteristic toroidal morphology of the condensed particles.17 Therefore, it is important to study DNA condensation phenomenon governed by small molecules, peptides, proteins and other biomacromolecules. High molecular weight DNA undergoes a dramatic condensation to achieve a compact and highly ordered toroidal structure in the presence of multivalent cations such as arginine rich peptides.17 DNA condensation occurs when cationic peptides electrostatically interact with macromolecules. Different condensation agents are known including dendrimers,18 surfactants or lipids,19 and polyamines,20 which interact electrostatically with macromolecular DNA molecules. The REV peptide has multiple positive charges and therefore, it can act as a DNA condensing agent.
Spectroscopic and calorimetric measurements have opened new areas of research to investigate macromolecular ligand interactions, including hydrogen bonding, binding events, condensation, and key thermodynamic parameters. Therefore, these techniques can be employed to investigate the binding between macromolecules and small molecules. The interaction of DNA with REV peptide and its associated thermodynamic binding parameters have not been reported so far. This study presents a detailed comparative account of ctDNA binding with REV peptide using different spectroscopic and calorimetric methods. This study provides thermodynamic parameters important for obtaining a detailed molecular insight into the binding mechanisms of ctDNA–REV peptide complex. The results are exciting as large conformational changes in DNA are introduced due to condensation inducing properties of the peptide. In this study, increased stability and different binding modes are discovered for the complex formation between ctDNA and REV peptide. This study underscores the role and importance of entropy driven DNA-peptide binding via electrostatic interaction with low binding affinity. Our data further points that the ctDNA–REV peptide binding is temperature independent.
2 Materials and methods
2.1 Biochemicals
Highly polymerized fibrous ctDNA was purchased from Sigma-Aldrich Co. (St. Louis, MO, USA). A stock solution was prepared by dissolving ctDNA in 2–5 mL of sterile autoclaved water by mixing overnight at room temperature. The concentration of ctDNA was determined spectrophotometrically by measuring absorbance at 260 nm, 25 °C using molar extinction coefficient ε260 = 13,200 bp cm−1 M−1 (base pair).21 Absorption spectra were recorded on Agilent Cary 100 Series UV–Vis Spectrophotometer. The purity of ctDNA was determined by the ratio of absorbance at 260 nm to that at 280 nm. The observed A260/A280 >1.8 for ctDNA solution indicates a protein-free solution.22, 23 Protein-free purity of ctDNA was also confirmed using gel electrophoresis based analysis on a 10–15% SDS-PAGE stained with Coomassie Brilliant Blue (data not shown).
REV peptide (DTRQARRNRRRRWRERQRAAAR) was purchased from Beijing SBS Genetech Co. Ltd., Beijing, China and used as obtained. REV peptide (22 mer) was synthesized by solid-phase peptide synthesis using Fmoc-Chemistry and purified by HPLC using 0.1% trifluoroacetic acid in 100% water and acetonitrile, with 1.0 mL min−1 flow rate, at 214 nm wavelength, and with a 100 μL load volume. The REV peptide was obtained in a lyophilized powdered form with a purity of 95.06%. All stock solutions were diluted to the required concentrations with 10 mM sodium phosphate buffer, pH 7.0. All chemicals were of analytical reagent grade and autoclaved ultrapure water was used throughout the study.
2.2 Circular dichroism (CD) spectroscopy
To detect conformational changes observed between ctDNA and REV peptide, CD spectral data were collected using JASCO (model J815) spectropolarimeter equipped with a computer-controlled thermoelectrical cell holder using 1 cm path length quartz cuvette (Hellma GmbH & Co. KG, Müllheim, Germany). CD spectra of ctDNA in the absence and presence of varied concentrations of REV peptide were recorded at wavelengths ranging from 350 nm to 200 nm under constant nitrogen flush at 25 °C. A scan speed of 500 nm min−1, 1 nm bandwidth, 1 nm data pitch, and 3 accumulations with a response time of 1 s were adopted. Samples were prepared in 10 mM sodium phosphate buffer, pH 7.0. The concentration of ctDNA was fixed at 50 μM while REV peptide concentration was varied from the charge ratios (Z +/−) of 0.05–3.6. In a quartz glass CD cuvette, 500 μL buffer (10 mM sodium phosphate buffer, pH 7.0) was added and CD spectra were recorded for the baseline. A solution of 50 μM ctDNA was added to CD cuvette and mounted on the CD spectrometer to record CD spectra of ctDNA. REV peptide was added in different charge ratios (Z +/−) to same CD cuvette containing ctDNA solution and the whole solution was mixed well by inverting the cuvette up and down several times. The CD spectra measurement for the complex was repeated with 5 min incubation interval for each of the charge ratios (Z +/−).
2.3 Temperature-dependent UV spectroscopy (UV melting studies)
All melting measurements were carried out using Agilent Cary 100 Series UV–Vis Spectrophotometer with a temperature rate of change at 0.5 °C min−1. The instrument reading was zeroed with no reference. ctDNA–REV peptide complex melting was followed by changes in UV absorbance. A quartz cuvette (Hellma GmbH & Co. KG, Müllheim, Germany) of 1 cm path length was used for all melting studies. The ctDNA concentration was kept constant at 25 μM while REV peptide concentration was varied from molar ratios 0.5 to 3.5 with respect to ctDNA. Temperature-dependent absorption spectra were recorded at 260 nm at the rate of 0.5 °C min−1 increase in temperature from 40 °C to 95 °C in 10 mM sodium phosphate buffer, pH 7.0. The melting temperature (Tm) for each optically detected transition was calculated using the previously described method.24
2.4 Steady-state fluorescence spectroscopy
Fluorescence spectra were measured on Horiba Fluoromax-4 spectrofluorometer equipped with thermoelectrically controlled cell holders at a scanning speed of 80 nm s−1. The excitation wavelength of the sample was 480 nm and the fluorescence emission spectra were collected in the range 500 nm–700 nm. A quartz cuvette (Hellma GmbH & Co. KG, Müllheim, Germany) of 1 cm path length, transparent from all four sides, was used throughout. All experiments were carried out at 25 °C. ctDNA concentration was fixed at 50 μM and the REV peptide concentration was varied from the charge ratios (Z +/−) of 0.05–3.6 μM in 10 mM sodium phosphate buffer, pH 7.0. 50 μM ethidium bromide (EtBr) was used as a fluorescent probe.25 All solutions were mixed and incubated for 5 min before measurements were recorded.
2.5 Isothermal titration calorimetry (ITC)
 (1)
(1)Where ΔG is the change in standard Gibbs free energy, R is the universal gas constant (R = 1.987 cal mol−1 K−1), T is the temperature (in Kelvin) and Kb is the binding constant.
3 Results
3.1 Secondary structure rearrangement by REV peptide
We adopted CD spectroscopic analysis to reveal structural and conformational changes of ctDNA upon REV peptide ligand binding. The CD spectra of ctDNA were collected in the presence of REV peptide at different concentrations of REV peptide (Figure 1). The molar ellipticity of native ctDNA shows four major bands at 270 nm (positive), 245 nm (negative), 220 nm (positive), and 210 nm (negative). The positive CD signal at 270 nm accentuates, but the positive signal at 220 nm inverts to a negative value during formation of ctDNA–REV peptide complex. The negative signal at 210 nm accentuates further during complex formation. However, the signal at 245 nm remains nearly unchanged.
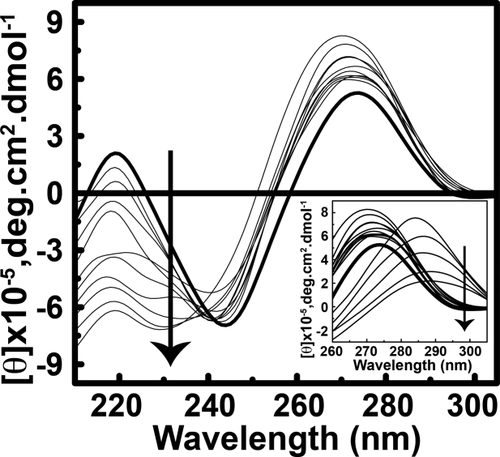
CD spectra showing the conformational changes in ctDNA upon addition of various amount of REV peptide. CD spectra of ctDNA alone (in thick line) and in the presence of REV peptide in the molar ratios varying the charge ratos (Z +/−) of 0.05–1.0 (in thin line). The inset illustrates the CD spectrum shift from 270 to 285 nm from the charge ratios (Z +/−) of 1.3–3.6. The concentration of ctDNA used was 50 μM in terms of its charge. All CD spectra collected in 10 mM sodium phosphate buffer, pH 7.0 at 25 °C. Molar ellipticities (θ), are in units of deg cm2 dmol−1. Arrows indicate the successive addition of REV peptide
The observed prominence in the new intensity of negative peak at 220 nm and in positive peak at 270 nm, suggests a decrease in base stacking interactions.26 Interestingly, the CD spectrum undergoes a sharp change and shifts from 270 nm to 285 nm and the peak area increases at a charge ratio (Z+/−) greater than 1.3. This change in molar ellipticity suggests large conformational changes of ctDNA molecule on binding between ctDNA and REV peptide. The changes in ctDNA–REV peptide complex take place in a concentration-dependent manner. The molar ellipticity at wavelength 270 nm versus charge ratios (Z+/−) plot is shown in Figure 2. Two binding modes are evident. At the charge ratio (Z+/−) of 1.0, the ctDNA:REV peptide exhibits 1:1 stoichiometry (Mode I), whereas the complex evidently has 1:3 stoichiometry (Mode II) at the charge ratio (Z+/−) of 3.0. No further conformational changes were observed at charge ratios >3.0 suggesting the reach of saturation point of the complex formation.
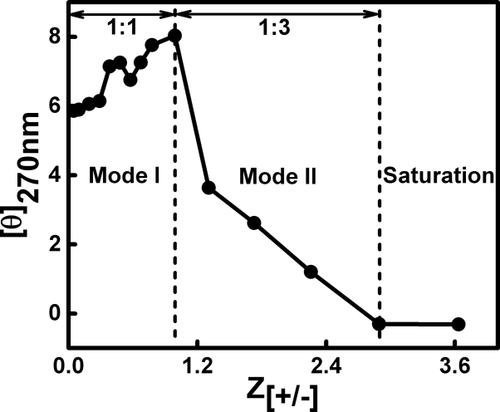
Plot of CD wavelength at 270 nm against varying ctDNA–REV peptide charge ratios (Z +/−) of 0.05–3.6. Two binding modes can be proposed for ctDNA–REV peptide interaction. Mode I depicts 1:1 stoichiometry while Mode II depicts 1:3 stoichiometry for ctDNA:REV peptide complex. The complex saturated after charge ratio 3.0
3.2 ctDNA thermal denaturation in the presence of REV peptide
We utilized UV–Vis absorption spectroscopy to understand the stability of ctDNA binding with REV peptide. The goal was to probe the thermodynamic stability of secondary structure in the ctDNA–REV peptide complex. Thermal denaturation of ctDNA was carried out in the presence of different concentrations of REV peptide to observe effects of binding on the stability of the structure. The melting profiles at 260 nm of ctDNA and its complex with the REV peptide at different concentrations are shown in Figure 3. The absorbance at 260 nm increases with the rise in temperature. The melting curve was sigmoidal and showed a shift indicating hyperchromic effect at 260 nm. The absorbance profile of ctDNA–REV peptide complex shows saturation at higher temperature. The melting temperature (Tm) of the native ctDNA was obtained at 75.5 °C. Upon binding to REV peptide, the melting temperature of ctDNA increased proportionally to the REV peptide concentration. The changes were observed in melting temperatures of ctDNA from 75.5 °C to 77 °C, 77.5 °C, 83 °C, and 83.5 °C for ctDNA:REV peptide complex at molar ratios of 1:0, 1:0.5, 1:1, 1:1.5, and 1:3.0, respectively. No significant differences were observed for ctDNA:REV peptide molar ratios above 1:3.0 (Figure 3). As depicted in Figure 3, a similar trend was observed for ctDNA:REV peptide molar ratios 1:3.0 and 1:3.5. This is indicative of saturation phase of the complex formation as observed with CD and fluorescence results (see section 3.3) in which further complex formation was not observed after Mode II. The significant change observed in melting temperature of ctDNA on the addition of REV peptide shows higher stabilization of the ctDNA–REV peptide complex.
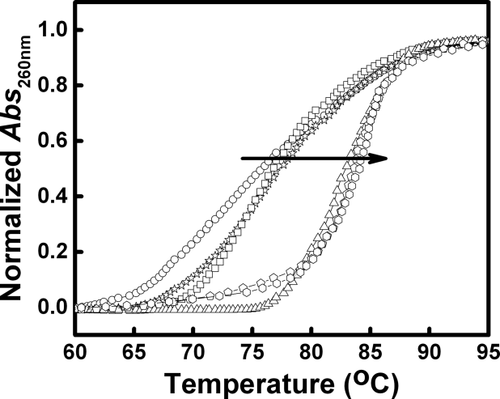
UV melting profiles of ctDNA and its complex with REV peptide at 260 nm in 10 mM sodium phosphate buffer, pH 7.0. The ctDNA concentration was 25 μM for all UV samples while REV peptide was added in increasing concentrations. The circle represents free ctDNA, square, star, triangle, pentagon, and hexagon represent addition of REV peptide in the ctDNA:REV peptide molar ratios ranging from 1:0.5, 1:1, 1:1.5, 1:3.0, and 1:3.5, respectively. Arrow indicates the successive addition of REV peptide
3.3 Fluorescence binding studies
To gain additional insights into the binding between ctDNA and REV peptide, steady-state fluorescence spectroscopy was employed. The binding was characterized using EtBr as a fluorescence spectroscopic probe. EtBr acts as an intercalating agent and was used as a probe to identify the displacement of bound EtBr–ctDNA complex fluorescence intensity by REV peptide.25 All fluorescence titration studies were carried out in 10 mM sodium phosphate buffer, pH 7.0 at 25 °C. The fluorescence titration was performed keeping ctDNA concentration constant and the REV peptide was added in increasing concentrations. Fluorescence titration spectra indicating EtBr displacement from EtBr–ctDNA complex with the successive addition of REV peptide are shown in Figure 4. Increasing the concentration of REV peptide results in gradual decrease in the fluorescence intensity of EtBr-bound ctDNA due to the displacement of fluorescence intensity of complex, suggesting quenching.27 The changes in ctDNA fluorescence intensity of the EtBr-bound ctDNA at 610 nm was normalized and variation of I0/I plotted against charge ratios (Z+/−), where the quantity of complex formed increased until all the available ligand was bound (Figure 5). As depicted in Figure 5, it is evident that, similar to CD results, two types of binding modes were observed in steady-state fluorescence studies. The 1:1 (Mode I) and 1:3 (Mode II) stoichiometries of ctDNA:REV peptide complex were observed at the total REV peptide molar ratios of 1.0 and 3.0, respectively. The fluorescence intensity of EtBr-bound ctDNA decreased upon addition of REV peptide and saturation was observed beyond REV peptide molar ratio (Z+/−) of 3.0 (Figure 5). The fluorescence measurements suggest that binding between ctDNA and REV peptide occurs maximum up to REV peptide molar charge ratios (Z+/−) of 3.0, and beyond this ratio, REV peptide does not bind ctDNA any further.
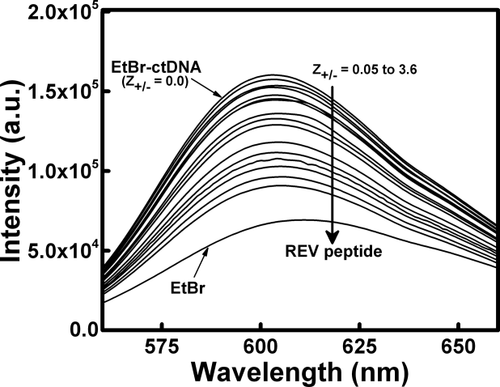
Fluorescence titration spectra for EtBr–ctDNA complex in the absence and presence of various amounts of REV peptide. Fluorescence intensity changes accompanying titration of EtBr bound ctDNA with REV peptide. Titration of 50 μM ctDNA with increasing concentrations of REV peptide from charge ratios (Z +/−) of 0.05–3.6. Right side arrow indicates the successive addition of REV peptide
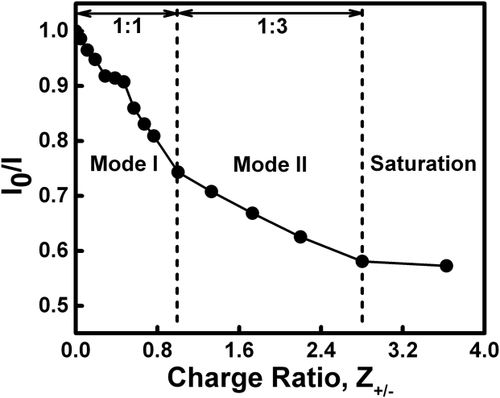
Variation of I0/I as a function of EtBr–ctDNA complex concentration. Where, I0 and I are the fluorescence intensities of the EtBr bound ctDNA at 610 nm. Mode I and Mode II illustrate 1:1 and 1:3 stoichiometry for the ctDNA:REV peptide complex, respectively. Complex starts saturating at or above REV peptide molar ratio of 3.0, suggesting end point of complex formation
3.4 Equilibrium binding studies by isothermal titration calorimetry (ITC)
To understand the thermodynamic basis of ctDNA binding with REV peptide, isothermal titration calorimetry (ITC) studies were performed. Figure 6 shows the results of a typical titration curve obtained at 298 K. The heat burst generated after addition of 3.0 mM REV peptide to the solution containing 0.1 mM ctDNA at temperature 298 K and the temperature variable (293 K–308 K) of ITC profile is depicted in Supporting Information, Figure S1. The major thermodynamic parameters related to ctDNA–REV peptide binding are presented in Table 1. The best fitting data for ctDNA binding isotherm with a model for one site is shown in Figure 6 and Supporting Information, Figure S1. The ctDNA–REV peptide binding affinity (Kb) obtained during all ITC experiments was positive value (Table 1), indicating specific binding. The change in enthalpy (ΔH) was negative value, indicating that ctDNA–REV peptide binding is a heat releasing exothermic process. The value of change in Gibbs free energy of binding (ΔG) was calculated using Eq. 1 (see Materials and Methods section 2.5) and the value is presented in Table 1. TΔS upon binding was calculated using the thermodynamic standard Gibb's equation ΔG = ΔH – TΔS. The entropy change (TΔS) associated with the binding between ctDNA and REV peptide was small positive values depicted in Table 1.
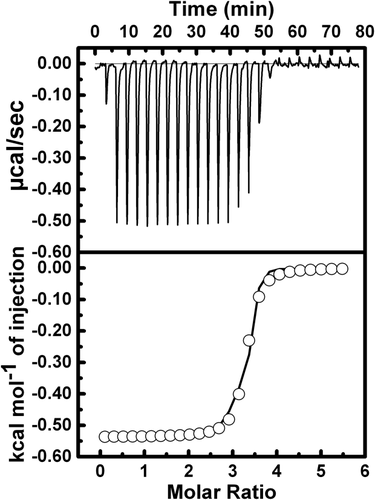
Isothermal titration calorimetry (ITC) for binding of the ctDNA with REV peptide using 10 mM sodium phosphate buffer, pH 7.0 at 298 K. The top plot is the baseline corrected experimental data. The bottom plot represents the molar heat released plotted against REV peptide to ctDNA molar ratios
| Temperature (K) | n | Kb (x106 M−1) | ΔH (kcal mol−1) | TΔS (kcal mol−1) | ΔG (kcal mol−1) |
|---|---|---|---|---|---|
| 293 | 2.4 | 4.1 (±0.07) | −0.6 (±0.1) | 8.3 (±0.6) | −8.9 (±0.6) |
| 298 | 3.3 | 3.9 (±0.02) | −0.5 (±0.1) | 8.4 (±0.4) | −8.9 (±0.4) |
| 303 | 3.0 | 3.9 (±0.04) | −0.5 (±0.1) | 8.6 (±0.6) | −9.1 (±0.5) |
| 308 | 3.6 | 4.2 (±0.08) | −0.4 (±0.1) | 8.9 (±0.5) | −9.3 (±0.4) |
- Thermodynamic parameters were obtained for REV peptide binding to ctDNA at variable temperature (293–308K). The ctDNA concentration in the cell was 0.1 mM and REV peptide concentration in the syringe was 3.0 mM. ΔG was determined using the Gibbs free energy relationship ΔG = −RT ln Kb, where R is the universal gas constant, T is the temperature, and Kb is the binding affinity for ctDNA–REV peptide interaction. ΔG corresponds to the Gibbs free energy change of binding and ΔH and ΔS correspond to the enthalpy and entropy change for the binding.
The binding affinity (Kb) measured from ITC studies was 3.9 (±0.02) × 106 M−1 at 298 K. At all the temperatures (293 K–308 K), and variable salt ITC experiments, the binding enthalpies (ΔH) were found to be negative, with nearly equal values. However, in all cases, the binding entropy (ΔS) was found to be favorable positive value. The stoichiometry of binding was calculated from the fitting of binding isotherm which gave a value of n = 3.3, suggesting 1:3 stoichiometry of ctDNA:REV peptide complex. Nearly similar results were obtained in most of the temperatures and salt variable ITC experiments. The 1:3 stoichiometry of the complex suggests that 3.0 REV peptide molar charge neutralizes one molar charge of ctDNA.
3.5 Heat capacity (ΔCp) measurements
 (2)
(2)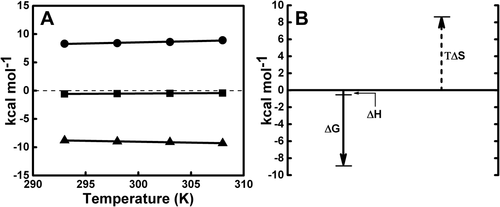
(A) Temperature dependence of the variations of enthalpy ΔH (■), entropy ΔS (●), and free energy ΔG (▲) during ctDNA–REV peptide interaction. See Table 1 for temperature dependence of ITC thermodynamic parameters. Heat capacity for the interaction of REV peptide with ctDNA. The slope of the least squares fitting of the enthalpy data (■) gives the heat capacity change (ΔCp) value of 0.007 kcal mol−1 K−1 (also see Supporting Information, Figure S2). (B) Pictorial representation of the enthalpic and entropic contributions to the binding free energy at 298 K confirming that interaction is entropically driven process. Standard thermodynamic relationship ΔG = ΔH − TΔS was used
The solid line denotes the linear regression fit of the data points. The slope of the resulting line of the plot between enthalpy change (ΔH) vs temperature (K) is depicted in Supporting Information, Figure S2 shows ΔCp value of 0.007 kcal mol−1 K−1 for the binding of ctDNA with REV peptide. This value suggests negligible changes in heat capacity, and therefore, ΔCp is considered to be close to zero. The value obtained for ΔCp is an exceptional case for ITC-based heat capacity experiments. In addition, the effect of temperature on the entropy (ΔS), enthalpy (ΔH), and change in Gibbs free energy (ΔG) components are given in Figure 7A. The TΔS component was observed to be independent of ΔH and ΔG (Figure 7B). A pictorial representation of the standard thermodynamic relationship ΔG = ΔH − TΔS (Figure 7B) shows that REV peptide binding to ctDNA is favored by entropy.
3.6 Salt dependence of binding constants
Furthermore, ctDNA–REV peptide binding studies were carried out at different Na+ concentrations using ITC (see Materials and Methods section 2.5) at 298 K as presented in Supporting Information, Figure S3. The data derived from the ITC experiment performed at the highest salt concentration (0.106 M) is shown in Figure 8. A minor decrease in the thermodynamic parameters such as Kb, ΔH, TΔS, and ΔGobs was observed. The ctDNA–REV peptide interaction at any given salt concentration has a favorable entropic and enthalpic contribution to the observed free energy. Similar to variable temperature-dependent experiment, the enthalpy change was found to be negligible during variable salt-dependent ITC experiment. The thermodynamic data observed at 298 K during variable salt ITC experiment is summarized in Table 2. The observed binding constant (Kb) decreased upon increasing salt [Na+] concentration from 0.016 M to 0.106 M. The enthalpic and entropic contributions to the free energy in the range of salt concentrations used are shown in Table 2. The observed free energy decreases while increasing the salt concentration, whereas the enthalpy remains almost constant in each case indicating that decrease in binding affinity is an entropically driven phenomenon.
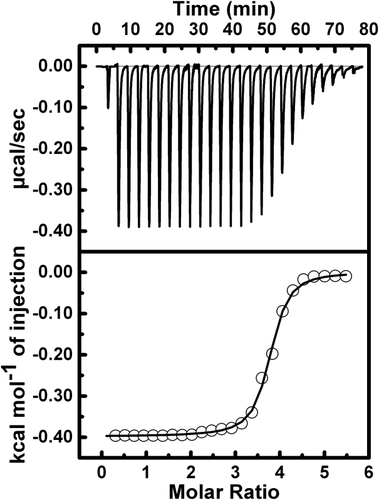
Isothermal titration calorimetry (ITC) for binding of the ctDNA with REV peptide in presence of 0.106 M Na+ ion using 10 mM sodium phosphate buffer, pH 7.0 at 298 K. The top plot is the baseline corrected experimental data. The bottom plot represents the molar heat released plotted against REV peptide to ctDNA molar ratios
| [Na+] [M] | n | Kb (×106 M−1) | ΔH (kcal mol−1) | TΔS (kcal mol−1) | ΔGobs (kcal mol−1) |
|---|---|---|---|---|---|
| 0.016 | 3.2 | 1.7 (±0.03) | −0.5 (±0.4) | 8.0 (±0.4) | −8.5 (±0.9) |
| 0.026 | 3.6 | 1.6 (±0.03) | −0.5 (±0.4) | 7.9 (±0.6) | −8.4 (±0.3) |
| 0.056 | 3.4 | 1.1 (±0.01) | −0.5 (±0.1) | 7.7 (±0.8) | −8.2 (±0.6) |
| 0.106 | 3.6 | 1.0 (±0.01) | −0.4 (±0.2) | 7.7 (±0.6) | −8.1 (±0.8) |
- Thermodynamic parameters were obtained for REV peptide binding to ctDNA at 298 K. The ctDNA concentration in the cell was 0.1 mM and REV concentration in the syringe was 3.0 mM. ΔGobs was determined using the Gibbs free energy relationship ΔGobs = −RTlnKb, where R is the universal gas constant, T is the temperature, and Kb is the binding affinity for ctDNA–REV peptide interaction. ΔGobs corresponds to the observed free energy change of binding and ΔH and ΔS correspond to the enthalpy and entropy change for the binding.
3.7 ctDNA–REV peptide binding is governed by electrostatic interactions
 (3)
(3)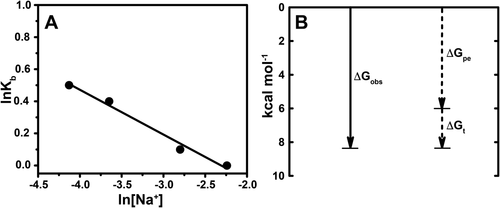
(A) The effect of salt-dependent variation on ctDNA–REV peptide binding constant (Kb). Kb values were obtained for a 0.016 M–0.106 M [Na+] range. The slope value (SK) of the plot is given by relation δlnK/δln[Na+] = −ZΨ = −3.53. Sodium chloride was used throughout all salt dependence studies. The lines are linear least-squared regressions. (B) Explanation of the binding free energy (ΔGobs) and its two sub component polyelectrolyte (ΔGpe) and nonpolyelectrolyte (ΔGt) contributions, suggesting binding is electrostatic in nature
 (4)
(4)In Eq. (4), SK is the slope, Z is the charge on the ligand involved in the interaction, and Ψ is the proportion of counterions for the first fit associated with each phosphate group of DNA molecule. The counterion on the first fit Ψ value for double stranded B-type DNA is normally 0.88.
The predicted SK for the plot in Figure 9A is −3.53. Figure 9A indicates the charge value (Z) = +4.01 for REV peptide at neutral pH.
 (5)
(5) (6)
(6)The calculated ΔGpe value was −6.0 ± 0.6 kcal mol−1. On analyzing thermodynamic parameters which contributed to ΔGobs, it is clear that nearly 73% of the observed binding free energy results from electrostatic interactions while nearly 27% of it originates from nonpolyelectrolyte interaction. The data presented in Figure 9B confirms that the interaction is of electrostatic type as ΔGpe > ΔGt. Also, the slope (Figure 9A) and the intercept of linear least-squares regressions suggest that the binding interaction is typically electrostatic in nature. The charge value (Z) = +4.01 confirms that only 3–4 Arg out of 11 charged Arg from REV peptide participate during interaction with ctDNA. It seems that REV peptide binds electrostatically to the phosphate of ctDNA and binding happens with the bases present in groove region of ctDNA.
4 Discussion
DNA-binding studies with ligands are important for rational design and discovery of drugs targeted to DNA and DNA delivery. Binding properties of various ligands with DNA have been characterized earlier.29 Peptide–DNA binding specificities and its thermodynamic parameters can be easily achieved by applying spectroscopic and calorimetric techniques. To discuss the findings of the interaction between ctDNA and REV peptide, individual components were explored to achieve complete thermodynamic profile (ΔG, ΔH, ΔS, Kb, and ΔCp) along with conformational changes, stability, and different binding modes of the complex.
4.1 REV peptide induces the Ψ conformation of ctDNA
The DNA–ligand interactions are important to understand the effect of ligand on replication and transcription process, which in particular are of interest for the rational design of anticancer and antibacterial drugs. Most chemotherapeutic pharmaceuticals are derived from DNA binding ligands which interact with the DNA duplex by different modes of binding namely DNA intercalation, groove binding, covalent binding, and electrostatic interaction. Therefore, CD spectroscopy is extremely useful in performing binding and conformational studies of nucleic acids and for specific ligands that recognize DNA sequences and structures with high selectivity.30-34
Two CD signals of ctDNA observed at 220 and 270 nm are accentuated during interaction with REV peptide. The positive band at 270 nm is due to base stacking and the negative band at 245 nm is due to the helicity of the right-handed B form of ctDNA structure.35 These results show significant changes in base stacking and helicity during interaction with REV peptide. The alteration in CD spectral band position as well as intensity is due to the large conformational transitions observed in duplex ctDNA during its binding with REV peptide. The CD spectral positive band at 220 nm and another positive band at 270 nm experienced change in orientation and position suggesting significant distortion in native conformation of B form structure of ctDNA due to its interaction with REV peptide,34, 35 even at a low charge ratio. When the charge ratio was increased to >1.3, the CD spectrum experienced a shift from 270 nm to 285 nm, indicating a characteristic morphological change in ctDNA from B to Ψ form.34 This change observed in the presence of REV peptide is likely due to DNA condensation by REV peptide. This change could occur due to several factors such as concentration, preparation method, source, length, and pH of the solutions used for the study. The acidic pH or neutral pH favors B to Ψ transition. Another possibility is that the binding between ctDNA and REV peptide is a multiple event.
The plot of molar ellipticity change in CD spectrum at 270 nm against overall charge ratio (Z+/−) provides us with valuable information about different binding modes whereby molar ellipticity change saturates at a charge ratio ≥3. Overall, two binding modes can be proposed based on CD spectral data for ctDNA–REV peptide complex, namely 1:1 (Mode I) and 1:3 (Mode II). This conclusion is somewhat similar to multiple binding stoichiometries and affinities reported earlier for ctDNA.36, 37 Three molar charge of REV peptide ligand is saturation limit per molar charge of ctDNA molecule. At the saturation limit of 1:3 of ctDNA–REV peptide complex, the overall structural morphology of ctDNA transits from B to Ψ conformation.
4.2 REV peptide stabilizes ctDNA
Temperature-based denaturation of DNA could be due to either electrostatic repulsion of two strands in the helix or overall gain in entropy during the change from double stranded DNA helix to single stranded random coil structure. Thermal melting studies support the stabilization of ctDNA structure upon binding with REV peptide. The complex with ctDNA–REV peptide molar ratio from 1:0.5, 1:1, and 1:1.5 experienced a Tm shift of 1.5 °C, 2.0 °C, and 7.5 °C, respectively. At ctDNA–REV peptide molar ratio of 1:3.0, the complex exhibited high thermal stability (Tm shift 8 °C). At a higher ctDNA:REV peptide molar ratio of 1:3 and above, a similar trend of melting profile was observed which indicates saturation phase of the complex. The higher stability of ctDNA–REV peptide complex is due to the formation of extra H-bonds and other noncovalent interactions between ctDNA and REV peptide. In addition, it is possible that polarity of REV peptide and ctDNA in this medium could have influenced the ctDNA melting. The dielectric constant difference of the medium with the rise in temperature could influence the binding forces and the energy of ctDNA-REV peptide binding interaction.
4.3 ctDNA–REV peptide saturation upon binding
The EtBr bound form of ctDNA upon complexation with REV peptide showed decrease in fluorescence intensity due to quenching,27 and saturated with REV peptide charge ratio Z+/− = 3.0 or above (Figure 5). The shifting of midpoint of the fluorescence binding toward the higher concentration of REV peptide confirms the tight binding of the complex. The plot of variation of I0/I as a function of EtBr–ctDNA complex concentration versus total REV peptide charge ratios (Z+/−) provides insights on existence of two binding modes similar to an earlier report.35, 36 The complex achieves saturation of fluorescence at three molar charge of REV peptide to one molar charge of the ctDNA. Similar conclusions were apparent from CD spectroscopic data. The different modes of binding for ctDNA–REV peptide complex suggest multiple binding events. The saturation phase of the complex at charge ratio Z+/− 3.0 or above suggests completion of charge neutralization. This is due to the hydrophobic interactions between positively charged REV peptide and ctDNA base pairs. It can be hypothesized that at higher charge ratios above 3.0, when charge neutralization process was complete, the REV peptide helped to condense ctDNA due to crowding effect around DNA chains. This results in the displacement of major portion of the intercalated EtBr molecule complexed with ctDNA helix.
4.4 Thermodynamics of ctDNA–REV peptide binding
The thermodynamics of binding between DNA and charged peptide can provide valuable information to understand biological processes. The thermodynamics of ctDNA and REV peptide binding can be considered as two continuous processes in a single ITC experiment. First, the cationic ligand, REV peptide, binds to the negatively charged ctDNA and then after reaching the critical ligand concentration, ctDNA starts condensation process. The charged ligands play a significant role while interacting with DNA molecule sensitive to electrostatic effects. Positively charged cationic peptides are condensed around the polyanionic DNA double helix in such a way that they form a mobile charge cloud around the DNA backbone and thus neutralize the charge. Therefore, DNA and cationic ligand binding are considered to be thermodynamically linked effects.
The polyelectrolyte theory and its effect on binding constants are depicted in Figure 9, which clarifies the contribution of polyelectrolytic (electrostatic) and nonpolyelectrostatic interactions.28 The ctDNA–REV peptide interaction is electrostatic as its contribution to free energy is more than nonpolyelectrostatic (ΔGpe > ΔGt). The experimental data suggests that out of −8.2 kcal mol−1 free energy, −6.0 kcal mol−1 and −2.2 kcal mol−1 is due to electrostatic and nonpolyelectrostatic effect on ctDNA–REV peptide solution with 0.056 M NaCl solution, respectively. This could be due to release of condensed counter ions from the ctDNA helix upon REV peptide binding. The less contribution of nonpolyelectrostatic effect to ΔGobs could be explained due to contribution of hydrogen bonding, van der Waals, and hydrophobic interactions. The presence of salt in the buffer is another factor for electrostatic contribution to the entropy changes in ctDNA–REV peptide interaction. The stability of ctDNA–REV peptide is due to the network of hydrogen bond and minor groove contacts achieved through van der Waals and hydrophobic interactions. Out of 11 Arg cationic counterion, only 3–4 Arg participate in the interaction due to charge value (Z) = +4.01 obtained for REV peptide at neutral pH (Figure 9A).
The sigmoidal binding isotherms obtained from ITC experiments are indicative of a single binding site. In all individual ITC experiments that were performed, the ctDNA:REV peptide stoichiometry was found to be 1:3 confirming the participation of 3.0 molar REV peptide charge per molar charge of ctDNA. Surprisingly, in all temperature variable ITC experiments performed, the negative binding enthalpy was found to be a negligible quantity. The study highlights one of the first instances of negligible enthalpy change during DNA–ligand interaction. This negligible enthalpy of ctDNA–REV peptide binding could be partially explained by different structural changes that occur in the microenvironment of the complex. Heat capacity changes during REV peptide binding to ctDNA provide information about the thermodynamic mode of binding. Variable temperature ITC experiments were exothermic in nature and slightly affected during temperature increment. The negligible change in heat capacity (ΔCp = 0.007 kcal mol−1 K−1) is commonly not seen in this type of interaction. Such cases are unusual in calorimetric-based experiments and this finding is the first report for a DNA–peptide interaction. The negligible change in heat capacity is due to electrostatic interaction and DNA condensation in the presence of a cationic peptide. The contribution of different thermodynamic parameters towards series of temperature and correlation of ΔH, ΔS, and ΔG together is indicative of entropy-based binding phenomenon (Figure 7).
The observed positive values of ΔS and negative values of ΔH are consistent with the characteristics of van der Waals, hydrophobic, and electrostatic interactions. The change in entropy during binding of REV peptide and ctDNA is mainly due to change in structure, conformation, orientation, number of water molecules, and ions released. The CD results also show that REV peptide binding accompanies large conformational changes of ctDNA resulting in B → Ψ transition. Unfavorable entropy changes during ctDNA–REV peptide binding were not observed. The small and low enthalpy change during ITC experiment could be due to desolvation and deionization of polar groups, which negatively compensates for the energy released due to hydrogen bond formation. Therefore, REV peptide can be considered as minor-groove binding ligand which gives exothermic binding enthalpies. Because REV is a cationic peptide, it can charge-neutralize and condense ctDNA to form compact toroids or rod type structures.
REV peptide is composed of 11 positively charged Arg residues and 2 negatively charged residues (Asp and Glu). The computed overall hydrophobicity of REV peptide is −2.791 (http://web.expasy.org/protparam/), thus confirming the hydrophilic nature of the peptide. The highly charged amino acids within peptide confer the tendency to get highly solvated in the aqueous solution. The packing of ctDNA–REV peptide is due to remaining interfacial water molecules and stabilizing of the complex is due to presence of hydrogen bond network between polar bases of ctDNA and charged amide groups of REV peptide. The positive and favorable entropic change in ITC during the ctDNA–REV peptide complex formation indicates either the sequestration of water molecules around the ctDNA–REV peptide complex or a more structured complex as compared to native ctDNA. The positive ΔS values could arise due to hydrophobic effects and intermolecular hydrogen bonds network. The negative and negligible change in enthalpy suggests the involvement of ionic, dipole moment, van der Waals interaction, and the presence of hydrogen bonds. It appears that the polar arginine residues (Arg 3, Arg 6, 7, Arg 9–12, Arg 14, Arg 16, Arg 18, and Arg 22) of REV peptide makes hydrogen bonds or electrostatically interact with the polar phosphate backbone of ctDNA resulting in burial of polar groups leading to the reduced solvent accessibility to the complex.
These results clearly indicate that the binding between ctDNA and REV peptide is a specific electrostatic interaction governed by oppositely charged molecules. It is possible that three modes of electrostatic interactions occur during ctDNA–REV peptide binding phenomena. First, the electrostatic interaction with the negative charged nucleic sugar phosphate structure binds with positively charged REV peptide. Second, the binding interaction with two major grooves of the ctDNA double helix and the third mode is the intercalation with stacked base pairs of native ctDNA macromolecule.
5 Conclusions
The interaction of the ctDNA with REV peptide was investigated by combining various spectroscopic and calorimetric techniques and the presence of a thermodynamically stable complex was observed. The ctDNA exhibits large conformational changes upon binding due to DNA condensation properties of REV peptide. The CD and fluorescence data provide overall insight into ctDNA–REV peptide binding and suggest two stoichiometric binding modes. The strong binding and 1:3 stoichiometry of ctDNA–REV peptide was observed based on ITC. The binding enthalpies are negative and of negligible value. The temperature dependence of binding enthalpies shows that ctDNA–REV peptide interaction is an entropically driven process. The variable temperature ITC experiment provides negligible change in enthalpy and this is the first report of the heat capacity changes (ΔCp) calculated to be close to zero. Salt dependence of the binding constants indicates that nearly 73% of free energy is due to electrostatic interaction while nearly 27% is due to nonpolyelectrolytic interaction. Future studies may provide insight into thermodynamic basis of these interactions which can further open a window for developing new therapeutic molecules targeting such complexes.
Acknowledgments
S.K.U. is a recipient of the DST INSPIRE Faculty award from the Department of Science & Technology (DST), Government of India (IFA-13 CH-102). S.K.U. is thankful to Dr. Souvik Maiti for his continuous support.


