Molecular investigation of the interaction between ionic liquid type gemini surfactant and lysozyme: A spectroscopic and computational approach
This article was originally published online as an accepted preprint. The “Published Online” date corresponds to the preprint version. You can request a copy of any preprints from the past two calendar years by emailing the Biopolymers editorial office at [email protected].
ABSTRACT
Herein, we are reporting the interaction of ionic liquid type gemini surfactant, 1,4-bis(3-dodecylimidazolium-1-yl) butane bromide ([C12−4-C12im]Br2) with lysozyme by using Steady state fluorescence, UV-visible, Time resolved fluorescence, Fourier transform-infrared (FT-IR) spectroscopy techniques in combination with molecular modeling and docking method. The steady state fluorescence spectra suggested that the fluorescence of lysozyme was quenched by [C12−4-C12im]Br2 through static quenching mechanism as confirmed by time resolved fluorescence spectroscopy. The binding constant for lysozyme-[C12−4-C12im]Br2 interaction have been measured by UV-visible spectroscopy and found to be 2.541 × 10⁵M−1. The FT-IR results show conformational changes in the secondary structure of lysozyme by the addition of [C12−4-C12im]Br2. Moreover, the molecular docking study suggested that hydrogen bonding and hydrophobic interactions play a key role in the protein-surfactant binding. Additionally, the molecular dynamic simulation results revealed that the lysozyme-[C12−4-C12im]Br2 complex reaches an equilibrium state at around 3 ns. © 2015 Wiley Periodicals, Inc. Biopolymers 103: 406–415, 2015.
INTRODUCTION
The conventional single chain surfactants like cetyltrimethyl ammonium bromide (CTAB) and sodium dodecyl sulphate (SDS) have been extensively used in proteomic research, such as protein folding, denaturation, and binding analysis.1-8 These applications of monomeric surfactants sometime become complicated due to formation of foam and emulsion. These complications develop interest among the scientific community to design and synthesized the novel surfactants. Recently, gemini surfactants have been received much attention due their wide applications in industry, biochemistry, pharmacy, and cosmetics.9 Gemini surfactant belongs to a new class of surfactants, containing two hydrophilic head group and two hydrophobic tails and a spacer in the same molecule.10-13 The lower critical micellar concentration (CMC) value of gemini surfactants over the conventional surfactants comprises the better wetting, foaming, dispersing, and emulsifying properties.14-16 Moreover, gemini surfactants are referred to as green surfactant because a lesser amount is needed to perform the same function as compared to the conventional surfactant.
Surfactants, both cationic and anionic, have been utilized to understand the protein-amphiphile system over a period of 50 years.17 Their interaction with the proteins has been extensively studied in vitro employing different types of physicochemical techniques.18-20 These interactions receive much attention because of their applicability in drug delivery, cosmetic systems and food industry.21 Protein-surfactant interactions depend upon the structures and concentrations of both protein and surfactant.22 Moreover, the nature of spacer and hydrophobic content also affects the protein-surfactant interactions.23 Much of the research work has been dedicated to the interactions between protein and conventional surfactants such as CTAB, SDS, and Triton X-100,24 but very less is known about protein-Gemini surfactant interactions.25-28 In our previous work we have studied the effect of dodecyl betainate gemini (DBG) on lysozyme and bovine serum albumin.27, 28 Also in another study we have shown the interaction of pyrrolidinium based ionic liquid with BSA and HSA.29, 30 In continuation of our previous studies, therefore, herein, we have investigated the interaction of ionic liquid type gemini surfactants (ILGS) with lysozyme by utilizing the different spectroscopic approaches and computational methods. Due to the ionic nature of ionic liquids, ILGS have special properties and potential applications in many areas. In addition, the existence of imidazolium rings gives them an extra edge in being more beneficial over conventional surfactants. They exhibit stronger tendency toward self-aggregation, because of the distinct polarizability of imidazolium head groups, and therefore, could be used as supramolecular templates in the preparation of functional materials.31, 32 It was found that ionic liquids have the ability to enhance the stability, solubility, activity, and sterioselectivity of enzymes.33 It was also observed that same protein showed different behaviour towards different ionic liquids, i.e., it may get stabilized by one class of ionic liquids while denatured by another class of ionic liquids.34 In addition, ionic liquids have a prominent role in miscellaneous industrial applications, where high surface area, modification of the interfacial activity or stability of colloidal systems are required. Recently, the temperature dependent self-assembly of amphiphilic drug in [C8mim][Cl] have been reported.35
Hen egg white lysozyme is small, monomeric, globular protein of 129 amino acids containing six tryptophan, three tyrosine, and four disulphide bonds.36 The high-resolution crystal structure of hen egg lysozyme shows two dominant fluorophores, Trp62 and Trp108 which are close to the substrate binding site.37 Trp62 and Trp108 play important roles in binding with a substrate or an inhibitor and in stabilizing the structure. Fluorescence analysis of these tryptophan residues provides information of the lysozyme–ligand interaction and ligand-induced conformational change around the binding site.38 In this work, we have discussed binding mechanism, number of binding sites, binding forces and conformational changes induced by [C12−4-C12im]Br2 in lysozyme. In addition, we have discussed the principal regions of binding sites of lysozyme for [C12−4-C12im]Br2 by utilizing the computational methods.
MATERIALS AND METHODS
Materials
Lysozyme was purchased from Sigma Aldrich and the [C12−4-C12im]Br2 was synthesised in our lab according to the literature.39 The structure of [C12−4-C12im]Br2 is shown in Scheme 1. The stock solution of lysozyme (5 × 10⁻⁶M L−1) was prepared in phosphate buffer at pH 7.40. The concentration was calculated by dividing absorbance at 280 nm by the molar extinction coefficients of the lysozyme ε280 = 2.64 mL mg−1 cm−1.40 All other reagents were of analytical reagent grade and doubly distilled water was used throughout the experiments.

Structure of [C12−4-C12im]Br2 Gemini surfactant.
Steady-State Spectra
The steady state fluorescence spectra were obtained at fixed concentration of lysozyme (5 × 10⁻⁶M) and varied concentration of [C12−4-C12im]Br2 (1.1 × 10⁻⁵−4.5 × 10⁻⁵M) by spectrofluorimeter (Varian Cary Eclipse) with the wavelength range of 290 to 500 nm. All fluorescence spectra were collected using 1.0 cm quartz cuvette with both excitation and emission band width set at 5 nm. The intrinsic fluorescence of the lysozyme was measured at an excitation wavelength of 280 nm to ensuring the overall fluorescence of the protein i.e. excitation of both Trp and Tyr residues. However, Phe is not excited in most cases and its quantum yield in protein is rather low, so the emission from this residue can be ignored.28 The samples were carefully degassed using pure nitrogen gas before the experiment.
UV-Vis Spectra
The absorption spectra were carried out on Analytik Jena specord-250 spectrophotometer with the wavelength range of 230 to 400 nm. Quartz cuvettes having 1 cm path length were used for the measurements. The absorbance of lyzozyme was measured by keeping constant concentration of lysozyme (5 × 10⁻⁶M) and varying the concentrations of the [C12−4-C12im] Br2. The experiments were recorded at 298 K.
Time-Resolved Measurements
Fluorescence lifetime measurements were carried out in a picosecond time correlated single photon counting (TCSPC) spectrometer equipped with pulsed nanosecond LED excitation heads at 280 nm (Horiba, JobinYvon, IBH Ltd, Glasgow, UK). The fluorescence lifetime data were measured to 10,000 counts in the peak, unless otherwise indicated. The excitation of the sample is carried out by a nanosecond diode laser at 280 nm as a light source. The data analysis was carried out by the software provided by IBH (DAS-6).
Fourier Transform-Infrared Spectroscopy (FT-IR) Measurements
FT-IR spectra were recorded with a Spectrum BX-II Perkin-Elmer Spectrometer (Perkin-Elmer). The FT-IR spectra of lysozyme in the absence and presence of [C12−4-C12im]Br2 were recorded at room temperature in the range of 1700 to 1500 cm−1. Lysozyme was prepared using a deuterated buffer to prevent interference by water in the amide region of the protein spectra. In addition, the FT-IR spectra was also utilized to estimate the secondary structure compositions of pure lysozyme and lysozyme-[C12−4-C12im]Br2 complex by curve fitting results of the amide I band.41
Molecular Docking
MGL tools 1.5.4 with AutoGrid 4 and AutoDock 4 were used to set up and perform blind docking calculations between the [C12−4-C12im]Br2 and lysozyme. The crystal structure co-ordinates for lysozyme (PDB ID: 6LYZ) were obtained from Protein Data Bank (http://www.rcsb.org/pdb.). The three-dimensional structure of ligand [C12−4-C12im]Br2 was created by CORINA software. Receptor (lysozyme) and ligand ([C12−4-C12im]Br2) files were prepared using AutoDock Tools. The lysozyme was enclosed in a box with number of grid points in x _ y _ z directions, 98 _ 84 _ 112 and a grid spacing of 0.375 Å. The center of the grid set to 0.082, 20.969, and 19.816 Å. Lamarckian genetic algorithm (LGA) implemented in AutoDock was applied to calculate the possible conformation of the [C12−4-C12im]Br2 that binds to the lysozyme. During docking process, a maximum of 10 conformers was considered for the lysozyme. The conformer with the lowest binding free energy was used for further analysis. The output from AutoDock was rendered with PyMol and python molecular viewer 1.5.6.
Molecular Dynamic Simulation
Molecular dynamics (MD) simulation is an important tool to understand the binding mode of the ligand to the protein. Moreover, MD simulation also provides the information about the function of biological molecules as well as the physical basis of the structure.42 The MD simulations were performed using the GROMACS 5.0 package, in conjugation with the GROMOS96 43a (I/II) force field.43, 44 The GROMACS and Prodrg program were used to create the topology parameter of lysozyme and [C12−4-C12im]Br2, respectively. The lysozyme-[C12−4-C12im]Br2 complex was immersed in the cubic box of simple point charge (SPC) water molecule.45 Counterions were added to neutralize the entire solvated system. The steepest decent method of 500 steps was used for energy minimization to release the conflict contacts. Additionally, it was followed by a conjugate gradient method for 500 steps. Generally, there are two phase in MD simulation studies, equilibration and production phase. In equilibration phase the counter ions, lysozyme and [C12−4-C12im]Br2 were fixed and the position controlled the dynamic simulation of the system, wherein the atom position of lysozyme was controlled at 300 K for 100 ps. In the last step, the full system was subjected to 4000 ps MD simulation at 300 K and 1 bar pressure. During simulation process, the leaf frog algorithm was carried out with a time step of 2 fs. Atomic coordinates were also recorded at every 0.5 ps for latter analysis.
RESULTS AND DISCUSSION
Fluorescence Quenching of Lysozyme by [C12−4-C12im]Br2
The fluorescence measurements provide useful information for the binding mechanism between ligand and protein.46 There are three intrinsic fluorophore molecules, tryptophan (Trp), tyrosine (Tyr), and phenylalanine (Phe) present in protein which provides information about protein conformation and intermolecular interactions. Figure 1 shows the fluorescence spectra of lysozyme in the absence and presence of [C12−4-C12im]Br2 in buffer (pH = 7.40) when excited at 280 nm at 298 K. The solution of lysozyme (5 μM) was titrated by the gradual addition of [C12−4-C12im]Br2 solution (stock solution 8 mM) to give the concentration range from 1.1 × 10⁻⁵ to 4.5 × 10⁻⁵M. It is evident from the Figure 1 that the emission intensity of lysozyme decreases with increasing concentrations of [C12−4-C12im]Br2, however, there is no shift in the maximum emission wavelength suggesting that [C12−4-C12im]Br2 binds to lysozyme and quenches its intrinsic fluorescence.47
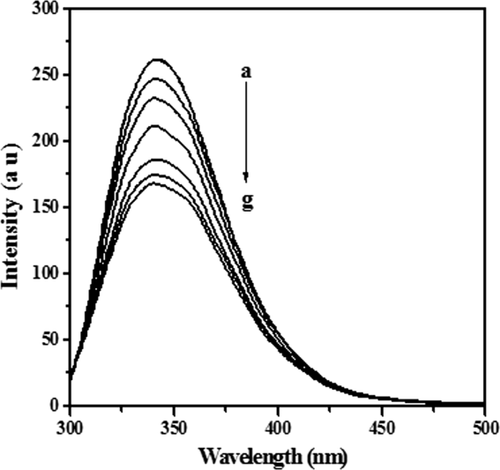
Fluorescence quenching of lysozyme at 340 nm in the absence and presence of [C12−4-C12im]Br2. The concentration of [C12−4-C12im] Br2 (a-g) were 0, 0.9, 1.9, 2.9.3.8, 4.7, 5.6, and 6.5 (10−6M).
The fluorescence quenching method has been extensively used to investigate the protein-surfactant interaction and quenching mechanism. For any process the decrease in fluorescence intensity of a fluorophore refers to fluorescence quenching. Usually the fluorescence quenching is classified as dynamic quenching and static quenching. Dynamic quenching results from collision between the fluorophore and quencher, while static quenching results from the formation of a ground-state complex between the fluorophore and quencher.48
 (1)
(1) (2)
(2)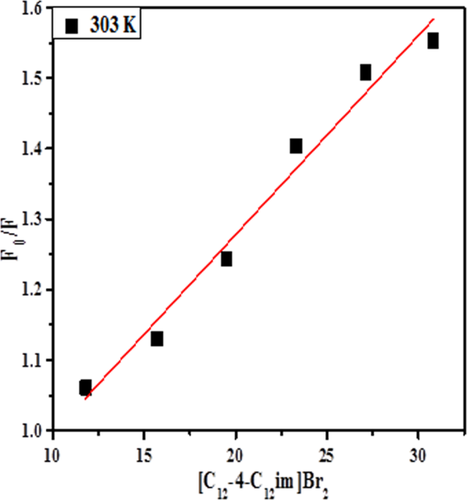
Stern–Volmer plots for the quenching of lysozyme by [C12−4-C12im] Br2.
UV-Visible Absorbance Study
The absorption spectra were recorded to explore the structural change in protein and quenching processes.52 The lysozyme exhibits a characteristic strong absorption band at 220 nm and a week band near 280 nm, which corresponds to n-π* and π-π* transition of the aromatic amino acid residues, Tyr and Trp.53 The change in peak near 220 nm explores the change in secondary structure of protein while peak at 280 nm indicates the change in chromophore microenvironment. The absorption spectra of lysozyme in the presence and absence of [C12−4-C12im]Br2 are shown in Figure 3. The increase in absorbance at 280 nm by increase in [C12−4-C12im]Br2 concentration indicates the formation of a ground state complex, since in dynamic quenching the absorption spectrum of quenching molecule remains unaffected, as it only affects the excited state of quenching molecule. The observed changes in lysozyme absorbance in the presence of different concentrations of [C12−4-C12im]Br2 suggests the occurrence of static quenching interaction between lysozyme and [C12−4-C12im]Br2.54, 55
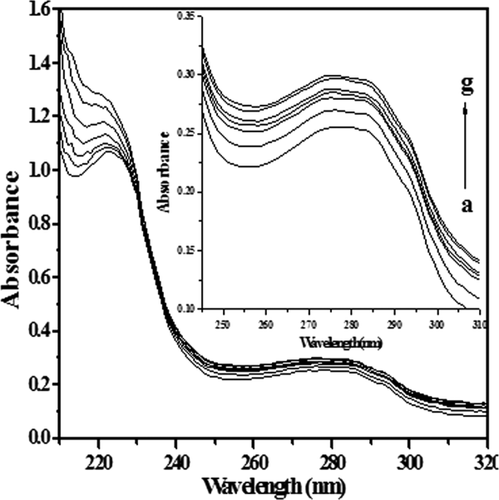
Absorption spectra of free lysozyme (a) and in presence of various concentrations of [C12−4-C12im] Br2 (b-g) 0.9, 1.9, 2.9.3.8, 4.7, 5.6, and 6.5 (10−6M).
Determination of Binding Constant
 (3)
(3) (4)
(4)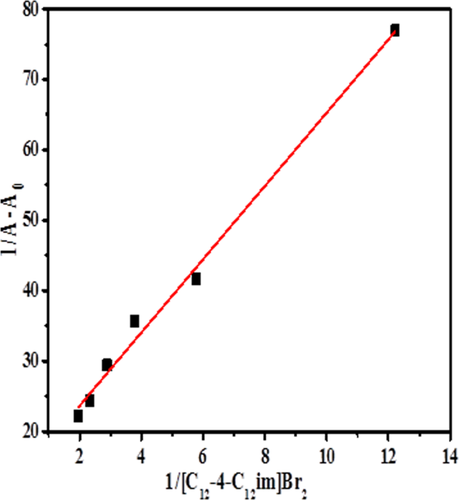
Double reciprocal plot between 1/A − A0 and 1/[C12−4-C12im]Br2.
The negative value of ΔG (−31.35 k J mol−1) show that the lysozyme-[C12−4-C12im] Br2 complexation is energetically favorable.
Time-Resolved Measurements
Time-resolved fluorescence is a very precise technique to describe the quenching mechanism.58 Therefore, the quenching mechanism for the interaction between [C12−4-C12im]Br2 and lysozyme was further confirmed through life time measurements. Figure 5 shows the fluorescence lifetime decay profile of lysozyme in absence and presence of [C12−4-C12im]Br2. The fluorescence decay profile curves are well fitted to biexponential function with relative fluorescence lifetime 1.20 ns (τ1) and 3.06 ns (τ2) which is typical for tryptophan in proteins.59 On increasing the concentration of [C12−4-C12im]Br2, the value of τ1 and τ2 did not vary significantly. Therefore, average fluorescence lifetime (τav) was used for exploring these results.60 From Table 1 it was observed that there is no significant change in average lifetime of lysozyme with the different concentration of [C12−4-C12im]Br2. It was reported that for a static quenching the fluorescence life time of fluorophore will not disturb during complex formation.58 Thus, the result clearly confirmed that the static quenching was dominant in this interaction system. These results are in good agreement with the results of steady state fluorescence and UV-visible study.
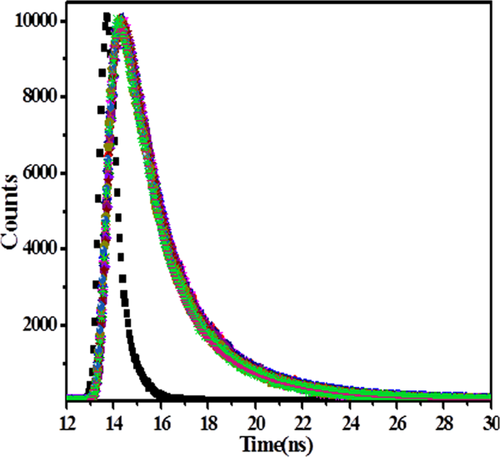
Fluorescence decay profile of lysozyme in absence and presence of different concentration of [C12−4-C12im] Br2 0, 0.9, 1.9, 2.9.3.8, 4.7, 5.6, and 6.5 (10−6M).
| Conc. (10−6M) | τ1 | τ2 | a1 | a2 | χ2 | τav |
|---|---|---|---|---|---|---|
| 0.0 | 1.2029 | 3.0651 | 47.59 | 52.41 | 1.2565 | 2.5758 |
| 0.9 | 1.0953 | 2.9418 | 44.53 | 55.47 | 1.2728 | 2.5169 |
| 1.9 | 1.0869 | 2.9328 | 44.71 | 55.29 | 1.2747 | 2.5071 |
| 2.9 | 1.0587 | 2.9131 | 44.63 | 55.37 | 1.4228 | 2.4930 |
| 3.8 | 1.0026 | 2.9059 | 44.84 | 55.16 | 1.4227 | 2.4890 |
| 4.7 | 0.9967 | 2.9155 | 45.82 | 54.18 | 1.5097 | 2.4852 |
| 5.6 | 0.9777 | 2.8922 | 45.72 | 54.28 | 1.5220 | 2.4679 |
FT-IR Analysis
FT-IR spectroscopy is a highly sensitive technique to study the secondary structural characteristics of proteins.61 Wu et al has employed FT-IR spectroscopy to analysis the secondary changes in BSA upon binding with EQ14-2-14.62 Similarly, Wang et al studied the quantitative analysis of secondary structure of BSA on interacting with NAEn-s-n.63 The infrared spectra of protein give nine characteristic infrared absorption bands. Out of these, the amide-I and amide-II are the most important absorption bands.64-66 The amide-I (1600–1700 cm−1) absorption band is characteristic to the CO stretching vibrations of the peptide linkages which is the characteristic of hydrogen bonding having significantly higher signal intensity whereas amide-II (1500–1600 cm−1) band is in-plane NH bending and CN stretching vibration of peptide group and is quiet as not sensitive to the protein conformation. The important factors that govern the conformational sensitivity of amide bands are the hydrogen bonding and coupling between transition dipoles67. From Figure 6, a peak at 1643 cm−1 was observed in the FT-IR spectra of lysozyme. Also, a decrease in the intensity of amide bands with a small shift in the position of amide I band was observed (from 1643 cm−1 to1640 cm−1) in presence of [C12−4-C12im]Br2. These changes in the infrared spectrum of lysozyme confirmed the conformation change in lysozyme by the addition of [C12−4-C12im]Br2.
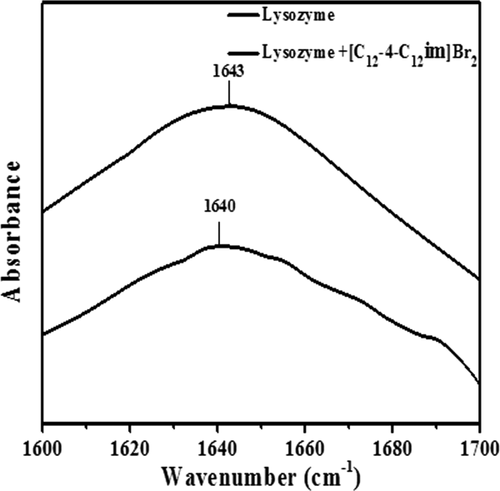
FT-IR spectra of lysozyme in absence and presence of [C12−4-C12im]Br2 at 298 K and pH = 7.40.
The protein secondary structure is determined from the shape of amide I band (Figures 7A and 7B) which reveals the quantitative analysis of the protein secondary structure of lysozyme before and after the interaction with [C12−4-C12im]Br2. The FT-IR spectra were smoothed and their baselines were corrected. The peak positions in spectral region 1700 to 1600 cm−1 of amide I bands are α-helix (1660–1650 cm−1), β-sheet (1638–1610 cm−1), turn (1680–1660 cm−1), random coil (1648–1638 cm−1), and β-antiparallel (1692–1680 cm−1) respectively.

Infrared absorption, curve fitted and deconvoluted spectra of (A) free lysozyme (B) difference spectra of lysozyme-[C12−4-C12im]Br2 complex in the amide I band region (1600–1700 cm−1) at 298 K and pH = 7.40.
The spectral region was deconvoluted by the curve fitting method using the Levenberg-Marquadt algorithm and the major peaks and the protein and the complexes in the region mentioned were resolved. Gaussian function fitting curve was used to calculate the deconvoluted area in the spectral region. The square of the correlation coefficient (R2) for all fittings is 0.9999 for lysozyme and 0.9998 for lysozyme-[C12−4-C12im]Br2 complex. After the interaction of lysozyme with [C12−4-C12im]Br2, a decrease of α-helix was observed from 34% to 29% and β-sheet structure from 28% to 9%, respectively. The random coil structure increases from 16% to 34% and unordered structure from 21% to 28%. The decreased in α-helix and β-sheet structure and increased in the random coil and unordered structure, suggests a conformational change of lysozyme induce by [C12−4-C12im]Br2.29
Molecular Docking Study
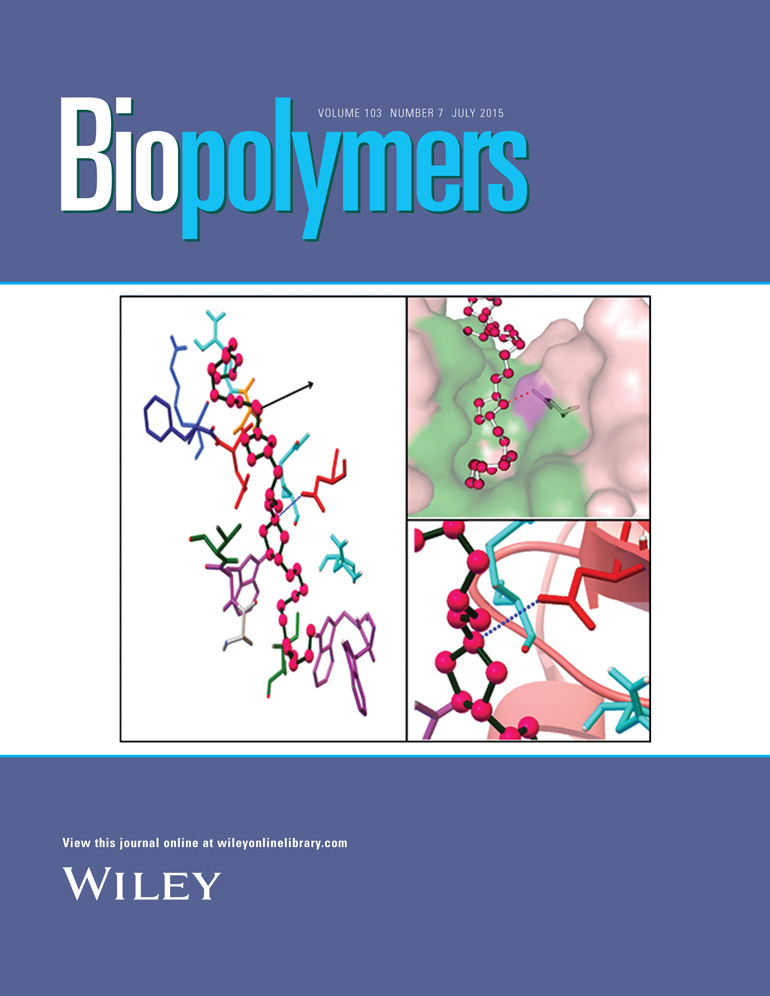
Molecular docking methods have been used to find out the various binding modes and binding sites for lyosozyme-[C12−4-C12im]Br2 interaction system. Lysozyme has two domain α-helices and β-strand domain. The α-domain contains several α-helices (A, B, C, D, and 310). The β domain comprised by β-strands β1 (43–46), β2 (51–54), and β3 (58–60).68, 69 The principal region of [C12−4-C12im]Br2 binding sites of lysozyme is located in loop and β strand domain. The amino acid residues lining this binding site were composed of Lys 33, Phe 34, Glu 35, Ser 36, Asn 37, Asn 52, Gln 57, Asn 59, Trp 62, Trp 63, Ile 98, Ala 107, Trp 108, and Val 109 (Figure 8A). All the Trp residues (Trp 62, Trp 63, and Trp 108) are located at the active site and are important for the enzymatic activity of lysozyme.70 The involvement of Trp residues in the protein ligand complex indicates that [C12−4-C12im]Br2 binds to the active site of lysozyme. The conformation with the lowest binding energy (−3.49 kcal/mol) was used for analysis. The more negative the relative binding energy, the more potent the binding of ligand to protein. The essential driving force of [C12−4-C12im]Br2 binding to this site was hydrophobic interaction (Figure 8B). Additionally, docking results reveal that there is one hydrogen bond between [C12−4-C12im]Br2 and Asn 52 amino acid residue of lysozyme with the bond length of 3.005 Å (Figure 8C).
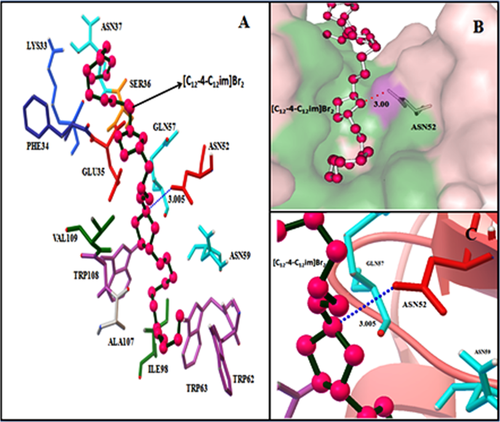
(A) Surrounding amino acid residue of lysozyme within 5 A° from docked [C12−4-C12im]Br2 (pink, green). (B) Surface representation of hydrophobic cavity of lysozyme with docked [C12−4-C12im]Br2 (ball and stick with pink) and their interaction (green). (C) Representation of hydrogen bonding with dash(blue) between [C12−4-C12im]Br2 and ASN52 residue.
Molecular Dynamic Simulation Study
The lowest docked energy conformation of lysozyme-[C12−4-C12im]Br2 complex was selected for MD simulation. To estimate the stability of this conformer the properties, root mean square deviation (RMSD), root mean square fluctuation (RMSF) and radius of gyration (Rg) were determined. The RMSD, Rg, and RMSF values of the atoms in the lysozyme with and without [C12−4-C12im]Br2 were determined against the simulation time scale of 4000 ps. The RMSD values of the atoms in pure lysozyme and the lysozyme-[C12−4-C12im]Br2 complex was plotted from 0 to 4000 ps, as shown in Figure 9A. From the figure it can be seen that the RMSD values for free lysozyme and the lysozyme-[C12−4-C12im]Br2 complex, reached equilibrium and oscillates around an average value after 3000 ps time and remained stable until the end of the simulation. The observed values of RMSD for free and bound lysozyme are found to be 0.184 ± 0.01 and 0.132 ± 0.01 nm respectively. The lesser value of RMSD of bound lysozyme as compared to that of free lysozyme suggests the conformational change in the lysozyme after the binding with [C12−4-C12im]Br2.71 In addition, the Rg values were also measured for overall structural dimension of the protein.72 The calculated Rg values for free lysozyme and the lyosozyme-[C12−4-C12im]Br2 complex were found to be 1.3436 nm and 1.3493 nm, respectively and presented in Figure 9B. The Rg values for free and bound lysozyme are highly closer to each other, suggesting that there is no such structural unfolding is induced by [C12−4-C12im]Br2 after binding with the protein 72 Therefore, to confirm the actual conformational change in lysozyme the solvent accessible surface area (SASA) variation in the time interval of 4000 ps in presence and absence of [C12−4-C12im]Br2 were analyzed and is shown in Figure 10A. It is obvious from the figure that SASA of lysozyme when bound to [C12−4-C12im]Br2 is more and can be attributed to the reduction of intra molecular hydrogen bonds of lysozyme. This again confirms the unfolding of lysozyme after interacting with [C12−4-C12im]Br2.73 This result is in good agreement with FT-IR results.
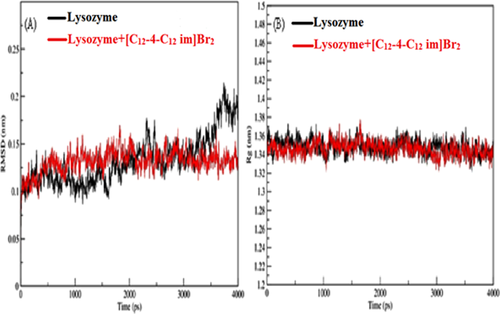
(A) RMSD (nm) value of lyzosyme and lyzosyme-[C12−4-C12im]Br2 complex. (B) Time dependence radiation of gyration (Rg) of lyzosyme and lyzosyme-[C12−4-C12im]Br2 complex.
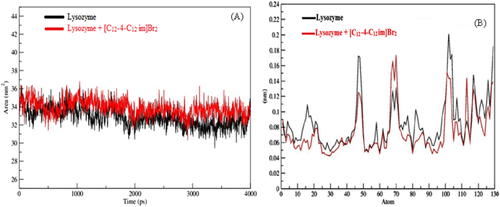
SASA (A) and RMSF (B) values of lyzosyme and lyzosyme-[C12−4-C12im]Br2 complex.
The values of RMSF of free lysozyme and the lysozyme-[C12−4-C12im]Br2 complex was also observed from MD simulation and presented in Figure 10B. The RMSF values enables to analyze the local protein mobility which were plotted against the residue numbers based on the 4000 ps trajectory data. Our result clearly shows that α helices domain and their subdomain (A, C and D) have highest while β strand domain and subdomain B of α helix shows lowest fluctuation, suggesting that the [C12−4-C12im]Br2 bind to residues Lys 33, Phe 34, Glu 35, Ser 36, Asn 37, Asn 52, Gln 57, Asn 59, Trp 62, Trp 63, Ile 98, Ala 107, Trp 108, and Val 109. Thus, the principal region of surfactant binding sites of lysozyme is located in loop and β strand domain and mainly bind to Trp63, Trp62, and Trp108, which is in good agreement with docking results.
CONCLUSION
- [C12−4-C12im]Br2 quenches the fluorophore of lysozyme through static pathway. It shows strong binding with binding constant (K) 2.54 × 10⁻⁵M at 298 K.
- Main forces of interaction were hydrophobic interactions along with some weak electrostatic interactions and hydrogen bonds. The interaction process was spontaneous in nature.
- FT-IR data suggests that [C12−4-C12im]Br2 causes a decrease in the α-helix and β-sheet from 34% to 29% and from 28% to 9% respectively, confirms a conformational change in lysozyme by [C12−4-C12im]Br2.
- Molecular docking results confirms that [C12−4-C12im]Br2 binds to Lys 33, Phe 34, Glu 35, Ser 36, Asn 37, Asn 52, Gln 57, Asn 59, Trp 62, Trp 63, Ile 98, Ala 107, Trp 108, and Val 109 residues mainly through hydrophobic interactions. Furthermore, it is also proves the presence of hydrogen bond between [C12−4-C12im]Br2 and Asn 52 amino acid residue.
- Simulation results shows that the lysozyme-[C12−4-C12im]Br2 complex reaches equilibrium state at around 3 ns. The RMSF values shows that [C12−4-C12im]Br2 bind to β strand domain, subdomain B of α helix and loop of lysozyme which were in agreement with docking results. In addition, the SASA results shows the reduction in the hydrogen bonds of the lysozyme after the binding with [C12−4-C12im]Br2.


