Maternal residential exposure to specific agricultural pesticide active ingredients and birth defects in a 2003–2005 North Carolina birth cohort
Abstract
Background
Previously we observed elevated odds ratios (ORs) for total pesticide exposure and 10 birth defects: three congenital heart defects and structural defects affecting the gastrointestinal, genitourinary and musculoskeletal systems. This analysis examines association of those defects with exposure to seven commonly applied pesticide active ingredients.
Methods
Cases were live-born singleton infants from the North Carolina Birth Defects Monitoring Program linked to birth records for 2003–2005; noncases served as controls (total n = 304,906). Pesticide active ingredient exposure was assigned using a previously constructed metric based on crops within 500 m of residence, dates of pregnancy, and likely chemical application dates for each pesticide-crop combination. ORs (95% CI) were estimated with logistic regression for categories of exposure compared to unexposed. Models were adjusted for maternal race/ethnicity, age at delivery, education, marital status, and smoking status.
Results
Associations varied by birth defect and pesticide combinations. For example, hypospadias was positively associated with exposures to 2,4-D (OR50th to <90th percentile: 1.39 [1.18, 1.64]), mepiquat (OR50th to <90th percentile: 1.10 [0.90, 1.34]), paraquat (OR50th to <90th: 1.14 [0.93, 1.39]), and pendimethalin (OR50th to <90th: 1.21 [1.01, 1.44]), but not S-metolachlor (OR50th to <90th: 1.00 [0.81, 1.22]). Whereas atrial septal defects were positively associated with higher levels of exposure to glyphosate, cyhalothrin, S-metolachlor, mepiquat, and pendimethalin (ORs ranged from 1.22 to 1.35 for 50th to <90th exposures, and 1.72 to 2.09 for >90th exposures); associations with paraquat were null or inconsistent (OR 50th to <90th: 1.05 (0.87, 1.27).
Conclusion
Our results suggest differing patterns of association for birth defects with residential exposure to seven pesticide active ingredients in North Carolina.
1 INTRODUCTION
Birth defects occur in 3 % of live births (Mai et al., 2013), are a leading cause of infant mortality, and contribute to continuing health problems throughout development and the life-course (Decoufle, Boyle, Paulozzi, & Lary, 2001; Matthews & MacDorman, 2013). While risk factors for most birth defects are largely unknown and vary by defect, maternal characteristics, medications, genetics, and environmental factors have all been linked to development of birth defects (CDC, 2018). Understanding the factors that contribute to development of birth defects can lead to better interventions and public health protection.
Pesticide exposures before or during pregnancy are one of the environmental factors that have been associated with birth defects (Agopian, Cai, Langlois, Canfield, & Lupo, 2013; Agopian, Langlois, Cai, Canfield, & Lupo, 2013; Agopian, Lupo, Canfield, & Langlois, 2013; Carmichael et al., 2013; Carmichael et al., 2014; Garry et al., 2002; Heeren, Tyler, & Mandeya, 2003; Kielb et al., 2014; Kristensen, Irgens, Andersen, Bye, & Sundheim, 1997; Meyer et al., 2006; Ochoa-Acuna & Carbajo, 2009; Rull, Ritz, & Shaw, 2006; Shaw et al., 2014; Shaw, Wasserman, O'Malley, Nelson, & Jackson, 1999). There are several ways in which pesticide exposure is ascertained or estimated, including: questionnaires or surveys on parental occupation (Garry et al., 2002; Kristensen et al., 1997; Shaw et al., 1999); self-reported pesticide use at home or work (Kielb et al., 2014; Shaw et al., 1999); biomarkers of exposure collected during pregnancy (Barr et al., 2010; Bradman et al., 2003; Bradman et al., 1997); pesticide concentrations measured in dust samples from home environments; county-level pesticide use estimates; residential proximity to agricultural cropland; and/or metrics that employ combinations of agricultural and pesticide use data (Carmichael et al., 2013; Carmichael et al., 2014; Rappazzo et al., 2016; Rull et al., 2006; Rull & Ritz, 2003; Shaw et al., 2014; Yang et al., 2014). Several of these metrics may be easier and less costly to calculate (e.g., county-level pesticide use, proximity to residential cropland), but may lack spatial or temporal specificity. Others (e.g., biomarkers, dust samples) to our knowledge have not been used in large scale studies of birth defects due to the difficulty and expense of acquiring these types of samples. In addition, methods that employ occupational assessment and proximity to cropland estimation lack details such as timing of exposure and information on specific pesticides/active ingredients (Agopian, Cai, et al., 2013; Agopian, Langlois, et al., 2013; Meyer et al., 2006; Ochoa-Acuna & Carbajo, 2009).
In previous work (Rappazzo et al., 2016), we used a novel metric of residential proximity to agricultural pesticides that balances computational difficulty and expense with information on temporal and spatial specificity of pesticide application and timing of exposure (Warren et al., 2014). We observed elevated odds ratios (ORs) for total pesticide exposure and 10 birth defects, including three congenital heart defects and structural defects affecting the gastrointestinal, genitourinary, and musculoskeletal systems; ORs for highest exposure level compared to lowest ranged from 1.27 to 7.51 for these defects, with most being between 1.27 and 2.22 (Rappazzo et al., 2016). However, the total pesticide metric comprised more than 100 pesticide active ingredients, precluding conclusions on potential contributions of specific pesticide active ingredients.
In this analysis, we expand on the previous work to include estimated exposure to specific pesticide active ingredients that are commonly used in North Carolina. Exposure to these active ingredients was estimated through a combined metric of residential proximity to crops and pesticide use data, and associations with the noted birth defects were calculated.
2 METHODS
2.1 Study population
The study population for our analysis was previously described (Rappazzo et al., 2016; Warren et al., 2014), and is sourced from the NC State Center for Health Statistics. Briefly, the base population was 335,729 geocoded singleton live births in North Carolina from January 1, 2003 to December 31, 2005; births were restricted to those with residence in NC (excluded n = 23,829), gestational age between 20 and 45 weeks (excluded n = 84), and having data on all demographic characteristics of interest (excluded n = 6,910), leaving an analytic population of 304,906 singleton live births (Rappazzo et al., 2016; Warren et al., 2014).
2.2 Outcomes
Data from the NC Birth Defects Monitoring Program (NCBDMP), an active, population-based surveillance system that collects information on medically diagnosed birth defects from delivery hospitals, pediatric and tertiary care hospitals, and other specialty facilities through the first year of life (NCSCHS, 2018) was linked to birth record information to identify cases (Rappazzo et al., 2016; Warren et al., 2014). In our previous analysis, 10 birth defects (of 42 examined) had a positive association with total pesticide exposure (Rappazzo et al., 2016). These birth defects are used as outcomes here: atrial septal defect (ASD, secundum atrial septal defects, separate from patent foramen ovale), patent ductus arteriosus (PDA; >2,500 g birth weight), hypoplastic left heart syndrome (HLHS), tracheal esophageal fistula (TEF), hypertrophic pyloric stenosis (HPS), Hirschsprung's disease, hypospadias, upper and lower limb deficiencies, and choanal atresia.
2.3 Exposure
Development of the pesticide metric we used as the exposure variable was described previously (Rappazzo et al., 2016; Warren et al., 2014). Briefly, NC crop maps were available for years 2002 and 2008–2010; crop maps for years 2003–2005 were extrapolated from these maps (Warren et al., 2014). A 500 m (m) buffer was created around each residence at birth and the amount of crop acreage within the buffer was calculated (Warren et al., 2014) Pesticide application data from the National Agricultural Statistics Service were combined with earliest planting and last harvesting dates of each crop and active chemical half-life data to create a probable window of application and to determine if that window overlaps with 1 month before conception through the 3rd month of pregnancy (Warren et al., 2014). Finally, quantities and types of pesticide active ingredients applied during the relevant window in each individual's buffer zone were estimated (Warren et al., 2014). Pesticide exposures were estimated separately based on the individual crop to which they were applied; that is, multiple pesticides may be applied to the same crop during a narrow time window. Similarly, the same pesticide may be applied to multiple crops being cultivated near an individual's residence. Thus, for each study subject, we calculated exposure to a pesticide as the sum of the pounds applied to any crop in the 500 m buffer during the exposure window. From 103 possible pesticide active ingredients, we chose to examine those with over 100,000 application instances, which allows for variability in exposure levels beyond “exposed v. unexposed” for most analyses. Because pesticide exposures were estimated based on crop-type some individuals had multiple exposure estimates for a single pesticide. Seven specific pesticide active ingredients met the application criterion: 2,4-Dichlorophenoxyacetic acid (non dimethyl salt, 2,4-D), mepiquat chloride, pendimethalin, S-metolachlor, Lambda cyhalothrin, glyphosate, and paraquat. With the exception of cyhalothrin, which is an insecticide, the remaining six pesticide active ingredients are herbicidal. Unexposed women either had no crops within their buffer, or the examined pesticides and/or the relevant window of pregnancy occurred during times when no pesticide applications were expected to occur.
2.4 Analysis
Analyses followed those performed in previous work (Rappazzo et al., 2016). Briefly, ORs and 95% confidence intervals (CI) were estimated using logistic regression models. In lieu of testing null hypotheses (OR = 1), we examined patterns and precision of estimates. Cases were those infants with birth defect diagnoses from the NCBDMP and were categorized based on the Centers for Disease Control and Prevention/British Pediatric Association coding system. Cases were examined as “any” case as opposed to “isolated” cases (i.e., only having a single birth defect), as we did not observe substantial differences between these in previous work (Rappazzo et al., 2016). Controls were identified from birth certificates and included any infant free of diagnosed birth defects. For hypospadias, analyses included only male infants. Exposures were investigated as either a priori specified categories of exposed (<10th percentile, 10th to <50th percentile, 50th to <90th percentile, and ≥90th percentile) versus unexposed, or as collapsed versions of this (unexposed, <50th percentile exposed, ≥50th percentile exposed, or exposed vs. unexposed), as appropriate, to ensure that each exposure category had at least five cases for each birth defect. Confounders, identified a priori through expert knowledge and literature review, included: maternal race/ethnicity (non-Hispanic white, non-Hispanic Black, Hispanic, Other), maternal education (less than high school (<HS), high school graduate (HS), and greater than high school (>HS)), marital status (married and unmarried), maternal age (<20, 20 to <35, ≥35 years), and smoking status during pregnancy (ever and never). Individual birth defects were examined as outcomes in separate models with each pesticide active ingredient.
As sensitivity analyses, we examined potential confounding by co-occurring pesticides. This was done using logistic regression models including two pesticide active ingredients for all pesticide-birth defect combinations, estimating the effect of one while adjusting for the other. Given the high correlation between the pesticide active ingredients and the potential for small numbers of exposed cases in any given category of multiple pesticide exposure, these results should be interpreted with caution. In addition, we performed Bayesian logistic regression analogues of all models with a fixed shrinkage prior specification for ASD, PDA, HPS, and hypospadias (other defects not included due to limited case numbers), including all examined pesticide active ingredients. In brief, regression coefficients are assumed to have a weakly informative multivariate normal prior specification, which is similar to the P1 model in MacLehose, Dunson, Herring, and Hoppin (2007). All models are estimated via an MCMC Gibbs sampling algorithm with default prior values specified by the SAS programming software. We run the sampling algorithm in each model for 10,000 iterations and exclude the first 2,000 as a burn-in period. We choose this modeling framework to compare the potential of unstable parameter estimates from the MLE models in our highly correlated predictor setting.
All analyses were performed in SAS 9.4 (SAS Institute, Cary NC) and figures were created in R 3.4.0 and Rstudio 1.0.143 with ggplot2 (R. C. Team, 2017; R. S. Team, 2015; Wickham, 2009). This research was approved by the University of North Carolina at Chapel Hill's Office of Human Research Ethics.
3 RESULTS
Distributions of demographic factors by case status are presented in Table 1. There were 298,548 controls (152,402 male controls for hypospadias) in our study. Case numbers ranged from over 1,000 for ASD and PDA to 39 for lower limb defects. Distributions across race/ethnicity were similar though there were fewer hypospadias cases with Hispanic mothers, and more cases of ASD and Hirschsprung's were identified as being Black. Male infants predominated in both HPS and Hirschsprung's; cases with Hirschsprung's were also more likely to be born to multiparous individuals than controls. Marital status was also different (higher percent unmarried) for mothers of cases with Hirschsprung's and limb defects. Education levels were similar across cases and controls, while mothers identifying as smokers were more likely to deliver infants with limb defects. In addition, case infants for ASD, PDA, hypospadias, TEF, choanal atresia, and lower limb defects were more likely than control individuals to have older mothers.
| Control | ASD | PDA | HPS | Hypospadias | HLHS | TEF | Choanal atresia | Hirschsprungs | Upper limb | Lower limb | |
|---|---|---|---|---|---|---|---|---|---|---|---|
| N | 298,548 | 1,020 | 1,364 | 592 | 936 | 75 | 84 | 50 | 77 | 84 | 39 |
| Race/ethnicity | |||||||||||
| White, non-Hispanic | 179,856 (60) | 541 (53) | 796 (58) | 396 (67) | 670 (72) | 47 (63) | 54 (64) | 33 (66) | 34 (44) | 51 (61) | 20 (51) |
| Black, non-Hispanic | 65,284 (22) | 303 (30) | 339 (25) | 71 (12) | 194 (21) | 18 (24) | 18 (21) | 12 (24) | 34 (44) | 15 (18) | 11 (28) |
| Hispanic | 41,527 (14) | 135 (13) | 186 (14) | 102 (17) | 48 (5) | 10 (13) | 11 (13) | 5 (10) | 8 (10) | 14 (17) | 6 (15) |
| Other, non-Hispanic | 11,881 (4) | 41 (4) | 43 (3) | 23 (4) | 24 (3) | 0 (0) | 1 (1) | 0 (0) | 1 (1) | 4 (5) | 2 (5) |
| Sex | |||||||||||
| Female | 146,146 (49) | 494 (48) | 641 (47) | 129 (22) | 0 (0)a | 32 (43) | 34 (40) | 24 (48) | 20 (26) | 38 (45) | 18 (46) |
| Male | 152,402 (51) | 526 (52) | 723 (53) | 463 (78) | 936 (100) | 43 (57) | 50 (60) | 26 (52) | 57 (74) | 46 (55) | 21 (54) |
| Maternal education | |||||||||||
| Greater than high school | 146,522 (49) | 439 (43) | 676 (50) | 200 (34) | 526 (56) | 30 (40) | 40 (48) | 27 (54) | 30 (39) | 34 (40) | 14 (36) |
| High school | 85,791 (29) | 306 (30) | 393 (29) | 216 (36) | 261 (28) | 26 (35) | 27 (32) | 13 (26) | 28 (36) | 25 (30) | 12 (31) |
| Less than high school | 66,235 (22) | 275 (27) | 295 (22) | 176 (30) | 149 (16) | 19 (25) | 17 (20) | 10 (20) | 19 (25) | 25 (30) | 13 (33) |
| Marital status | |||||||||||
| Married | 191,015 (64) | 621 (61) | 881 (65) | 330 (56) | 620 (66) | 44 (59) | 49 (58) | 34 (68) | 39 (51) | 46 (55) | 18 (46) |
| Unmarried | 107,533 (36) | 399 (39) | 483 (35) | 262 (44) | 316 (34) | 31 (41) | 35 (42) | 16 (32) | 38 (49) | 38 (45) | 21 (54) |
| Smoking status | |||||||||||
| Nonsmoker | 261,483 (88) | 877 (86) | 1,226 (90) | 474 (80) | 831 (89) | 70 (93) | 69 (82) | 43 (86) | 65 (84) | 59 (70) | 24 (62) |
| Smoker | 37,065 (12) | 143 (14) | 138 (10) | 118 (20) | 105 (11) | 5 (7) | 15 (18) | 7 (14) | 12 (16) | 25 (30) | 15 (38) |
| Diabetes status | |||||||||||
| No | 290,340 (97) | 968 (95) | 1,278 (94) | 569 (96) | 907 (97) | 73 (97) | 79 (94) | 46 (92) | 77 (100) | 83 (99) | 36 (92) |
| Yes | 8,208 (3) | 52 (5) | 86 (6) | 23 (4) | 29 (3) | 2 (3) | 5 (6) | 4 (8) | 0 (0) | 1 (1) | 3 (8) |
| Parity | |||||||||||
| Primiparous | 123,055 (41) | 379 (37) | 525 (38) | 242 (41) | 458 (49) | 31 (41) | 39 (46) | 20 (40) | 21 (27) | 42 (50) | 18 (46) |
| Multiparous | 175,493 (59) | 641 (63) | 839 (62) | 350 (59) | 478 (51) | 44 (59) | 45 (54) | 30 (60) | 56 (73) | 42 (50) | 21 (54) |
| Age group | |||||||||||
| Less than 20 | 33,851 (11) | 115 (11) | 131 (10) | 100 (17) | 100 (11) | 11 (15) | 8 (10) | 4 (8) | 7 (9) | 8 (10) | 6 (15) |
| 20 - less than 35 | 228,261 (76) | 745 (73) | 999 (73) | 450 (76) | 697 (74) | 57 (76) | 60 (71) | 37 (74) | 63 (82) | 68 (81) | 27 (69) |
| 35+ | 36,436 (12) | 160 (16) | 234 (17) | 42 (7) | 139 (15) | 7 (9) | 16 (19) | 9 (18) | 7 (9) | 8 (10) | 6 (15) |
- ASD = atrial septal defects; HPS = hypertrophic pyloric stenosis; HLHS = hypoplastic left heart syndrome; PDA = patent ductus arteriosus; TEF = tracheal esophageal fistula.
- a Hypospadias only occurs in male infants, so female infants were not used in this analysis.
Exposures to pesticide active ingredients were not appreciably different by demographic factors (Supporting Information Table S.1). Generally, over 50% of births fell into the unexposed categories, except for paraquat where the proportion of unexposed individuals was generally less than 20%, due to ubiquitous use as a commercial weed killer (EPA, 2018; Tables 2A and 2B). For two birth defects, the numbers of unexposed cases for paraquat were below five (choanal atresia and lower limb defects), therefore results for those models should be viewed cautiously. Pesticide active ingredient correlations varied from low to high, with Spearman's correlation coefficients ranging from 0.17 for 2,4-D and cyhalothrin to 0.78 for cyhalothrin and pendimethalin, though the majority were in the moderate (0.4–0.7) to high (>0.7) range (Table 3); correlations were similar using either five- or three-category exposure levels.
| Pesticide active ingredient | Exposure level | Control | ASD | PDA | HPS | Hypospadias |
|---|---|---|---|---|---|---|
| N | 298,548 | 1,020 | 1,364 | 592 | 936 | |
| 2,4-D | Unexposed | 227,481 (76) | 750 (74) | 964 (71) | 413 (70) | 676 (72) |
| <10th percentile | 9,858 (3) | 34 (3) | 48 (4) | 20 (3) | 36 (4) | |
| 10th to <50th | 25,732 (9) | 76 (7) | 138 (10) | 54 (9) | 95 (10) | |
| 50th to <90th | 28,399 (10) | 113 (11) | 165 (12) | 80 (14) | 98 (10) | |
| ≥90th | 7,078 (2) | 47 (5) | 49 (4) | 25 (4) | 31 (3) | |
| Glyphosate | Unexposed | 165,996 (56) | 514 (50) | 718 (53) | 275 (46) | 493 (53) |
| <10th percentile | 13,282 (4) | 45 (4) | 65 (5) | 27 (5) | 45 (5) | |
| 10th to <50th | 53,432 (18) | 186 (18) | 252 (18) | 122 (21) | 163 (17) | |
| 50th to <90th | 52,642 (18) | 203 (20) | 257 (19) | 124 (21) | 182 (19) | |
| ≥90th | 13,196 (4) | 72 (7) | 72 (5) | 44 (7) | 53 (6) | |
| Cyhalothrin | Unexposed | 154,407 (52) | 472 (46) | 678 (50) | 260 (44) | 464 (50) |
| <10th percentile | 21,388 (7) | 63 (6) | 101 (7) | 42 (7) | 59 (6) | |
| 10th to <50th | 50,256 (17) | 177 (17) | 223 (16) | 101 (17) | 163 (17) | |
| 50th to <90th | 58,158 (19) | 226 (22) | 283 (21) | 149 (25) | 195 (21) | |
| ≥90th | 14,339 (5) | 82 (8) | 79 (6) | 40 (7) | 55 (6) | |
| Mepiquat chloride | Unexposed | 206,678 (69) | 666 (65) | 916 (67) | 364 (61) | 634 (68) |
| <10th percentile | 15,181 (5) | 39 (4) | 72 (5) | 31 (5) | 41 (4) | |
| 10th to <50th | 30,687 (10) | 95 (9) | 129 (9) | 70 (12) | 103 (11) | |
| 50th to <90th | 36,864 (12) | 160 (16) | 189 (14) | 98 (17) | 121 (13) | |
| ≥90th | 9,138 (3) | 60 (6) | 58 (4) | 29 (5) | 37 (4) | |
| S, Metolachlor | Unexposed | 208,762 (70) | 668 (65) | 915 (67) | 370 (63) | 636 (68) |
| <10th percentile | 8,860 (3) | 23 (2) | 41 (3) | 21 (4) | 39 (4) | |
| 10th to <50th | 36,067 (12) | 131 (13) | 174 (13) | 75 (13) | 113 (12) | |
| 50th to <90th | 35,908 (12) | 155 (15) | 192 (14) | 97 (16) | 110 (12) | |
| ≥90th | 8,951 (3) | 43 (4) | 42 (3) | 29 (5) | 38 (4) | |
| Paraquat | Unexposed | 50,214 (17) | 165 (16) | 215 (16) | 82 (14) | 137 (15) |
| <10th percentile | 22,599 (8) | 91 (9) | 104 (8) | 34 (6) | 62 (7) | |
| 10th to <50th | 101,702 (34) | 318 (31) | 460 (34) | 175 (30) | 317 (34) | |
| 50th to <90th | 99,300 (33) | 331 (32) | 451 (33) | 219 (37) | 331 (35) | |
| ≥90th | 24,733 (8) | 115 (11) | 134 (10) | 82 (14) | 89 (10) | |
| Pendimethalin | Unexposed | 190,766 (64) | 583 (57) | 813 (60) | 327 (55) | 568 (61) |
| <10th percentile | 10,327 (3) | 34 (3) | 50 (4) | 19 (3) | 29 (3) | |
| 10th to <50th | 43,357 (15) | 154 (15) | 194 (14) | 101 (17) | 146 (16) | |
| 50th to <90th | 43,364 (15) | 178 (17) | 233 (17) | 113 (19) | 155 (17) | |
| ≥90th | 10,734 (4) | 71 (7) | 74 (5) | 32 (5) | 38 (4) |
- ASD = atrial septal defects; HPS = hypertrophic pyloric stenosis; HLHS = hypoplastic left heart syndrome; PDA = patent ductus arteriosus; TEF = tracheal esophageal fistula.
| Pesticide active ingredient | Exposure level | HLHS | TEF | Choanal atresia | Hirschsprung's | Upper limb defects | Lower limb defects |
|---|---|---|---|---|---|---|---|
| N | 75 | 84 | 50 | 77 | 84 | 39 | |
| 2,4-D | Unexposed | 56 (75) | 67 (80) | 31 (62) | 55 (71) | 61 (73) | 23 (59) |
| <50th percentile | 8 (11) | 9 (11) | 9 (18) | 9 (12) | 13 (15) | 7 (18) | |
| ≥50th | 11 (15) | 8 (10) | 10 (20) | 13 (17) | 10 (12) | 9 (23) | |
| Glyphosate | Unexposed | 38 (51) | 42 (50) | 24 (48) | 34 (44) | 42 (50) | 15 (38) |
| <50th percentile | 19 (25) | 26 (31) | 13 (26) | 24 (31) | 16 (19) | 7 (18) | |
| ≥50th | 18 (24) | 16 (19) | 13 (26) | 19 (25) | 26 (31) | 17 (44) | |
| Cyhalothrin | Unexposed | 36 (48) | 41 (49) | 26 (52) | 29 (38) | 36 (43) | 13 (33) |
| <50th percentile | 17 (23) | 21 (25) | 9 (18) | 22 (29) | 16 (19) | 8 (21) | |
| ≥50th | 22 (29) | 22 (26) | 15 (30) | 26 (34) | 32 (38) | 18 (46) | |
| Mepiquat chloride | Unexposed | 45 (60) | 57 (68) | 35 (70) | 44 (57) | 54 (64) | 22 (56) |
| <50th percentile | 13 (17) | 12 (14) | 4 (8)a | 14 (18) | 10 (12) | 6 (15) | |
| ≥50th | 17 (23) | 15 (18) | 11 (22) | 19 (25) | 20 (24) | 11 (28) | |
| S, Metolachlor | Unexposed | 44 (59) | 58 (69) | 29 (58) | 49 (64) | 54 (64) | 19 (49) |
| <50th percentile | 14 (19) | 16 (19) | 9 (18) | 10 (13) | 14 (17) | 7 (18) | |
| ≥50th | 17 (23) | 10 (12) | 12 (24) | 18 (23) | 16 (19) | 13 (33) | |
| Paraquat | Unexposed | 10 (13) | 7 (8) | 3 (6) | 11 (14) | 13 (15) | 2 (5) |
| <50th percentile | 29 (39) | 39 (46) | 31 (62) | 25 (32) | 27 (32) | 14 (36) | |
| ≥50th | 36 (48) | 38 (45) | 16 (32) | 41 (53) | 44 (52) | 23 (59) | |
| Pendimethalin | Unexposed | 42 (56) | 53 (63) | 31 (62) | 37 (48) | 53 (63) | 20 (51) |
| <50th percentile | 12 (16) | 17 (20) | 8 (16) | 19 (25) | 8 (10) | 5 (13) | |
| ≥50th | 21 (28) | 14 (17) | 11 (22) | 21 (27) | 23 (27) | 14 (36) |
- ASD = atrial septal defects; HPS = hypertrophic pyloric stenosis; HLHS = hypoplastic left heart syndrome; PDA = patent ductus arteriosus; TEF = tracheal esophageal fistula.
- a Exposure categories were further collapsed to unexposed/exposed for analysis.
| Glyphosate | Cyhalothrin | Mepiquat chloride | S, Metolachlor | Paraquat | Pendimethalin | |
|---|---|---|---|---|---|---|
| 2,4-D | 0.44 | 0.17 | 0.31 | 0.67 | 0.31 | 0.28 |
| Glyphosate | 1 | 0.60 | 0.24 | 0.53 | 0.50 | 0.71 |
| Cyhalothrin | 1 | 0.71 | 0.31 | 0.68 | 0.78 | |
| Mepiquat chloride | 1 | 0.49 | 0.55 | 0.56 | ||
| S, Metolachlor | 1 | 0.41 | 0.40 | |||
| Paraquat | 1 | 0.55 |
Associations with pesticide active ingredients varied across those birth defects examined with five categories of exposure, though with many positive associations observed (Supporting Information Table S.2). ORs for ASD were elevated at the highest level of exposure (≥90th percentile) for all examined pesticide active ingredients, though patterns at lower levels of exposure were not consistent across different pesticides (Figure 1). Some associations exhibited monotonic increasing associations with increasing exposure level (cyhalothrin, pendimethalin), while others appeared to have threshold effects or were nonlinear with generally elevated ORs (2,4-D, glyphosate, mepiquat, metolachlor). Paraquat exhibited a U-shaped response, with elevated ORs only for the <10th and ≥90th exposure levels. When adjusting for other pesticide active ingredients, associations with ASD are attenuated toward the null at the lowest levels of exposure across several pesticide active ingredients (Supporting Information Table S.3, Supporting Information Figure S.1). Associations with 2,4-D and pendimethalin remain robust to co-exposure adjustment, while ORs for metolachlor and paraquat move toward the null at all levels. Associations for cyhalothrin and glyphosate are robust to adjustment, except with pesticide active ingredients with which they have a high correlation (e.g., cyhalothrin and mepiquat have a correlation of ~0.70).
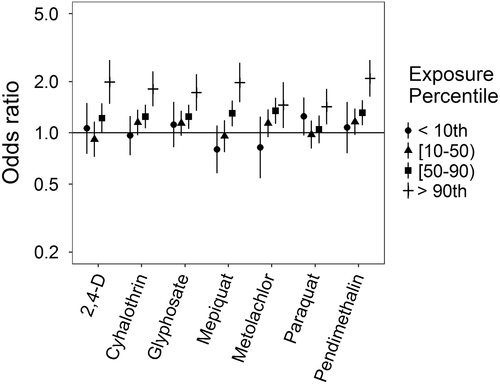
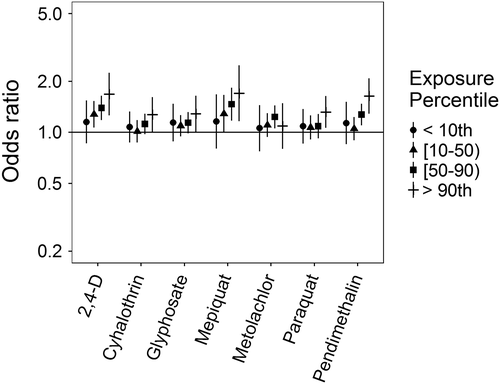
Associations for PDA were somewhat different (Figure 2): no evidence of an association for metolachlor was observed; ORs with paraquat were elevated only at the highest exposure level; ORs for cyhalothrin, glyphosate, and pendimethalin showed either slight elevations from the null or apparent threshold effects; and monotonic increases in the ORs were observed for mepiquat and 2,4-D. With adjustment for an additional pesticide active ingredient, associations for mepiquat were attenuated except at the highest exposure level, while 2,4-D and pendimethalin remained largely unchanged (Supporting Information Table S.4, Supporting Information Figure S.2). With HPS, ORs were all either elevated or showing threshold effects, though patterns with increasing exposure levels differed across pesticide active ingredients (Figure 3). HPS ORs were largely robust to co-pesticide adjustment, with the potential exception of cyhalothrin and those active ingredients with which it had a high correlation (Supporting Information Table S.5, Supporting Information Figure S.3). Associations for hypospadias were similar to those for PDA, with mepiquat and 2,4-D having increasing ORs with increasing exposure levels (Figure 4). Associations for hypospadias with pendimethalin and mepiquat were attenuated toward the null with adjustment for an additional pesticide active ingredient, while associations for metolachlor at the lowest and highest exposure levels moved away from the null, and associations for 2,4-D cyhalothrin, and paraquat remained largely unchanged (Supporting Information Table S.6, Supporting Information Figure S.4). Results for Bayesian sensitivity analyses, for models with all pesticide active ingredients, were frequently attenuated toward the null, and less precise (Supporting Information Table S.7). Many associations remained similar to those observed in the primary analyses, though several were fully attenuated or crossed the null.
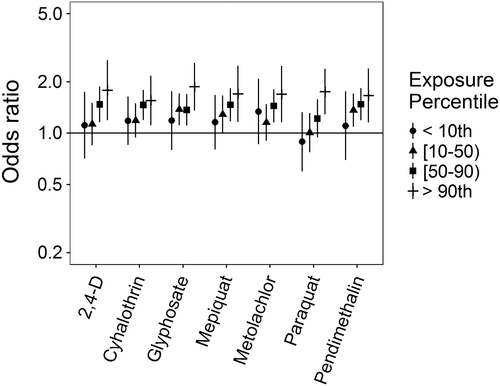
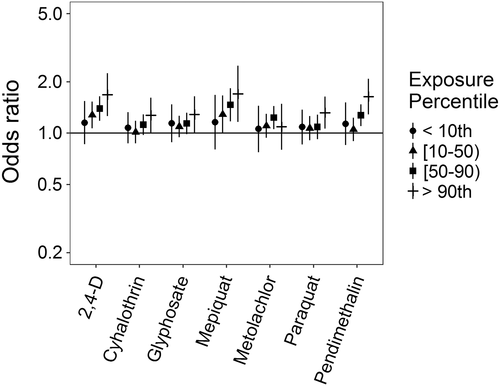
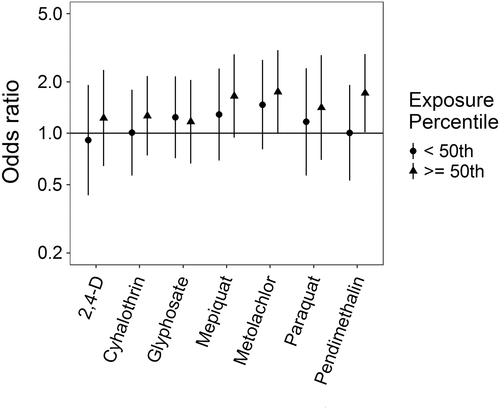
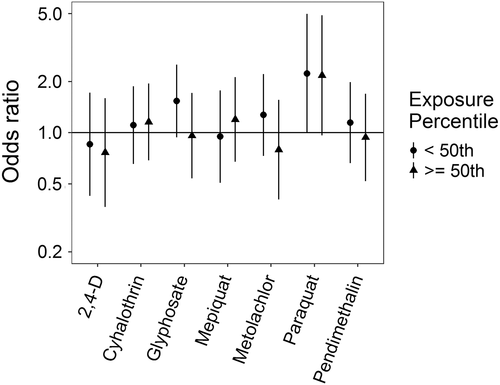
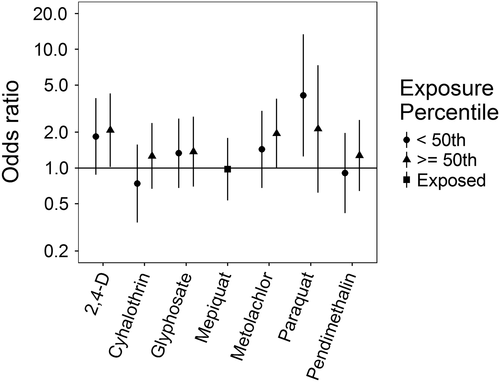
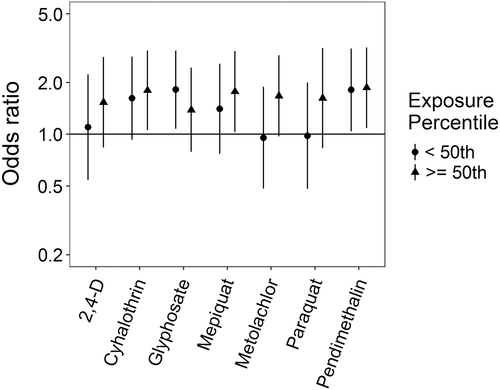
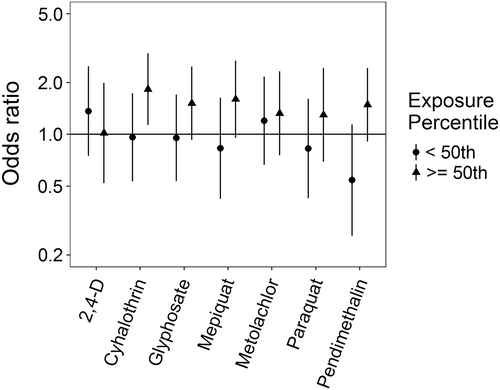
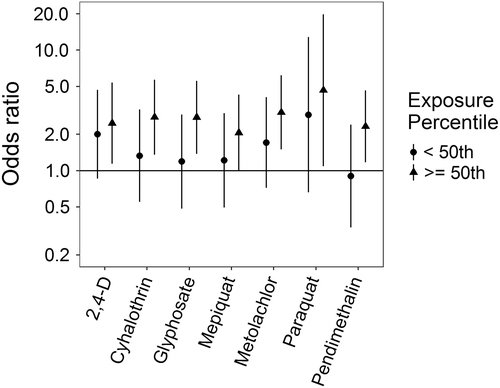
Associations for those birth defects examined with the 3-category exposure levels were also varied, though again we observed a number of positive associations. While some birth defects had positive associations with paraquat exposure, confidence intervals were generally unstable (Figures 5-10, Supporting Information Table S.2). HLHS was not associated with 2,4-D, cyhalothrin, or glyphosate, but had positive associations with mepiquat, metolachlor, and pendimethalin (Figure 5). There was no evidence of association between nonparaquat pesticide active ingredients and TEF (Figure 6). We observed elevated ORs for choanal atresia with exposure to 2,4-D and metolachlor, while the other pesticide active ingredients showed no evidence of association (Figure 7). ORs for Hirschsprung's are elevated at the higher level of exposure only for 2,4-D, S-metolachlor, and paraquat; however, for cyhalothrin, glyphosate, mepiquat, and pendimethalin ORs are elevated at all levels of exposure (Figure 8). For upper limb defects, ORs are elevated from the null at the higher level of exposure for cyhalothrin, glyphosate, and mepiquat (Figure 9). For the other pesticide active ingredients patterns are less clear. For example, effect estimates for pendimethalin are below the null for <50th percentile exposures compared to unexposed, but elevated at the ≥50th percentile exposure level. Associations with lower limb defects are generally elevated at the higher exposure level for all pesticide active ingredients (Figure 10). Paraquat estimates are elevated but highly unstable due to limited numbers of unexposed cases. Because of small case numbers in the exposed groups and the likelihood of sparse data concerns, results for adjustment with an additional pesticide active ingredient with these birth defects are presented only in supplemental material (Supporting Information Figures S.5–S.10, Supporting Information Tables S.8–13).
4 DISCUSSION
In our examination of the associations between 7 pesticide active ingredients and 10 birth defects, we observed several positive associations across birth defects and pesticides, particularly at the higher levels of exposure, with several pesticide-birth defect pairs demonstrating monotonic increasing associations. However, no particular pesticide active ingredient emerged as associated with all birth defects examined and patterns of association vary across both birth defects and pesticide active ingredients. While adjustment for pesticide co-exposures attenuates ORs toward the null, associations that were positive in single-pesticide models generally remain so in models adjusted for an additional pesticide active ingredient.
Comparison with other literature investigating pesticide active ingredients and individual birth defects can be difficult due to differences in ingredients examined, groups or classes of pesticides examined rather than individual ingredients, or differences in how exposure levels were classified. In several California-based studies, pesticide usage reports were linked to land survey data and pesticide exposures were estimated for 500 to 1,000 m buffers around residences. Carmichael, Yang, et al. (2014) found cyhalothrin exposures associated with increased odds of ASD, similar to what we observed in this analysis, while HLHS was associated with strobin and triazine exposure (not investigated here). While Shaw et al. (2014) examined gastroschisis and observed associations with dichlorophenoxy salt or ester and pendimethalin exposures; in the same study glyphosate and bipyridylium pesticides (which included paraquat) were not associated with increased odds of gastroschisis. In our previous analysis, we observed no evidence of association with total pesticide exposure and gastroschisis, which may be due to the large number of pesticide active ingredients included in that exposure (Rappazzo et al., 2016). Additionally, an examination of neural tube defects found increased ORs with 2,4-D exposure but not with glyphosate (Rull et al., 2006). Generally, information on combinations of specific pesticide active ingredients and specific birth defects is limited.
There are several possible pathways by which pesticides in general, and specific compounds might act on fetal development. Mechanisms studied have been linked to chronic diseases (e.g., cancer, neurodegeneration, cardiometabolic outcomes; Mostafalou & Abdollahi, 2013), but can potentially disrupt fetal developmental in ways that might lead to birth defect formation. Some of these mechanisms include: endocrine disruption, which could affect hormone-dependent development; oxidative stress and inflammatory response, which could act through maternal systematic processes; or inhibition of electron chain transport activity or mitochondrial dysfunction, which could disrupt signaling or energy generation during growth and organ formation (Abdollahi, Ranjbar, Shadnia, Nikfar, & Rezaie, 2004; Mokarizadeh, Faryabi, Rezvanfar, & Abdollahi, 2015; Mostafalou & Abdollahi, 2013, 2017).
In terms of the specific pesticide active ingredients we examined, though they were chosen for inclusion based on commonality of exposure rather than potential toxicity, there have been associations with reproductive health outcomes, however not necessarily birth defects. 2,4-D, the most commonly applied pesticide, has been linked to persistent sperm abnormalities in occupational farm sprayers (Abdollahi et al., 2004; Lerda & Rizzi, 1991; NIOSH, 2014), poor semen quality in men living in agrarian areas (Swan, 2003; Swan et al., 2003), and with early spontaneous abortion in farm operators and dwellers (Arbuckle, Lin, & Mery, 2001). In rat studies, skeletal abnormalities, pup loss, thyroid dysregulation, and changes to gonad weights were observed at high doses of 2,4-D (EPA, 2007). For glyphosate, research on reproductive health outcomes has been limited. In humans, glyphosate has been variably associated with birth defects, with no clear relationship emerging from the small number of studies (de Araujo, Delgado, & Paumgartten, 2016). In zebrafish, glyphosate exposure caused heart abnormalities (Roy, Ochs, Zambrzycka, & Anderson, 2016), and inhibited carbonic anhydrase activity and led to body malformations (Sulukan et al., 2017). Pyrethroids, of which cyhalothrin is one, have been associated with sperm abnormalities (Koureas, Tsakalof, Tsatsakis, & Hadjichristodoulou, 2012; Saillenfait, Ndiaye, & Sabate, 2015). The other pesticides examined here have limited or no evidence of reproductive toxicity, and may be acting as proxies for more toxic pesticide active ingredients in our analysis.
A major strength of our study was the ability to examine specific pesticide active ingredients. The pesticide exposure metric used is an improvement of survey data that uses crop phenology, pesticide application records, and residential location, and includes timing of pesticide usage and pregnancy to estimate pesticide active ingredient exposure (Warren et al., 2014). Through this metric we were able to investigate beyond simple exposure to any pesticide or even to a particular class of pesticides. This is of particular benefit in areas where detailed pesticide use and application data are sparse or nonexistent. The population-based design and complete case ascertainment through the first year of life reduce the likelihood of selection bias and bias due to misclassification of cases. We were also able to examine individual birth defects, which is beneficial as etiologies may differ even between birth defects within the same organ systems.
As a corollary to the use of individual birth defects and specific pesticide active ingredients, a limitation is small numbers of cases and of exposed cases, which may result in unstable effect measure estimates. Confounding by unexamined pesticides is a possibility as well; without larger numbers of subjects and more variability in exposures, this is difficult to fully investigate, though we have attempted to at least examine potential confounding by including adjustment for additional pesticide active ingredients in this analysis. Relatedly, pesticide active ingredients examined had moderate to high correlations and though we examined two pesticide models to evaluate confounding, small numbers of exposed cases in any given category of multiple pesticide exposures mean results of those analyses should be interpreted with caution.
Limitations from the previous study of total pesticide exposures (Rappazzo et al., 2016) and the creation of the exposure metric (Warren et al., 2014) persist and merit discussion. Among these are the use of live births occurring after 20 weeks of completed gestation as the cohort base rather than the true at-risk population of conceptions reaching implantation, which may attenuate observed effects and is a common limitation to many birth defect studies, as conceptions themselves are often unrecorded. There is also the potential for unmeasured confounding from unmeasured variables such as parental occupational exposures, which we were unable to control for in this analysis as parental occupation is not recorded on birth records. Exclusions due to geocoding and concerns of residential mobility during pregnancy are concerns because it is possible that individuals excluded due to rural route addresses have more potential to be exposed to agricultural pesticides, and residential mobility may introduce exposure misclassification. Research on other environmental exposures, such as air pollution, has shown that effects of residential mobility are limited and most within-pregnancy moves are over short distances (Bell & Belanger, 2012; Lupo et al., 2010), and misclassification from this would likely attenuate effect estimates toward the null. For the exposure metric, tobacco data was unavailable and so was excluded from the exposure metric. However previously published total pesticide sensitivity analyses results were unchanged for individuals with and without tobacco within their 500 m buffer (Rappazzo et al., 2016). In addition, crop map data were not available for the years of birth data examined and so crop information was interpolated across years (Warren et al., 2014). Results from the Bayesian sensitivity analysis suggest that the complexities of mixtures analysis remain in populations that are potentially exposed to many pesticide active ingredients simultaneously, and that while one pesticide ingredient may have a positive association in a single exposure model, it may be acting as a representative of another pesticide active ingredient or as a surrogate for a mixture of pesticide active ingredients.
It is important to note that the exposure metric used herein is an estimate of exposure and should not be used as a surrogate for dose. Specifically, we used a novel metric of residential proximity to agricultural pesticides that balances computational difficulty and expense with information on temporal and spatial specificity of pesticide application and timing of exposure (Warren et al., 2014) to further investigate our initial results informing the relationship between pesticide exposure and birth defects (Rappazzo et al., 2016). We observed several positive associations, particularly at the higher levels of pesticide exposure, with several pesticide-birth defect pairs demonstrating stronger associations as estimates of pesticide exposure increased. Our results provide preliminary evidence for positive associations between some pesticide active ingredients and birth defect phenotypes. Additional studies using improved exposure assessment (e.g., biomarkers of exposure) will be useful in building a body of evidence that is sufficient for making determinations about the causal nature of the associations we observed.
Overall, this work represents an improvement in the ability to examine specific pesticide active ingredients in geographically-based epidemiologic studies of pesticides and birth defects (outside of California). It also highlights the ongoing issues with these analyses, mainly small numbers and the potential for confounding by joint pesticide exposures. We observed positive associations between several birth defects across organ systems and pesticide active ingredients commonly applied in NC agriculture.
CONFLICT OF INTEREST
The authors declare no conflict of interest.
DISCLAIMER
The research described in this article has been reviewed by the National Center for Environmental Assessment, US EPA, and approved for publication. Approval does not signify that the contents necessarily reflect the views and policies of the Agency, nor does the mention of trade names of commercial products constitute endorsement or recommendation for use.
FUNDING INFORMATION
This work is supported in part by an appointment to the Internship/Research Participation Program at Office of Research and Development (National Center for Environmental Assessment), U.S. Environmental Protection Agency, administered by the Oak Ridge Institute for Science and Education through an interagency agreement between the U.S. Department of Energy and EPA. This research was supported in part by grants from the National Institute of Environmental Health Sciences (T32ES007018, P30ES010126, R01ES020619, K99ES027508), National Birth Defect Prevention Study CDC funds, the NSF Graduate Research Fellowship Program grant 0646083, and by CTSA Grant Number UL1 TR001863 and KL2 TR001862 from the National Center for Advancing Translational Science.


