Possible origin of Theia, the Moon-forming impactor with Earth
Abstract
Background
The problem of the formation of the Moon is still not explained satisfactorily. While it is a generally accepted scenario that the last giant impact on Earth between some 50 to 100 million years after the starting of the formation of the terrestrial planets formed our natural satellite, there are still many open questions like the isotopic composition, which is identical for these two bodies. In our investigation, we will not deal with these problems of chemical composition but rather undertake a purely dynamical study to find out the probability of a Mars-sized body (Theia) to collide with the Earth after the formation of the Earth-like planets.
Materials and Methods
We assume an additional massive body between Venus and Earth, respectively Earth and Mars, which formed there at the same time as the other terrestrial planets. We have undertaken massive n-body integrations of such a planetary system with four inner planets (we excluded Mercury but assumed one additional body as mentioned before) and the gas giants Jupiter and Saturn. For the present positions of the planets, we have undertaken the integrations for 100 Myrs to be able to check for stable orbits of Theia for or up to tens of millions of years.
Results
We find a probable origin of the Earth impactor at a semi-major axis of 1:16 AU < aTheia < 1:195 AU; a Theia inside the orbit of Earth suffers from collisions on much shorter time scales.
Conclusion
We can provide a statistical estimation of the collision velocities as well as the collision angles, which will then serve as the basis for further investigation with detailed smooth(ed) particle hydrodynamics computations.
1 INTRODUCTION
An assumed giant impact of an additional Mars-sized object (Theia) onto the Earth could have led to the formation of the Moon after the planets already had their current mass and no more gas was present in the solar system. Many recent publications have dealt with this topic, for example, Asphaug (2014), Nakajima and Stevenson (2015), Quarles and Lissauer (2015), Jacobson et al. (2014), Jacobson and Morbidelli (2014), and Izidoro, Haghighipour, Winter, and Tsuchida (2014), since the first ideas were developed by Hartmann and Davis (1975) and Cameron and Ward (1976) and later by Canup and Asphaug (2001). Detailed collision scenarios were studied, for example, by Cameron (1997) and Canup (2013, 2004, 2008) where the collision was modeled with the aid of sophisticated smooth particle hydrodynamics (SPH codes). In a very recent article Kaib and Cowan (2015) [=KC], the authors concentrate on the feeding zone of the planet to form with respect to the planet's volatile inventory and isotopic composition. Because of the highly random outcome, they ask the question of how deterministic the outcome of the planetary formation is. In fact, the correspondence between the results of the different model computations of n-body codes is very small. Most of these models have been built to understand the architecture of our solar system, which results only from a subset of the chosen initial conditions. In KC, the authors estimated the likelihood that the mass of Theia could be equal to that of the Earth, but the probability is rather low. Their results coincide well with those of Jacobson and Morbidelli (2014) who estimated a low collision probability of bodies with comparable masses. According to these results, we have fixed the mass of the additional planet (the “projectile planet”) to mMars for our computations (see Section 2). Other investigations aimed for high velocity encounters, for example, the one by Ćuk and Stewart (2012), which assumed High-velocity collisions for smaller masses of Theia (0.025mEarth<mTheia<0.05mEarth). However, the results of KC show that such an event may not be very probable because Earth's spin rate would be too high and these events are rare. For the same reason, the scenario proposed by Reufer, Meier, Benz, and Wieler (2012), where they looked for a steeper collision angle, is not very probable. KC undertook 150 different simulations with three different underlying models: the first model with Jupiter and Saturn on circular orbits, a second one with initially small eccentricities of Jupiter and Saturn, and a third one only with Jupiter according to the model of Hansen (2009). Whereas in the first two models 100 self-interacting bodies (distributed between 0.5 and 4 AU with small eccentricities) were integrated, which then ended up as planets, the last one starts with 400 embryos in an annulus between 0.7 and 1 AU and—according to the authors—represent more or less the outcome of the Grand Tack model (Walsh, Morbidelli, Raymond, O'Brien, & Mandell, (2011)). Therefore, on the basis of these results, it is appropriate to conduct a study that is oriented toward the collision of a Mars-sized object with the Earth.
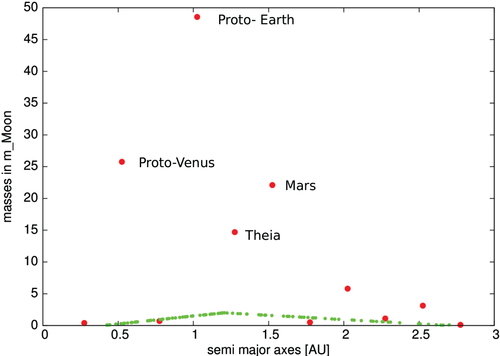
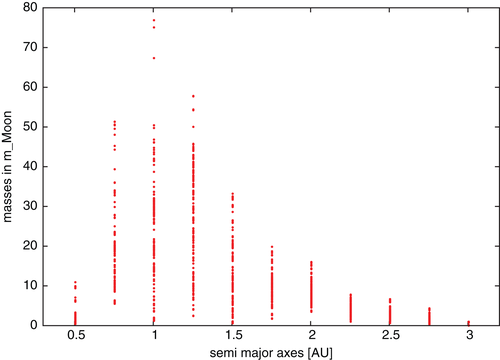
It is well known that the outcome of computations of the development of the early solar system depends highly on the initial conditions after the gas in the disk disappeared. Several different approaches have led to different “planetary systems”, although all these attempts were undertaken to understand the architecture of our system (e.g., Hansen, (2009); Izidoro et al., (2014)). Our setup is based on the outcome of the Grand Tack (Walsh et al., (2011)), where after the inward migration of Jupiter and Saturn a later outward migration triggered the formation of the terrestrial planets. In our numerical integrations, we started with these two gas giants at their present position and 100 planetesimals randomly distributed in 0.4AU<a<2.7AU with masses of the order of the Moon. In Figure 1, we have plotted the results of one out of 16 simulations where the architecture of this simulated planetary system turned out to be close to the one of our solar system. Nevertheless, there are two important differences: an additional planet (about the size of Mars) between the “Earth” (here with only 60% of its present mass) and a “Mars” (with more than double its current mass); the planet at 0.5 AU can be seen as a Venus equivalent. While this is just one example of the resulting configurations, we use it to motivate our choice of initial conditions described in the section below: a Mars-sized planet between Venus and Earth or between Earth and Mars. Figure 2 combines all our simulations in one graph showing an accumulation of planets around 1 AU, hence supporting our choice of initial conditions.
2 DYNAMICAL MODEL AND NUMERICAL SETUP
The investigation on the possible orbital origin of Theia was performed in two steps. First we carried out survey simulations in order to limit the number of possible regions for Theia's origin. Thus we chose two regions in the early solar system. The initial semi-major axis for Theia was set between 0.8AU⩽a⩽0.94AU and 1.06AU⩽a⩽1.23AU with δa=0.005AU. As the dynamical model, we have chosen a six-body problem for the solar system with the current orbital elements of Venus, Earth, Mars, Jupiter, and Saturn.1 The additional planet—the possible impactor—should then be in a quasi-stable orbit after the formation of the planetary system. To find such an orbit, we did not vary the eccentricity or the inclination and set them to eini=0.05 and i=2°, respectively. For the mean anomaly of Theia, we used 25 randomly chosen values between 0° and 360°. For every fixed semi-major axis, 25 such osculating elements were used as initial conditions for our first investigation. Orbits were calculated for an integration time of maximum 40Myrs. The simulations showed that for an additional Mars-sized body placed between Venus and Earth, it is less likely to stay on a stable orbit for a sufficiently long time (see, e.g., Canup & Asphaug, (2001); Jacobson & Morbidelli, (2014)) before colliding with Earth.
Because of these results for the inner region, we carried out the second step of our investigations for the outer region.
The values for the initial semi-major axis for Theia were now chosen in the same interval of 1.06AU⩽aTheia⩽1.23AU with δaTheia=0.005AU. But for each initial semi-major axis, 360 values for the mean anomaly of Theia were chosen, equally distributed, meaning 360 integrations for each fixed initial semi-major axis. Assuming that in the beginning Theia was on a stable orbit, its eccentricity and inclination were fixed to eini=0.05 and i=2°. The integration time for these detailed investigation was now set to 100Myrs.
For achieving the highest possible precision with respect to the collision angle and velocity, we use the Lie integrator method, which we have used for many years for most of our computations (Dvorak, Pilat-Lohinger, Funk, & Freistetter, (2003); Dvorak et al., (2015); Galiazzo, Bazso, & Dvorak, (2013)). It has an automatic step-size control and is especially efficient when dealing with close encounters (Delva, (1985); Hanslmeier & Dvorak, (1984); Lichtenegger, (1984)).
For a detailed comparison of the Lie integrator with other integration methods (e.g., symplectic integrators), see Eggl and Dvorak (2010).
3 RESULTS
In our computations we observed three possible outcomes: stable orbits, collision, and ejection. Stable orbits are orbits where Theia stays on a regular orbit for the whole integration time of 40 and 100Myrs . Orbits that are counted as ejections may in fact correspond to three different outcomes: ejection from the inner solar system, too strong perturbation of the other terrestrial planets, or collision with Venus or Mars. Obviously, only collisions with Earth are counted as collisions for creating the Moon. As the bodies are treated as point masses, a collision was assumed to have happened when Theia got as close to Earth as d=r Earth +r Theia . Then the integration was stopped and the orbit was marked as one with a collision outcome.
The aim of this work is to find long-time stable orbits (at least for t>70Myrs ) before a collision of Theia with the Earth. This assumption is made according to the commonly accepted theory that the Moon originates from a debris disk formed by a late giant impact. We emphasize that this impact happened very probably after 70Myrs after the formation of the terrestrial planets, as has been found by Canup and Asphaug (2001) and Jacobson and Morbidelli (2014).
The first test computation was started in two regions close to the Earth: one inside and one outside the orbit of the Earth. Computations for orbits close to the Earth (region b in Table 1) were carried out, which led to almost immediate collisions with the proto-Earth, and hence we exclude them from further study.
| a Theia | C T mean | ||
|---|---|---|---|
| Region | (AU) | (Myrs) | No. of coll. |
| a | 0.875–0.940 | 4.8 | 43 |
| b | 0.940–1.060 | — | — |
| c | 1.060–1.230 | 13.6 | 203 |
- C T mean stands for mean collision time. See text for a discussion of region b.
As expected, Mars-sized bodies that start on orbits close to the Earth (initial semi-major axes between 0.940 and 1.060 AU) are most likely to collide with Earth on short time scales, which rules out this region as a possible origin of Theia for reasons mentioned above. Table 1 gives the mean collision times and number of collisions found in three regions inside (a), close to (b), and outside (c) Earth's orbit, respectively. Due to the very short collision times in region a, we concentrated our numerical simulations on the outer region c.
In Table 2 we summarize our results for the outer region. In the second column we show the maximum time of an Earth collision with respect to most probable regime for the initial semi-major axis. It is obvious that for a larger distance to the Earth this collision time increases substantially from a Theia =1.095AU . This can be seen from the minimum collision time given in Column 3 as well as in the mean collision time shown in Column 4. The number of collisions tends to decrease with increasing semi-major axis, which is easy to understand because an orbit close to Earth's orbit suffers a lot more from its perturbations.
| a Theia | C T max | C T min | C T mean | N |
|---|---|---|---|---|
| (AU) | (kyrs) | (kyrs) | (kyrs) | (out of 360) |
| 1.060 | 73427 | 0.2 | 5181 | 76 |
| 1.065 | 95878 | 3 | 9925 | 103 |
| 1.070 | 12135 | 2 | 413 | 164 |
| 1.075 | 10322 | 1 | 337 | 154 |
| 1.080 | 39508 | 3 | 1948 | 143 |
| 1.085 | 74094 | 21 | 1212 | 111 |
| 1.090 | 22734 | 89 | 1491 | 81 |
| 1.095 | 87580 | 169 | 13823 | 91 |
| 1.100 | 32771 | 190 | 6356 | 72 |
| 1.105 | 69453 | 204 | 6044 | 73 |
| 1.110 | 98129 | 412 | 23199 | 63 |
| 1.115 | 41798 | 382 | 5521 | 69 |
| 1.120 | 64124 | 575 | 9556 | 77 |
| 1.125 | 60207 | 1559 | 12935 | 68 |
| 1.130 | 91093 | 5418 | 40232 | 33 |
| 1.135 | 39375 | 1321 | 14713 | 70 |
| 1.140 | 83960 | 4327 | 25799 | 74 |
| 1.145 | 99754 | 7608 | 50636 | 46 |
| 1.150 | 77338 | 2452 | 19585 | 86 |
| 1.155 | 97204 | 9567 | 49788 | 41 |
| 1.160 | 81713 | 2063 | 21834 | 35 |
| 1.165 | — | — | — | — |
| 1.170 | 97373 | 6579 | 53440 | 11 |
| 1.175 | 96267 | 2203 | 31222 | 34 |
| 1.180 | 97157 | 14403 | 59469 | 13 |
| 1.185 | 90792 | 11980 | 44939 | 28 |
| 1.190 | 99900 | 11734 | 43464 | 29 |
| 1.195 | 58805 | 18387 | 33950 | 5 |
| 1.200 | 90958 | 54506 | 76065 | 7 |
| 1.205 | 96461 | 29042 | 59924 | 11 |
| 1.210 | 94204 | 1081 | 24209 | 50 |
| 1.215 | 90400 | 3114 | 26184 | 54 |
| 1.220 | — | — | — | — |
| 1.225 | — | — | — | — |
| 1.230 | — | — | — | — |
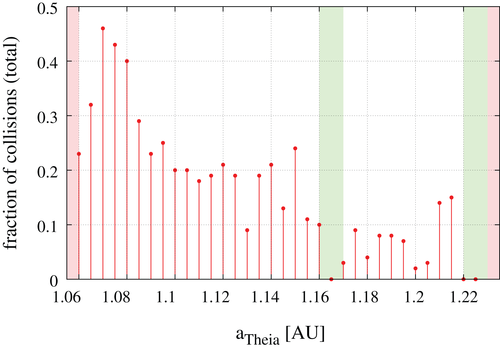
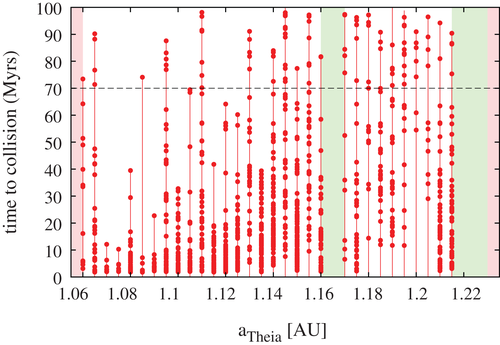
The decreasing percentage of collisions (out of 360 integrated orbits for each semi-major axis for Theia) with larger distance from the Earth is also depicted in Figure 3. The red areas on the left edge (initial conditions close to the Earth) and the right edge mark regimes where, on one hand, the collisions happen too fast (left edge) and, on the other, where the fictitious planets collide first with Mars and then sometimes undergo high-velocity impacts with the Earth caused by large eccentricities after the Mars encounter. This fact excludes them from being possible canonical Earth impactors. No collisions at all occur for two initial semi-major axis intervals (1.165 AU and 1.220 / 1.225 AU) which are marked in green. Whereas the first strip at a Theia = 1.165 AU is still under investigation, the second one close to the right edge is the beginning of a zone where many of the Theia orbits are in fact stable or suffer from Mars encounters. It is the beginning of a region of sometimes very stable orbits between Earth and Mars extending up to the vicinity of Mars. The unstable orbits in this area quite often suffer from close encounters with Mars and a subsequent collision with the Earth. Evidently, this causes high-velocity collisions which do not fit into the canonical formation theory of the Moon (Salmon & Canup, (2014)), and hence this region is not of interest for our investigation. The term “canonical” refers to the generally accepted scenario of the formation of the Moon, which includes the collision of a Mars-sized object with the proto-Earth resulting in the formation of a disk from which the Moon accreted (Cameron & Ward, (1976)). The so-called non-canonical impacts include bigger impactors or impacts at higher velocities with a fast-spinning Earth (Canup, (2013)).
In Figure 4 we show the collision times for all integrated orbits (360 initial values for the mean anomaly per semi-major axis) versus the initial semi-major axis. As already mentioned, most of the collisions up to a=1.15AU happen within the first 30 million years and only exceptional orbits stay longer than 70 Myrs. Note that the maximum number of relatively fast escaping orbits are close to the Earth.
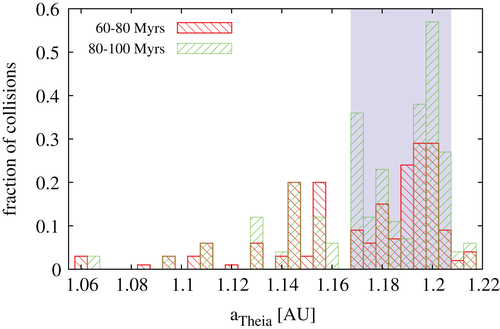
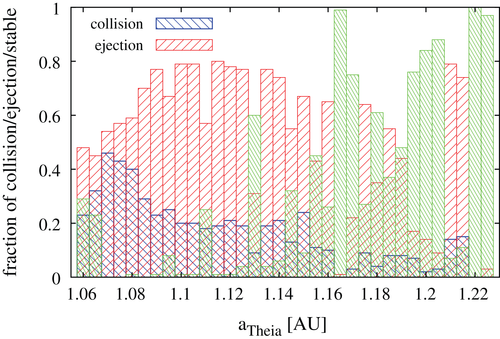
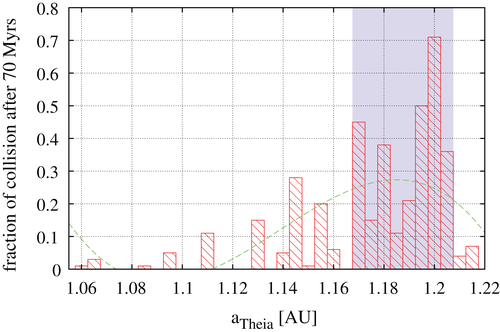
As we are interested in long-term stability, and believe canonical collisions can occur after approximately 70 Myrs, we further investigate two collision regimes ranging from 60 to 80 Myrs and from 80 to 100 Myrs, respectively. Figure 5 shows the fraction of “colliding initial conditions” for these regimes. The blue bar indicates the initial semi-major axes a Theia that are most likely to result in a canonical Earth impact, that is, 1.165AU<a Theia <1.21AU . Outside this region, the majority of initial conditions lead to ejection from the solar system or collision at smaller time scales, as illustrated by the shares of stable, ejection, and collision outcomes listed in Table 3 for all initial a Theia . Figure 6 summarizes this data, showing up to 80% ejection probability for Theia orbits closer to the Earth (note the different color coding). Figure 7 further underlines the likelihood of the initial semi-major axis interval in question by fitting a polynomial (third-order) to the collision frequency data, which in turn assumes a canonical formation time of the Moon of 70 Myrs.
| aTheia | Fraction of orbits | ||
|---|---|---|---|
| (AU) | Stable | Eject | Collision |
| 1.060 | 0.29 | 0.48 | 0.23 |
| 1.065 | 0.23 | 0.45 | 0.32 |
| 1.070 | 0.00 | 0.54 | 0.46 |
| 1.075 | 0.00 | 0.57 | 0.43 |
| 1.080 | 0.01 | 0.59 | 0.40 |
| 1.085 | 0.00 | 0.70 | 0.29 |
| 1.090 | 0.01 | 0.77 | 0.23 |
| 1.095 | 0.08 | 0.67 | 0.25 |
| 1.100 | 0.01 | 0.79 | 0.20 |
| 1.105 | 0.01 | 0.79 | 0.20 |
| 1.110 | 0.25 | 0.57 | 0.18 |
| 1.115 | 0.01 | 0.80 | 0.19 |
| 1.120 | 0.01 | 0.78 | 0.21 |
| 1.125 | 0.04 | 0.77 | 0.19 |
| 1.130 | 0.60 | 0.31 | 0.09 |
| 1.135 | 0.04 | 0.77 | 0.19 |
| 1.140 | 0.06 | 0.74 | 0.21 |
| 1.145 | 0.32 | 0.55 | 0.13 |
| 1.150 | 0.09 | 0.67 | 0.24 |
| 1.155 | 0.45 | 0.43 | 0.11 |
| 1.160 | 0.26 | 0.65 | 0.10 |
| 1.165 | 0.99 | 0.01 | 0.00 |
| 1.170 | 0.75 | 0.22 | 0.03 |
| 1.175 | 0.27 | 0.64 | 0.09 |
| 1.180 | 0.61 | 0.35 | 0.04 |
| 1.185 | 0.37 | 0.55 | 0.08 |
| 1.190 | 0.48 | 0.44 | 0.08 |
| 1.195 | 0.02 | 0.93 | 0.04 |
| 1.200 | 0.84 | 0.14 | 0.02 |
| 1.205 | 0.88 | 0.09 | 0.03 |
| 1.210 | 0.07 | 0.79 | 0.14 |
| 1.215 | 0.11 | 0.74 | 0.15 |
| 1.220 | 1.00 | 0.00 | 0.00 |
| 1.225 | 0.97 | 0.03 | 0.00 |
There is no real dependence of the stability/collision of Theia's orbit on the starting position with respect to the angles compared to the Earth's position. Nevertheless, an interesting feature could be observed for different semi-major axes in the regime of fast escapes (see Figure 8). The comparison for a=1.10,1.13, and 1.16 AU depicts a somewhat strange dependence of certain regions of initial angles. A shift to larger initial mean anomalies is visible for stable intervals. Unfortunately, we are unable to comment on the reason for this stable interval—it could lie in high-order mean motion, three-body, or secular resonances. We continue our research to understand these structures.

The fact that in the first gap ( a=1.165AU ) there are no collisions at all is still under detailed investigation for smaller steps in semi-major axis and longer time scales. We do not yet know the reason for this surprisingly existing set of stable orbits inside an interval in the initial conditions leading to mixed qualitative behavior of orbits (stable, collision, and ejection). It seems that there is no resonance acting exactly in this interval (see Table 4 for a list).
| Resonance | Resonance with | a(AU) |
|---|---|---|
| 12:7 | Mars | 1.06375 |
| 9:10 | Earth | 1.07277 |
| 8:9 | Earth | 1.08169 |
| 11:6 | Venus | 1.08350 |
| 5:3 | Mars | 1.08391 |
| 13:7 | Venus | 1.09286 |
| 7:8 | Earth | 1.09310 |
| 15:8 | Venus | 1.09985 |
| 13:8 | Mars | 1.10236 |
| 6:7 | Earth | 1.10823 |
| 8:5 | Mars | 1.11382 |
| 11:7 | Mars | 1.12728 |
| 5:6 | Earth | 1.12924 |
| 14:9 | Mars | 1.13493 |
| 9:11 | Earth | 1.14314 |
| 2:1 | Venus | 1.14821 |
| 4:5 | Earth | 1.16040 |
| 3:2 | Mars | 1.16278 |
| 7:9 | Earth | 1.18240 |
| 13:9 | Mars | 1.19241 |
| 10:7 | Mars | 1.20123 |
| 15:7 | Venus | 1.20225 |
| 13:6 | Venus | 1.21114 |
| 3:4 | Earth | 1.21141 |
| 7:5 | Mars | 1.21752 |
| 11:5 | Venus | 1.22353 |
4 IMPACT PARAMETERS
In addition to the study mentioned before we also check the impact velocity as well as the impact angle—connected to the so-called impact parameters in different studies (Leinhardt & Stewart, (2012); Maindl & Dvorak, (2014)).
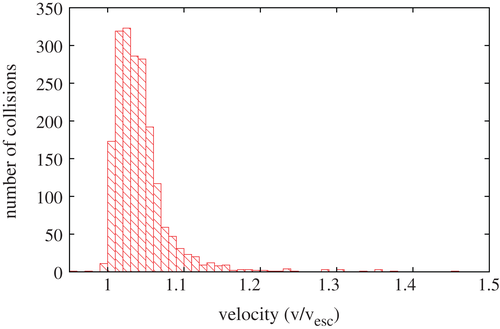
Together with the mass and composition of the two colliding bodies, these two quantities determine the collision outcome. In Figure 9 we show the impact velocity from our simulations. Evidently, most of the encounter velocities are just above the escape velocity of the two planets ( v esc ∼9km/s) and only very few collisions are faster than about 1.1v esc .
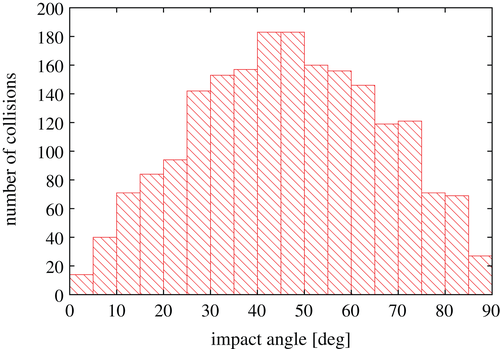
The distribution of the impact angles (Figure 10) is asymmetric with slightly more head-on collisions. We can explain this by the fact that, close to the Earth, Theia is strongly accelerated toward the center of the significantly larger planet (the mass ratio m Mars /m Earth is ∼0.1).
The actual collision outcome in terms of fragmentation strongly depends on the impact velocities, impact angles, and the mass ratio (Leinhardt & Stewart, (2012); Maindl, Dvorak,
Schäfer, & Speith, (2014)). The number of fragments varies with the impact angle such that, even for relatively high impact velocities, strongly inclined collisions may lead to two major survivors (hit and run), whereas head-on impacts may destroy the involved bodies. For a 1:10 mass ratio, more or less head-on collisions at low velocities  lead to merging into one survivor and—for
  —possibly significant amounts of debris (Leinhardt & Stewart, (2012)). In our scenarios, the low impact velocities suggest surviving bodies and probably a Moon forming from a debris disk.
5 INVESTIGATIONS CONCERNING DIFFERENT MASSES
Salmon and Canup (2014) also investigated other types of impacts that could produce a debris disk from which the Moon could have condensed. These so-called non-canonical impacts include more massive impactors as well as smaller but faster impactors. The possibility that such a non Mars-sized body impacted the Earth and created the Moon is smaller than for a Mars-sized impactor, because with these impactors several problems arise in forming the Moon after the impact. The former case would lead to too high an angular momentum of the Earth–Moon system after the impact and an excessive amount of material blown into an orbit around the Earth. Nevertheless, it cannot be excluded that the Moon was produced by such an impact. Consequently, we investigated the orbital evolution of non-Mars-sized objects and the impact probability by carrying out integrations with different massive bodies as impactors: m=0.5m Mars and m=2m Mars . We investigated this only for one semi-major axis of 1.065AU with a mean anomaly between 0 and 360° (increment of the mean anomaly ΔM=2°) and the integration time of 100Myrs , as before. The respective results can be seen in Figure 11.
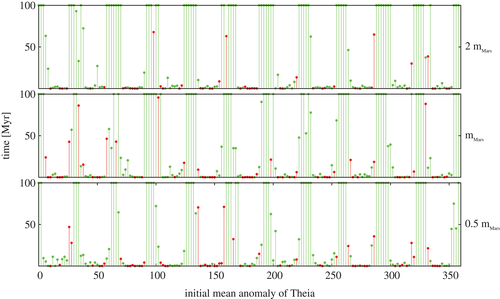
There is almost no difference in the results, except for a slightly more unstable behavior for m=0.5m Mars with respect to m=2m Mars (see Table 5).
| Mass | Fraction of orbits | ||
|---|---|---|---|
| (mMars) | Stable | Eject | Collision |
| 0.50 | 0.25 | 0.43 | 0.32 |
| 1.00 | 0.27 | 0.42 | 0.31 |
| 2.00 | 0.36 | 0.38 | 0.27 |
We summarize the results in Table 6, which shows that for a Mars-sized object the probability for staying on a regular orbit for a long time is by far the largest. For both objects with twice the size of Mars and half the size of Mars, the maximum collision time is smaller than that observed for a Mars-sized object. Concerning the collision velocities, we can see that the lighter the impactor, the smaller the impact velocity.
| Mass | C T max | C T min | v mean | C T mean |
|---|---|---|---|---|
| ( m Mars ) | (yrs) | (yrs) | ( v esc ) | (kyrs) |
| 0.50 | 71095 | 2 | 1.02 | 7570 |
| 1.00 | 95878 | 3 | 1.04 | 9925 |
| 2.00 | 67822 | 0.3 | 1.08 | 6372 |
6 CONCLUSIONS
We integrated thousands of additional orbits of a hypothetical Mars-sized Theia in the early phases of our planetary system and classified them according to their dynamics. The aim was to find an orbit that is stable for a sufficiently long time ( ) inside or outside the orbit of the Earth, which then could lead to a collision giving rise to the companion of the Earth.
In a first step, we investigated the two regions between Venus and Earth and between Earth and Mars. The region between Venus and Earth could be excluded because of the fact that the collisions of the hypothetical planet took place only a few million years after Theia and the other terrestrial planets had been formed, which is in contradiction to the assumed collision time of more than approximately 70 Myrs (Halliday, (2008); Canup & Asphaug, (2001)).
In the second step, we concentrated on the regime between Earth and Mars. For a fine grid of semi-major axes (1.06<a[AU]<1.23), we integrated the orbits of tens thousands of fictitious Theias up to 100 million years. The initial conditions were chosen such that the orbits of the hypothetical planets were stable in the beginning. This means that the eccentricity and the inclination of Theia were small ( e ini =0.05, i=2°) and the angles of the perihelion and longitude of the node were fixed ( ω=2°, Ω=2°).
We are aware that fixing the values of ω,Ω,e , and i, may affect the completeness of the results. Nevertheless, the influence of these parameters should not change the general picture of our analysis significantly. In the future, we plan to perform additional simulations taking into account the influence of these parameters.
For the actual position, we integrated the orbits for all 360° of the mean anomaly with a step size ( δ M=1°) for each chosen semi-major axis (39 in total) of Theia. In the model of a seven-body system (point masses) consisting of the terrestrial planets Venus, Earth, and Mars and the gas giants Jupiter and Saturn, the orbits were integrated with a method using an automatic step-size control to properly model close encounters and collisions, respectively. We did not include Mercury and also did not take into account Uranus and Neptune, because their influence would only be marginal. We emphasize that this is a statistical approach without any definitive answer for the Earth crosser but targeted at showing the region where Theia could come from with high probability.
Figures 6 and 7 summarize the most important results. The most probable interval for the initial value of the semi-major axis of Theia as the Moon-forming impactor seems to be 1.16<a[AU]<1.21 because there the orbits turned out to be long-term stable up to a final collision with the Earth. Regarding the collision characteristics, we found the most probable impact angle to be around 45° with nonnegligible contributions from the extremes (head-on and grazing collisions, respectively). Due to the large number of impacts observed, a statistical statement about the impact velocity can be made (Figure 9), which favors velocities just above the escape velocity. The impact velocities translate to “perfect merging”, “partial accretion”, or “hit-and-run” outcome (Leinhardt & Stewart, (2012)). For Moon formation, “partial accretion” seems to be the most favorable collision outcome. Detailed investigations on the collision process—which may further restrict the possible origin of Theia—are under progress; we will base them on real impact simulations using “our” SPH codes (Dvorak et al., (2016); Maindl et al., (2013); Schäfer et al., (2016)).
ACKNOWLEDGMENTS
The authors wish to thank Christoph Burger for critical comments on the initial version of the manuscript and the unknown referee for many helpful hints and suggestions. This research has made use of NASA's Astrophysics Data System Bibliographic Services. This work was supported by the FWF, project S-11603-N16.


