Reliable Data From Community-Based Citizen Science for Coastal Biodiversity Research in the Taoyuan Algal Reef, Taiwan
Funding: This research was funded by the Office of Coast and Resource Circulation Construction, Taoyuan, Taiwan.
ABSTRACT
Citizen science is a valuable tool for large-scale ecological research, and community-based approaches enhance scientific data while fostering environmental awareness among local residents. In 2021, the Taoyuan Algal Reef in Taiwan became a national focus during a referendum, yet public understanding of its ecology remained limited. To bridge this gap, we partnered with nearby residents to conduct a coastal habitat survey using a simple, standardized data collection method. Participants received training, and even after our team concluded the project, locals continued monitoring independently using the same method. To verify the reliability of data collected with and without scientific supervision, we compared the datasets statistically using coefficients of variation. Results showed no significant differences, demonstrating that independently collected data were reliable. This enabled us to combine the datasets for further biodiversity analysis, examining organism abundance, species richness, and the Shannon index. Findings revealed that pebble habitats had the highest Shannon index, whereas sand habitats exhibited the lowest values for abundance, richness, and diversity. Organism abundance peaked in the mid tide zone, with summer and autumn showing the highest abundance, richness, and Shannon index values. Using species accumulation curves with twice the sample size, we predicted richness and Shannon index across habitats, tidal zones, and seasons. Predictions largely aligned with quadrat-scale findings, except that the sand habitat's predicted richness and diversity exceeded those of the algal reef habitat. Our research provides reliable, citizen science-based insights to deepen understanding of this region, which has been a focal point of debate in Taiwan.
1 Introduction
Both scientific evidence and public scientific knowledge are fundamental for developing and implementing effective conservation strategies and actions (Papageorgiou et al. 2022; Pullin et al. 2004). Citizen science serves as a vital bridge between scientists and the public, facilitating mutual understanding of scientific processes and enhancing engagement (Bonney et al. 2016). The growing adoption of citizen science worldwide underscores its value as an essential scientific methodology (Kullenberg and Kasperowski 2016). This approach plays a crucial role in large-scale ecological research by allowing participants to engage in surveys without spatial or temporal limitations while providing greater manpower than traditional research efforts led solely by scientists (Dickinson et al. 2010). Beyond data collection, citizen science can support conservation efforts by facilitating invasive species removal, identifying and protecting rare species, and contributing to biodiversity preservation (Devictor et al. 2010; Encarnação et al. 2021; Fontaine et al. 2022). Moreover, citizen science can influence policymaking, strengthen connections between participants and scientists, and foster science and environmental education (Bonney et al. 2016; Hsu and Lin 2023; Vann-Sander et al. 2016). However, to confirm data accuracy, many studies rely solely on researchers' qualitative assessments to evaluate the data quality in citizen science programmes (reviewed in Aceves-Bueno et al. 2017).
Community-based citizen science, also known as community-based monitoring, involves community members actively participating in observation and measurement activities to address local ecological and social issues, drive community development, and influence decision-makers (Bliss et al. 2001; Bonney 2021; Pollock and Whitelaw 2005; Whitelaw et al. 2003). This approach often enables high-resolution, long-term monitoring and the development of conservation strategies tailored to specific regional environments. For example, Hsu et al. (2024) collaborated with the local community to conduct monthly land crab surveys, revealing insights into the crabs' population ecology and providing strategies for their conservation. Similarly, DiBattista et al. (2021) showed that community-based citizen science offers a practical solution for scientists and fisheries managers with limited resources, improving taxonomic representation and expanding the geographic scope of species monitoring. Accordingly, community-based monitoring is increasingly important in regions where scientific monitoring is scarce or prohibitively expensive, and for ecosystem features that large-scale global research cannot accurately capture (Danielsen et al. 2021). In this study, we developed a community-based citizen science programme with local residents to assess biodiversity in the Guanxin Algal Reefs Ecosystem Wildlife Refuge.
Algal reefs are marine ecosystems formed by the accumulation of crustose coralline algae (Bosence 1983). Unlike hermatypic corals, crustose coralline algae are more tolerant of turbidity and can withstand wider fluctuations in salinity, temperature, and light intensity (Minnery et al. 1985). These reefs create biogenic habitats by accumulating calcareous thalli, enhancing habitat complexity, supporting marine biodiversity, promoting nutrient cycling, and contributing to coastal protection through sediment stabilization and wave buffering (Chisholm 2003; Gibson et al. 2006; Ingrosso et al. 2018). However, global environmental changes—including ocean acidification, climate change, wastewater pollution, invasive species, and fishing activities—increasingly impact algal reef ecosystems (Gibson et al. 2006; Rindi et al. 2019).
The Taoyuan Algal Reef (TAR), one of the world's largest intertidal algal reef ecosystems, is renowned for its ecological significance and spans approximately 27 km along the coastline of Taoyuan City in northwestern Taiwan (Liou et al. 2017). TAR hosts more than 36 species of crustose coralline algae (Liu et al. 2018; Zhan et al. 2022), with Sporolithon sp. being the dominant species (Tan et al. 2023). Numerous studies have reported diverse organisms living in or around the TAR (Chen et al. 2022; Heard et al. 2021; Li et al. 2021; Lin et al. 2013). However, the TAR ecosystems are also increasingly vulnerable to the impacts of climate change, sewage pollution, and human activities (Chiu et al. 2017; Nazir et al. 2024).
A significant issue emerged when the Taiwan government set a goal to achieve zero nuclear power generation by 2025. To meet this target, the government has been gradually expanding renewable energy projects and building gas-fired power plants. Plans included constructing two liquefied natural gas (LNG) storage tanks and related infrastructure, such as a port, in the coastal area of Datan in Taoyuan. This led to considerable debate within Taiwanese society, with some advocating for sustainable development and others for environmental preservation. In 2021, a national referendum was held, allowing the public to decide on the LNG project. Ultimately, the proposal to halt the construction was not approved (Lin et al. 2022).
In the lead-up to and following the national referendum, diverse voices have emerged from society and residents in nearby communities. Although various perspectives are valuable, local residents have expressed that their knowledge of the algal reef and its surrounding environment remains limited. In response, the government has indicated a desire for local residents to understand their environment through scientific knowledge better. Consequently, the government has entrusted our team with developing a community-based citizen science programme in collaboration with the local community to provide a high-resolution understanding of the TAR.
To enhance our understanding and monitoring of biodiversity in coastal habitats near the community, it is essential to consider changes in temporal and spatial environmental heterogeneity, which have a significant impact on biodiversity. Yu et al. (2020) identified key factors of habitat heterogeneity in this region, including pebbles (gravel), algal reefs, and sand, highlighting that habitat rugosity is the primary factor influencing species richness and density in the TAR. Tidal zones within the intertidal areas also represent a heterogeneous habitat for marine organisms due to varying humidity, temperature and wave exposure across different tidal zones (Bloch and Klingbeil 2016; Davison and Pearson 1996). Seasonal changes, such as sand sedimentation, temperature fluctuations, wind stress, and other physical factors, further alter habitat conditions and can influence organism activities (Lan and Huang 2024; Ly and Huang 2022; Yu et al. 2020).
Our study aimed to achieve two objectives: (1) to use statistical analysis to assess the consistency of data quality in community-based citizen science with or without direct involvement from scientists and (2) to understand biodiversity in the TAR coastal habitat by examining different aspects of temporal and spatial environmental heterogeneity.
2 Methods and Materials
2.1 Citizen Science
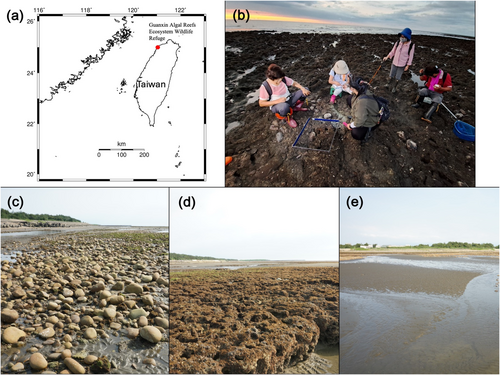
We developed the citizen science project following the framework outlined by Bonney et al. (2009). After extensive discussions, the local community of Yongxing agreed to collaborate with our team, and approximately 20 participants joined this project. On July 13, 2022, local collaborators and our team jointly scouted suitable survey areas and ultimately selected a location near 25°00′27.6″ N, 121°01′36.7″ E (Figure 1a) along the coastal zone in the Guanxin Algal Reefs Ecosystem Wildlife Refuge. We identified three distinct habitats: pebble, algal reef, and sand (Figure 1c–e) within the refuge, similar to Yu et al. (2020). All survey permissions were granted by the Office of Coast Administration Construction, Taoyuan City.
Before starting the survey, we conducted multiple training sessions covering topics including wetland ecology, biodiversity, and sampling techniques. These sessions equipped participants with a deeper understanding of the environment, species, and the survey methods they would use in the field.
2.2 Survey Design
Our team designed a hands-on standard operating procedure (SOP) for the local community to understand the coastal habitat better and simplify the survey process. We divided participants into three tidal groups based on tidal zones: high, mid, and low tide zones. Due to the flat slope of the survey area with the sublittoral zone extending approximately 300 m from the shore, we define the tidal zones as follows: The areas within 0–100 m from the shore were the high tide zones, 100–200 m were the mid tide zones, and beyond 200 m were the low tide zones.
Each tidal group was assigned to survey three different habitats within their zones: pebble, algal reef, and sand. We constructed quadrats (50 × 50 cm) for sampling (Figure 2b). We used 0.25 m2 quadrats to increase sample size and improve efficiency (Pringle 1984), and our tube-based design made them easy for local residents to carry during surveys. Each group collected data from nine quadrats, with three replicates for each of the three habitats. The sampling method used was intentional sampling, where group members visually identified areas with relatively high species abundance and placed the quadrats based on group discussions. Although the intentional sampling method may overestimate the biodiversity index, the results remain valuable for comparing different environments and providing insight. All surveys were conducted during low tide.
After placing a quadrat, the group members collected all macro-organisms (> 5 mm) into a bucket. They then identified the species, counted the individuals of each species, and recorded the data. For unidentified species, members promptly posted photos with the codes to a virtual community (via Line) for assistance and later discussed findings with other members and scientists or consulted books and online resources.
The surveys were conducted once per season. In 2022, the survey dates were August 14th (summer) and October 29th (autumn). In 2023, they were January 8th (winter) and March 12th (spring). Surveys took place at night, typically from 18:00 to 20:00 (19:00 to 21:00 in summer). During these four dates, scientists accompanied local residents to conduct the surveys. After our research team had completed the project, the local community found its significant value in understanding their environment. Inspired by this experience, residents continued the surveys independently every month using the same methods. In 2023, additional surveys were conducted on April 23th, May 11st, June 20th, July 21th, August 21st, September 19th, October 19th and November 1st. A total of 14,105 individuals across 94 species were recorded during the surveys.
2.3 Comparison of Data Consistency With and Without Scientists
The sample sizes for CV were 36 for the dataset collected with scientists and 72 for the dataset collected without scientists. If the data were found to be consistent, we combined the datasets with and without scientists to analyse the overall patterns of micro-habitats and seasonal variations. Conversely, if the data were not consistent, we separately analysed both datasets to identify differences and understand the underlying mechanisms.
2.4 Data Analysis
We conducted the Shapiro–Wilk test, which indicated that the data did not follow a normal distribution (p < 0.001). As a result, we applied non-parametric methods for the subsequent analyses. Specifically, we compared abundance (number of individual organisms), species richness (total species count), and the Shannon diversity index (a measure of biodiversity) across various micro-habitats, tidal levels, and seasons. These comparisons were made to provide a comprehensive understanding of the ecological patterns and biodiversity in the coastal habitat surrounding the Yongxin community.
The number of species typically increases with greater investigative effort. As recording all species during field surveys is impractical, species accumulation curves are commonly used to estimate the total species richness. In this study, the iNEXT function from the iNEXT package was employed to estimate the accumulated number of species across different habitats, tidal zones, and seasons using a rarefaction and extrapolation method (Chao et al. 2014; Hsieh et al. 2020). For extrapolation, the range was set to twice the quadrat sample size for the environmental factors under comparison. In this study, we set an extrapolated range of 216 for total species richness estimation based on the sample size of 108 for each habitat (sand, algal reef, and pebble) and each tide zone (high, mid and low). Similarly, for seasonal curves, the sample sizes for spring, summer, autumn, and winter were 81, 108, 108, and 27, respectively. To ensure consistent predictions, the extrapolated range was set at twice the highest quadrat sample size (108 × 2 = 216). All analyses were conducted using R software and relevant packages (R Core Team 2022).
3 Results
3.1 Comparison of Data Consistency With and Without Scientists
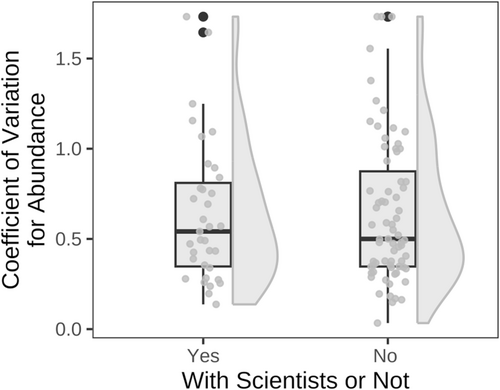
The results indicated no significant difference between the datasets collected with and without the involvement of scientists (with scientists' median = 0.54, without scientists = 0.5; p = 0.95, Mann–Whitney test), suggesting that the data were consistent (Figure 2). Based on these findings, we combined these two datasets to provide a more comprehensive representation of the ecological information in the coastal habitats.
3.2 Biodiversity Around the Yongxing Community in the Guanxin Algal Reefs Ecosystem Wildlife Refuge
3.2.1 Abundance
The results indicated significant differences in abundance across habitats (p < 0.001, Kruskal–Wallis test) (Figure 3a). Pebble and algal reef habitats exhibited significantly higher abundance (median = 34 in pebble; median = 43 in algal reef) than sand habitats (median = 5.5) (p < 0.001 for both, Dunn's test). However, there was no significant difference in abundance between pebble and algal reef habitats (p = 0.17, Dunn's test).
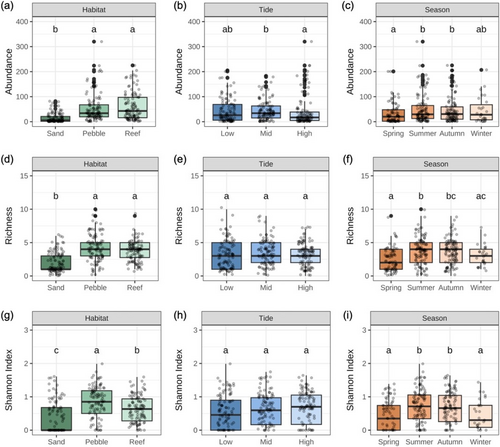
Abundance also showed significant variation across tidal zones (p = 0.03, Kruskal–Wallis test), with higher abundance in the mid tide zone (median = 34) compared to the high tide zone (median = 17) (p = 0.004, Kruskal–Wallis test). There were no significant differences between the high and low tide zones (median = 26) (p = 0.08, Dunn's test) or between the mid and low tide zones (p = 0.11, Dunn's test) (Figure 3b).
Additionally, abundance showed a significant seasonal variation (p = 0.04, Kruskal–Wallis test) (Figure 3c). The abundance during summer and autumn was significantly higher than that in spring (median = 29.5 in summer; median = 30.5 in autumn; median = 20 in spring) (p = 0.002 and p = 0.01, Dunn's test). However, there was no significant difference in abundance between summer and autumn (p = 0.3, Dunn's test). In winter (median = 28), there were no significant differences in abundance compared to spring, summer, and autumn (p = 0.08, p = 0.32, and p = 0.45, Dunn's test).
3.2.2 Richness
In terms of richness, significant differences existed among habitats (p < 0.001, Kruskal–Wallis test) (Figure 3d). Pebble and algal reef habitats had higher richness (median = 4 in pebble; median = 4 in algal reef) than sand habitats (median = 1) (p < 0.001 for both, Dunn's test), but there was no significant difference between pebble and algal reef habitats (p = 0.17, Dunn's test).
Among tidal zones, no significant differences in richness were observed (p = 0.4, Kruskal–Wallis test) (median = 3 in each tidal zone) (Figure 3e).
However, significant differences did exist in seasonal variations (p < 0.001, Kruskal–Wallis test) (Figure 3f). The richness in spring was not significantly different from that in winter (median = 2 in spring; median = 3 in winter) (p = 0.07, Dunn's test). Summer richness (median = 4) was higher than in spring and winter (p < 0.001 and p = 0.03, Dunn's test), but no significant difference existed for autumn (median = 4) (p = 0.2, Dunn's test). Richness in autumn was higher than that in spring (p < 0.001, Dunn's test), but there was no significant difference from winter (p = 0.1, Dunn's test).
3.2.3 Shannon Index
Regarding the biodiversity index (Shannon index), significant differences existed among habitats (p < 0.001, Kruskal–Wallis test) (Figure 3g). Pebble habitat had a significantly higher Shannon index than both algal reef and sand habitats (median = 0.85 in pebble; median = 0.63 in algal reef; median = 0.00 in sand) (p = 0.005 and p < 0.001, Dunn's test). The Shannon index for algal reef habitat was significantly higher than that for sand habitat (p < 0.001, Dunn's test).
In tidal levels, no significant difference was observed in the Shannon index (median = 0.7 in high tide; median = 0.6 in mid tide; median = 46 in low tide) (p = 0.11, Kruskal–Wallis test) (Figure 3h).
Among seasonal variations, significant differences were found in the Shannon index (p < 0.001, Kruskal–Wallis test) (Figure 3i). Summer and autumn did not show a significant difference (p = 0.28, Dunn's test), but summer was higher than both spring and winter (median = 0.71 in summer; median = 0.66 in autumn; median = 0.35 in spring; median = 0.3 in winter) (p < 0.001 and p = 0.02, Dunn's test), and autumn was higher than both spring and winter (p < 0.001 and p = 0.04, Dunn's test). There was no significant difference between spring and winter (p = 0.3, Dunn's test). In conclusion, the Shannon index follows the pattern: Summer = Autumn > Spring = Winter.
3.3 Estimation of Accumulated Richness and Shannon Index by iNEXT Function
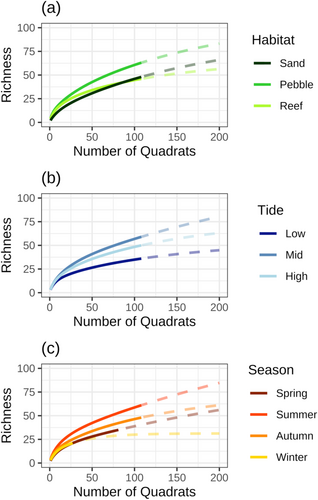
Among habitats, pebble habitats exhibited the highest estimated species richness, with approximately 86 species, followed by sand habitats with around 68 species and algal reefs with 56 species (Figure 4a). For tidal zones, the mid tide zone had the highest accumulated richness, reaching an estimated 84 species, followed by the high tide zone with approximately 65 species, and the low tide zone with the lowest richness at 46 species (Figure 4b). Seasonal variation also showed notable differences, with summer having the highest estimated richness of 88 species, followed by autumn with 63 species, spring with 58 species, and winter with only 31 species (Figure 4c).
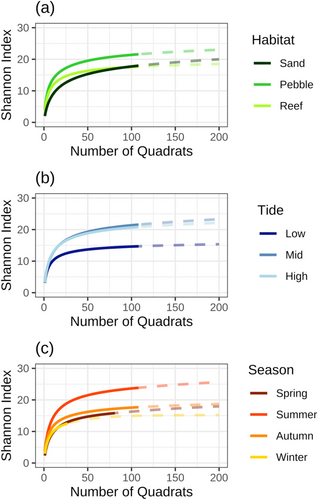
In addition to species richness, Shannon diversity indices highlighted similar patterns. Among habitats, pebble habitats had the highest estimated Shannon index at 23.2, followed by sand habitats at 20.2 and algal reefs at 18.6 (Figure 5a). For tidal zones, the mid tide zone exhibited the highest Shannon index at 23.5, followed by the high tide zone at 22.3 and the low tide zone at 15.4 (Figure 5b). Seasonal differences in the Shannon index were also evident, with summer showing the highest diversity at 25.9, followed by autumn at 18.8, spring at 18.1 and winter at 15.2 (Figure 5c). These findings underscore the importance of habitat and temporal variability in shaping species richness and diversity patterns within the study area.
4 Discussion
Our study provides quantitative evidence through statistical testing that community-based citizen science data remain consistent, regardless of scientists' direct involvement. This suggests that well-trained citizen science participants in this study can produce reliable data, consistent with findings from other studies, such as van der Velde et al. (2017). Additionally, a large group of participants may enhance reliability, as they can supervise one another to ensure data quality. However, determining the optimal number of participants required to maintain data quality is an important research question that warrants further study. As there were no significant differences in data variability (CV) and exhibited similar patterns in both datasets (Figure 2), suggesting that the data are robust enough to be combined and thereby offer a comprehensive view of biodiversity in the Guanxin Algal Reefs Ecosystem Wildlife Refuge.
Regarding biodiversity across different habitats, species abundance and richness in pebble and algal reef habitats were higher than those in sand habitats (Figure 3a,d,g). The low-complexity sand habitat lacks the three-dimensional structure essential for supporting diverse species, highlighting the importance of surface rugosity and habitat complexity as key factors influencing organism abundance and richness (Hutchinson 1959; Johnson et al. 2003; Yu et al. 2020). Kostylev et al. (2005) also found that as fractal dimensions increased, the relative abundance of small organisms rose, reflecting the strong influence of surface complexity on abundance.
Regarding the Shannon index, pebble habitats scored significantly higher than algal reef and sand habitats, which aligns with some public statements made during the 2021 referendum about the high biodiversity of algal reefs (Lin et al. 2022). The high biodiversity observed in pebble habitats may result from higher species evenness than algal reefs and sand habitats. Although a species of sea snail (Batillaria sordida) is the dominant species across all three habitats throughout the seasons (Data S1), its relative abundance in algal reefs is higher, indicating a more homogenous community there. This relative dominance of a single species may lead to the decreased Shannon index for algal reefs compared to pebble habitats. In contrast, the low richness in sand habitats results in a similarly low Shannon index. The limited spatial structure of algal reefs constrains their capacity to host diverse species, favouring only specific inhabitants, whereas the larger pebble habitat provides ample space for a greater variety of species. For example, Li et al. (2021) mentioned that many swimming crab species were found in algal reef habitats, though they are thought to be more likely associated with tidal pools in sand or with pebble habitats rather than with algal reefs directly.
Tidal zone differences can be considered as types of habitat variation. Different tidal zones are characterized by distinct environmental factors, such as wave exposure and duration of sun exposure during low tide, which affect humidity, temperature, and salinity (Bertness et al. 2001; Davison and Pearson 1996; Wright et al. 2004). In our study, we found that the mid tide zone has the highest abundance, which is reasonable, as this zone connects the high and low tide areas and can be considered an ecotone. The dominant species in the low and mid tide zones across all seasons is B. sordida (Data S1). However, in the high tide zone during spring and winter, the dominant species became the sessile barnacles (Amphibalanus amphitrite) instead of free-moving B. sordida (Data S1), indicating that environmental factors in the high tide zone during colder seasons may have a greater impact on species composition.
Seasonal variation refers to temporal changes that are influenced by environmental factors such as temperature, salinity, wind direction, dissolved oxygen levels, pH levels and sediment composition (Bellino et al. 2019; Da Costa et al. 2011; Josefson and Hansen 2004; Kuo et al. 2020; Lercari and Defeo 2006; Neto et al. 2015). Coma et al. (2000) also mentioned that seasonal fluctuations in algal abundance play a crucial role in shaping community structure. Our results align with other studies, showing that summer and autumn have the highest abundance and richness, e.g., (Hsu et al. 2018; Li et al. 2022), and also consistent with research conducted in TAR (Li et al. 2021; Yu et al. 2020). Although B. sordida is dominant in several seasons across different habitats and tidal zones (excluding the high zone), the composition of other species changes across seasons. For example, a species of barnacle (Amphibalanus reticulatus) can reach 35.6% as the second most abundant species in pebble habitats during winter, whereas in other seasons in pebble habitats, the second most abundant species is a species of limpet (Cellana toreuma) (Data S1). Further research is needed in TAR to understand the mechanisms behind spatial and temporal variations in specific species.
Increasing the sampling effort is likely to accumulate more species. The species accumulation curves generated by the iNEXT function help predict potential species richness, especially when sampling may be limited (Chao et al. 2014; Hsieh et al. 2020). By doubling the sampling effort, most observed patterns and results align closely with the current findings. However, one notable difference appears in the habitat types: With twice the sampling effort, species richness and Shannon index in the sand habitat are expected to surpass that in the algal habitat, suggesting that the sand habitat may harbour greater diversity than the algal reef. The sand habitat, though seemingly less complex than algal reefs, may provide a range of microhabitats or niche spaces (e.g., burrows, sediment layers, or organic matter in the sand) that can support diverse species (Brown and McLachlan 2010; Sassa and Yang 2019). These niches could potentially harbour more species than the more visibly complex algal habitat, which might have fewer available microhabitats for certain taxa. Although pebble habitats exhibit the highest biodiversity, the patchiness of habitat distribution promotes high biodiversity overall (Cacabelos et al. 2019). Thus, each habitat plays a crucial role in supporting the ecosystem as a whole within TAR.
In this study, we confirm that community-based citizen science data can enhance knowledge of coastal habitats and provide local residents with opportunities to learn about the environment surrounding their homes. Bonney (2021) noted that the growth of community-based citizen science is driven by public frustration with the scientific community's perceived inability or indifference to investigate and address environmental challenges effectively. Our case aligns with Bonney's (2021) assertion that local communities, driven by ongoing socio-environmental challenges, recognize the need to deepen their understanding of their immediate environment. However, maintaining a citizen science project poses significant challenges, including insufficient funding, high participation barriers, poor experimental design, delays in disseminating results, difficulties in volunteer cooperation, policy changes, and other factors—all of which can contribute to project failure (MacPhail and Colla 2020). Additionally, understanding participants' motivations and meeting their expectations are essential for sustaining a project (Hsu and Lin 2021).
Our design for this citizen science project simplified the methodology, making it accessible to residents while maintaining scientific standards. For instance, we used 0.25 m2 quadrats as a sampling method to increase sample size and improve efficiency (Pringle 1984). Additionally, the small quadrats made from tubes were easy for local residents to carry during surveys. However, different citizen science projects have developed their own simplified approaches to encourage participation. For example, the Taiwan Roadkill Observation Network allows participants to complete data collection simply by using a reference standard, such as a ruler, and taking a photograph to upload to the database (Hsu and Lin 2023). The subsequent identification of dead animals and further analysis are then handled by scientists. In a citizen science project on land crabs, Hsu et al. (2023) also developed a method to easily measure large land crabs without direct contact. Vermeiren et al. (2016) provide a hierarchical toolbox with different methods suited to various levels of monitoring for tropical coastal ecosystems. Accordingly, simplifying methodologies should be tailored to the specific project objectives and the skill level of participants.
From our perspective, we hope that the local community can continue conducting regular surveys. Additionally, as the Taoyuan Algal Reef coastline consists of many communities, we hope that others can also participate. In fact, some participants from neighbouring communities joined our project to learn how to conduct scientific surveys and sustain the citizen science project. Regarding whether effective monitoring is possible without scientists, we believe that the community can successfully implement a monitoring protocol. According to our study, even in years when no scientists participate, residents can secure alternative funding to support their surveys while maintaining data consistency. Furthermore, during their self-survey periods, they actively invited scholars from various fields to enhance their knowledge. Therefore, additional training sessions from our team seem less necessary. These findings highlight the community's ability to independently sustain long-term monitoring efforts, demonstrating the effectiveness and resilience of citizen science in ecological monitoring.
5 Limitation
Our study utilizes citizen science data to assess biodiversity across different environmental factors in the TAR; however, certain limitations must be acknowledged. Our use of intentional, non-randomized sampling likely led to an overestimation of biodiversity values. Therefore, these values should only be compared with studies using the same methodology. Despite this limitation, the data provide a reliable basis for assessing temporal and spatial variations in the area.
Although community involvement in data collection is valuable and meets scientific criteria, local participants often face challenges in data analysis and interpretation. As a result, community-based citizen science projects still require collaboration with scientists to ensure accurate data analysis and knowledge translation. Furthermore, biodiversity assessments should not be limited to macro-organisms but should also consider smaller species and microorganisms (Egan et al. 2013). However, incorporating microorganism monitoring into community-based citizen science projects may increase the level of difficulty. Nevertheless, monitoring microorganisms remains important in citizen science, especially for addressing environmental pollution issues (Castilla et al. 2015). If the community can establish an experimental laboratory and receive proper training, it may become possible to monitor microorganisms in the future (Van Etten et al. 2022).
6 Conclusion
We confirm that community-based citizen science data aligns well with data collected by scientists. The Shannon index indicates that the pebble habitat has higher diversity than the algal reef and sand habitats. The mid tide zone has a higher abundance, though there are no significant differences in richness or Shannon index among the tidal zones. Summer and autumn exhibit the highest abundance, richness, and Shannon index. Species accumulation curves, calculated with double the number of sampling quadrats, reveal a similar pattern; the only difference is that the sand habitat's richness surpasses that of the algal reef. Our research provides objective findings that enable local residents to better understand their environment, and it can also serve as a valuable reference for the public.
Author Contributions
Chia-Hsuan Hsu: conceptualization, investigation, funding acquisition, writing – original draft, writing – review and editing, visualization, validation, methodology, formal analysis, project administration, resources, supervision, data curation. Jiefeng Kang: methodology, software, data curation, formal analysis, validation, visualization, writing – original draft. Yuan-Mou Chang: writing – original draft, writing – review and editing, validation. Liang-Yu Yeh: investigation, data curation. Chang-Po Chen: conceptualization, supervision, resources, methodology. Hwey-Lian Hsieh: supervision, resources, conceptualization. Hsing-Juh Lin: resources, supervision, funding acquisition.
Acknowledgements
We thank all citizen scientists who participated in this survey. We especially appreciate the support of the Yongxing Community Development Association. We also extend our gratitude to the assistants from Innovation and Development Center of Sustainable Agriculture of National Chung Hsing University and Mr. Zhe-Yu Lin for their help in ensuring the smooth progress of our research.
Ethics Statement
The permit for this study in the Guanxin Algal Reefs Ecosystem Wildlife Refuge was issued by the Office of Coast Administration Construction, Taoyuan, Taiwan.
Conflicts of Interest
The authors declare no conflicts of interest.
Open Research
Data Availability Statement
The data that support the findings of this study are available on request from the corresponding author. The data are not publicly available due to privacy or ethical restrictions. The data are available on the Figshare platform: 10.6084/m9.figshare.28721963.v1.


