Rural Transformation, Water Scarcity and Policy Responses in China
Funding: This work was supported by Australian Center for International Agricultural Research (ADP/2017/024), Ministry of Science and Technology of China (2021YFC3200500), and National Natural Science Foundation of China (41861124006, 71874007).
ABSTRACT
This study examines the complex interplay between rural transformation and water scarcity in China, focussing on how shifts towards high-value agriculture and non-farm employment affect water resources. Utilising data spanning 2 decades, it evaluates the impact of economic activities on water scarcity through the lens of the Environmental Kuznets Curve. The analysis reveals regional variations in water usage and scarcity, highlighting the need for tailored water management strategies that incorporate both supply and demand aspects. By aligning rural economic development with sustainable water use, the paper offers insights into policy adjustments crucial for balancing growth with environmental stewardship, particularly in light of Chinaʼs green economy transition and its implications for similar developing regions.
1 Introduction
Rural transformation (RT) involves sweeping structural changes, which can happen within the agricultural sector and between agricultural and other sectors in rural areas (D. Wang et al. 2023). A successful rural transformation relies on good policy facilitation and is regarded as a way of achieving the Sustainable Development Goals (SDGs) through promoting rural development. On the other hand, rural transformation can result in severe environmental impacts on sustainability, such as water and air pollution, carbon emission, deforestation, etc, leading to an issue that some SDGs, like poverty reduction and development goals, would conflict with others, like environmental and sustainability goals, during some stages of RT. The traditional path of economic growth-oriented development has been resulted in many countries bearing heavy resource and environmental costs in the RT (FAO 2023; FAO-HLPE 2019; J. Wang et al. 2020). This dilemma puzzles policymakers and practitioners in many developing countries. Therefore, it needs a better understanding of the relationship between RT and sustainability and the role of public policies.
The relationship between economic growth and environmental degradation has been extensively debated in literature and a notable concept in this discourse is the Environmental Kuznets Curve (EKC) which was introduced in the early 1990s (Grossman and Krueger 1991; Shafk and Bandyopadhyay 1992). The EKC postulates an inverted U-shaped correlation between economic growth and environmental degradation, suggesting that economic growth would initially exacerbate environmental degradation until some point then eventually leading to environmental improvement.
While numerous studies support the EKC hypothesis, it has faced criticism on several fronts. For example, some criticise that the EKC does not universally apply across all environmental indicators, is contingent on the reversibility of environmental damage, and overlooks various factors that could limit an economyʼs growth potential (Dasgupta et al. 2002; Karsch 2019; Kaya Kanlı and Küçükefe 2023; Mills and Waite 2009). These critiques underscore the need for a development trajectory that prioritises environmental sustainability at all stages of economic growth. Importantly, the current development model, characterised by a stark trade-off between economic objectives and environmental goals, casts a shadow over the prospects of attaining the 2030 Sustainable Development Goals (SDGs) (Wu et al. 2023).
In this paper, we use Chinaʼs experience as an example to discuss the relationship between rural transformation and one major environmental factor-water scarcity. Rural transformation and water scarcity are two research topics that have received considerable attention; many studies have conducted separate analyses on these two issues, with few considering their interrelation and coordination, say, there is a scarcity of research specifically exploring the existence and underlying reasons for an Environmental Kuznets Curve (EKC) between rural economic transformation and water scarcity. For example, increasing studies focus on rural transformation, particularly its connotations and characteristics, levels and speeds of transformation, and its impact on non-agricultural employment, income, poverty, and other socioeconomic effects. Yet, few studies examine the impact of rural transformation on water scarcity and the strategies adopted to address it (Huang 2022; Huang and Shi 2021; International Fund for Agricultural Development 2016; Otsuka and Zhang 2021). Additionally, some research assesses the situation of water scarcity at different regional scales—from global to specific local areas—along with the impacts of climate change and socio-economic factors (industrialisation, urbanisation) on water scarcity (Bhattarai et al. 2023; He et al. 2021; M. Wang et al. 2024; Yoon et al. 2021). However, there is a limited focus on analysing the impact of rural transformation on water scarcity and addressing adaptive responses of water management, policies, and institutions. Finally, although some scholars have explored Chinaʼs water shortage and examined the response strategies of water management, policies, and institutions (J. Wang et al. 2017 2019, 2020), there remains a significant gap in the literature regarding the interconnection between these water challenges and the process of rural transformation.
Water resources are of particular interest to us for several reasons. Firstly, they are one of the major constraints on rural development in many countries. The water issue can obstruct the agricultural production system from transforming towards high-value crops that demand more water resources. They can also limit industrial development in some rural areas that are vulnerable to water scarcity. Amid escalating competition for water among various sectors and the uncertain impacts of natural factors such as climate change, the agricultural sector faces increasingly severe water scarcity pressures and the risk of uncertain water supply. Thus, sustainable water uses while promoting high-quality rural transformation is a critical issue directly related to government policymaking. Solving this issue also contains global meaning, as some studies indicate that over the past century, 77% of the increase in human water use has originated from developing countries, which now face a crucial decision-making period on how to accelerate rural transformation and promote sustainable development (Zhou et al. 2020).
On the other hand, a successful RT can also help conserve water resources.
For instance, under the constraints of limited water resources, the global share of water used by the agricultural sector has decreased from 90% in the 1960s to 60% in 2023. In China, water consumption by the agricultural sector dropped from 97% in 1949 to 63% in 2022 (FAO 2023; Ministry of Water Resources 2023). A better policy design and implementation need to navigate the challenging dynamical two-way relationship between rural transformation and water scarcity is particularly pronounced in developing countries. The ability to effectively address this issue is directly linked to the achievement of the United Nations Sustainable Development Goals by 2030.
We take Chinaʼs experience as one example because China is a typical representative of developing countries undergoing a successful rural transformation as well as facing severe water resource scarcity, particularly with the highest proportion of irrigated land. The Chinese experience of dealing with water scarcity in RT is representative of the East Asia model of rural development, which can deliver messages to other similar countries in Southeast Asia, South Asia and even Africa.
The primary objective of this paper is to realize the win-win policy targets of promoting successful rural transformation and maintaining the sustainable utilization of water resources in China. We aim to achieve this by examining the impact of rural economic transformation on water resource scarcity and evaluating the policy strategies that have been implemented over the past 2 decades. We believe that Chinaʼs experiences hold valuable lessons and insights that can benefit other developing countries facing similar challenges.
In this paper, we raise one critical question that how does rural development would influence water resource scarcity: Does rural transformation exacerbate or alleviate the state of water resource scarcity? Does this impact vary with different stages and characteristics of rural transformation in China? Additionally, we seek to explore strategies for effectively leveraging policy measures to harmonise these relationships, mitigate their conflicts, and achieve synergistic outcomes. Specifically, what changes in water management, policy, and institutions have reconciled the conflicting relationship between rural transformation and water resource scarcity?
The paper is structured as follows: Section 2 presents the data sources, definition of key variables, and the study region. Section 3 analyses the change trend of rural transformation and water scarcity over the past 2 decades in China and their correlation. Section 4 describes policy responses dealing with water scarcity. Section 5 introduces concluding remarks.
2 Measurement, Study Regions, and Data
2.1 Measurement
We enrol the agricultural transformation (RT1) and the employment transformation of rural labours (RT2) to indicate rural transformation in China, following the approach widely adopted in the literature (Huang and Shi 2021; International Fund for Agricultural Development 2016; Otsuka and Zhang 2021). RT1 refers to the proportion of high-value products in the total agricultural output values (RT1), measuring the structural transformation of agricultural production. RT2 is the proportion of rural labours with non-farm employment, measuring the transformation of rural labour employment. The high-value products are non-grain products, including cotton, oil crops, sugar crops, horticulture, livestock and aquaculture. High-value products have much higher net profits per unit area compared to grain crops (such as rice, wheat, maize, and soybean). The output values of high-value agriculture are calculated by the gross output values of farming, animal husbandry and fishery minus the output value of grain crops. The number of rural labours engaged in non-farm sectors is estimated by total rural labours minus agricultural labours.
Both indicators are widely adopted in the literature and are effective in capturing the economic restructuring in rural areas, thereby making them appropriate for assessing rural transformation. RT1 measures the structural transformation of agricultural production by capturing the shift from traditional, low-value grain crops to high-value products, such as cotton, oil crops, sugar crops, horticulture, livestock, and aquaculture. High-value products, which yield higher net profits per unit area compared to grain crops, reflect increased productivity and economic efficiency, key goals of rural transformation (Huang and Shi 2021). RT2 measures the transformation of rural labour by assessing the proportion of rural labourers engaged in non-farm employment, which indicates economic diversification and development, crucial elements of reducing rural poverty and promoting sustainable development (Huang and Shi 2021). The rationality of using these two indicators lies in their ability to comprehensively capture the economic restructuring occurring in rural areas, thus making them appropriate for assessing rural transformation.
We measure Chinaʼs water scarcity using two of the most widely used international indicators: per capita water resources and water utilization rate. Per capita water resources is the most commonly used indicator of water scarcity in the world. It was proposed by Falkenmark et al. (1989) and has been widely used around the world since then (Gosling and Arnell 2016; Hao et al. 2022; Liu et al. 2017; Nouri et al. 2023; Ohlsson 1998). Falkenmark et al. (1989) defines this indicator as the ratio of total local water resources to the local resident population, reflecting the average amount of water per person per year. According to this indicator, we can measure the local water shortage. If the amount of per capita water resources is less than 1,700 m3, it is said to be in a water stress state. If it is less than 1000 m3, it is said to be in a water scarce state. If it is less than 500 m3, it is said to be in an absolute scarcity state (Falkenmark, Lundqvist, and Widstrand 1989; Falkenmark and Rockström 2004). The water utilization rate, also first proposed by Falkenmark (1997), is another widely used indicator for evaluating water scarcity (Alcamo et al. 2003; Alcamo and Henrichs 2002; Flörke et al. 2013; Wada, Wisser, and Bierkens 2014). It is defined as the ratio of local water withdrawal to total local water resources. The advantage of this indicator over others is that it measures water use and relates it to total water resources (Alcamo and Henrichs 2002). Similar to per capita water resources, there is a threshold for measuring whether water scarcity is occurring. When the water utilization rate is higher than 40%, there is high local water stress and water scarcity occurs (Alcamo and Henrichs 2002).
2.2 Study Regions
Chinaʼs approach to designing policies for agricultural and rural development often transcends provincial boundaries, extending consideration to broader regional contexts. Traditionally, China is divided into seven agricultural regions (Figure 1). Some provinces that share similar natural conditions are grouped into one region. This paper follows this traditional way of analysing at the regional level (Fischer et al. 2007). Each region in China has distinct natural conditions and geographical features shaping its development. The Huang-Huai-Hai Plain (3H) includes Beijing, Hebei, Henan, Shandong, and Tianjin, featuring a temperate climate and flat terrain ideal for wheat and corn farming, alongside heavy industrialisation. Northeast China, covering Heilongjiang, Jilin, Liaoning, and part of Inner Mongolia, has cold winters and mild summers, with extensive plains and forests supporting agriculture, particularly cereals and soybeans. Southeast China, including Fujian, Guangdong, and Hainan, benefits from a humid subtropical to tropical climate, favouring rice and tropical fruits, with geographical diversity supporting dense populations and economic vitality. The Middle and Lower Yangtze River Plain (Yangtze) spans Anhui, Hubei, Hunan, Jiangsu, Jiangxi, Shanghai, and Zhejiang, known for its fertile lands and major industrial activities aided by the Yangtze River. Northwest China, with Gansu, Ningxia, Shanxi, Shaanxi, and Xinjiang, has an arid climate and limited agriculture but is rich in mineral resources. Southwest China includes Guangxi, Guizhou, Sichuan, Yunnan, and Chongqing, characterised by varied climates and a mix of biodiversity and cultural diversity. The Qinghai-Tibet Plateau, covering Qinghai and Tibet, is the highest plateau globally, with harsh conditions and notable cultural heritage.
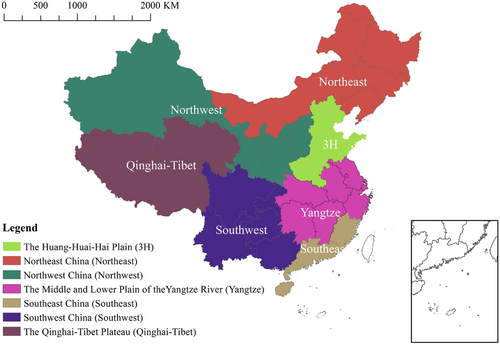
Seven agricultural regions in China.
Under the background of their different natural conditions and geographical locations, the agricultural production and economic development levels in these regions show different characteristics. Excluding the Qinghai-Tibet region, farming holds a larger share of the output value in the remaining six regions compared to fishery and livestock. The northern regions of China, encompassing the Northwest, the 3H, and Northeast, play a more crucial role in the countryʼs farming compared to the Southern regions of China such as the Southeast regions. They contribute a higher proportion of farming output values to the total agricultural output values compared to other regions. The output values of fishery in the two more developed regions (Yangtze and Southeast regions) obviously contribute more to the total agricultural output values compared to other regions. The proportion of the output value of fishery to the total agricultural output values in the two regions is 20% and 29%, respectively. In contrast, this proportion in other regions does not exceed 8%. Livestock in the Qinghai-Tibet region surpasses that in other regions. The proportion of livestock in this region accounts for 55%, which is the largest among these regions, while the proportion of crop cultivation and fisheries in this region accounts for 45%, 1%, which is the smallest among these regions. Among these regions, the Southeast and Yangtze regions are notably more advanced than others, with a per capita GDP exceeding 60,000 yuan in 2018 (National Bureau of Statistics of China 2019). The Southwest and Qinghai-Tibet regions are comparatively less developed, with a per capita GDP below 50,000 yuan in 2018. The per capita GDP of other regions is between 50,000 yuan to 60,000 yuan in 2018, placing them in the category of medium-developed regions.
2.3 Data Sources
The price data for calculating RT indictors is derived from the Data Compilation on Production Cost and Benefit of Nationwide Agricultural Commodities published by the National Bureau of Statistics of China. Beyond that, other data utilised for computing the indicators of RT are sourced from the provincial Statistical Yearbooks published by the Statistic Bureau of each province. These provincial data were further aggregated to regional levels. These data span the period from 1998 to 2018, enabling us to trace the trends of rural transformation in China and by region over the past 2 decades. All the municipalities were regarded as outliners and excluded in this study because of their unique development model in China. To simplify the presentation, in certain contexts, we only show data for five years in 1998, 2003, 2008, 2013 and 2018.
The two indicators we use in the article come mainly from two databases. The first one is the China Water Resources Bulletin published by the Ministry of Water Resources of the Peopleʼs Republic of China from 1998 to 2018. This bulletin contains the amount of precipitation, the amount of surface water resources, the amount of underground water resources, the total amount of water resources, the amount of water supplied, and the amount of water used for the whole country, each provincial administrative region, and water zones. It is the most detailed annual water resources statistical bulletin in China. The second is the China Statistical Yearbook from 1999 to 2019. Compiled by the National Bureau of Statistics (NBS), this yearbook provides detailed statistics on all aspects of the economy and society in all provinces of the country, fully reflecting the economic and social development of the Peopleʼs Republic of China. The resources and environment section also records in detail the water resources as well as water supply and water consumption of all provinces in the country over the years. Based on these two databases, we have collected data on per capita water resources and water utilization rate from 1998 to 2018 for all provinces, basins and the country as a whole.
3 Correlation Between Rural Transformation and Water Scarcity
3.1 Rural Transformation in the Past 2 Decades
As mentioned, we observe rural transformation from the agricultural production shifts from low-value to high-value (RT1) production, and the rural employment shifts from farming to non-farming activities (RT2).
In Figure 2a, we can see a significant shift in agricultural production from being grain-dominated to focussing on high-value crops, livestock, and fish in China during the past 2 decades. The high-value agriculture proportion showed a noticeable rise from 1998 to 2018, climbing from 75% to 87%, marking a 12% increase. The most substantial surge occurred between 1998 and 2003, reaching 8%, followed by the second-largest increase of 3% between 2013 and 2018. Only a 1% increase occurred from 2003 to 2013. The slowdown of the growth rate could be partly explained by the governmentʼs increased enhancement of grain security (Huang and Shi 2021). The high-value agriculture constituted approximately 87% in 2018 at the national level.
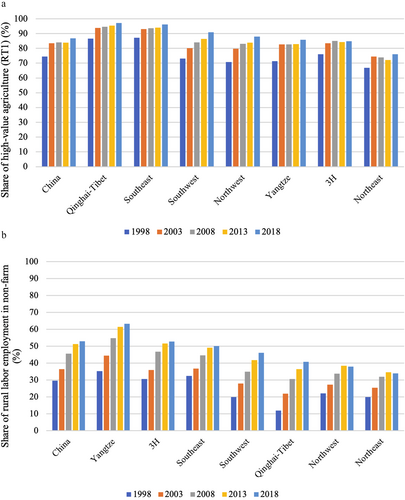
(a) RT1 in China and by region (1998–2018). (b) RT2 in China and by region (1998–2018).
At the regional level, the high-value agriculture proportion in Qinghai-Tibet, Southeast, and Southwest regions surpass the national average, both above 90%. This could be attributed to Qinghai-Tibetʼs developed animal husbandry and Southern Chinaʼs thriving fishing industry. The Northwest, Yangtze, and the 3H regions are close to the national average (ranging between 85% and 88%). The proportion of high-value agriculture in the Northeast region is the lowest at 76%. This region lags behind in terms of RT1 because it is characterised as major production base of grain crops, especially corn and soybeans in China (Chinese Academy of Sciences 2023). The Southwest, Northwest, and Yangtze regions exhibited a higher increase in high-value agriculture proportion (larger than 15%) compared to the 3H and Northeast regions (less than 9%), despite these regions having similar high-value agriculture proportion levels in 1998 (between 71% and 76%). This may be due to the fact that the 3H and Northeast regions occupy a higher position in staple grains production compared to other regions, attributable to their mild climate and extensive plains, as mentioned in Section 2.2.
On RT2, we can see a relatively moderate rural transformation with significant regional disparity in Figure 2b. Fifty three percent of rural labourers were engaged in non-farm activities by 2018 at the national level. The Yangtze region exhibited the highest share of non-farm employment in rural labours at 63% in 2018. This region is always regarded as a rapidly developed region. Our data shows even though the RT1 of the Yangtze region is almost close to the national average, the RT2 in this region significantly exceeds the others. It suggests the RT in the Yangtze region is mainly driven by rural industrialisation and service development. The share of the 3H and Southeast was close to the national average (53% and 50%, respectively). In contrast, Southwest and Qinghai-Tibet reported relatively lower shares (40%–50%). The share in the Northwest and Northeast regions fell in the lowest range (between 30% and 40%).
We can also find that the non-farm employment share increased from 30% in 1998 to more than half in 2018 (53%). Notably, most of this growth occurred before 2013 (increased by 21%), after which there was a notable slowdown in the growth (increase by 2%). The proportion in the Yangtze consistently maintains the highest position in each period, starting from an initial point of 35% and experiencing a substantial increase of 28%. The proportion of rural labourers working in the non-farm in the 3H and Southeast regions exhibited a moderate increase which is close to the national trend. Although the Qinghai-Tibet, Northeast, Southwest, and Northwest regions had a lower proportion of rural labourers with non-farm employment among these regions in 1998 (all below 20%), they achieved varying degrees of increase over time. Specifically, the Qinghai-Tibetʼs proportion stood at 12% in 1998, which is the lowest among these regions, experiencing a remarkable 29% surge over the past 2 decades. The Southwestʼs proportion also achieved a noticeable 26% increase from the level of 20%. Nonetheless, the Northeast and Northwest, which similarly lagged in 1998 (20% and 22%, respectively), exhibited relatively modest growth, with increases of only 14% and 16%, respectively. The rapid growth of RT2, in particular before 2013, manifests a rapid rural industrialisation and service development, which also brought about huge pressures on water use in most areas of China.
Figure 3 displays RT1 and RT2 from 1998 to 2018, with RT1 on the X-axis and RT2 on the Y-axis, enabling a comprehensive tracking of the paths of RT using both indicators. Following the typology method in Shi and Huang (2023), we furtherly categorise the RT path of each region into different combinations of RT1 and RT2 ranges by dividing the difference between the maximum and minimum values of RT1 (or RT2) into three equal ranges (Low, Medium, and High). As Figure 3 shows, the paths of RT by region fall into 7 combinations of RT1 and RT2 ranges. In 2018, the Northeast is low in RT1 and middle RT2, the Northwest is medium both in RT1 and RT2, the Yangtze and the 3H are middle in RT1 and high RT2. The Southeast, the Southwest and the Qinghai-Tibet are high RT1 and middle in RT2.
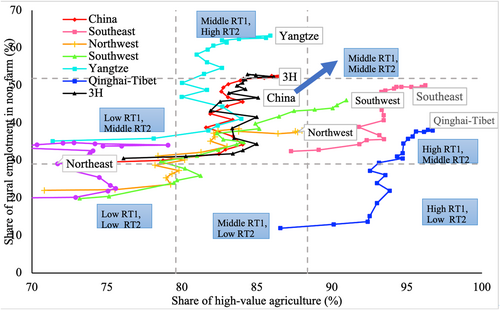
Path of rural transformation by region (1998–2018).
In Figure 3, RT paths of these regions from 1998 to 2018 can be summarised into two stages. During stage I, RT among regions was focused on the shift from low-value agriculture to high-value agriculture, with RT1 moving from the relatively low ranges to the relatively high ranges while RT2 remained in the relatively low ranges. In stage II, the focus was prioritised to the increase of the non-agricultural employment of rural labour experienced a sharp increase, resulting in a sharp rise in RT2 from the relatively low ranges to the relatively high ranges while RT1 remained in the relatively low ranges. Our data indicate the turning point from stage 1 to stage II appeared about in the year 2000, which is embedded within the structural transformation in China economy at the same time, marked by a decline in the contribution of agriculture to GDP and employment, advancements in urbanisation, and the growth of modern industry (Huang and Shi 2021).
3.2 Water Scarcity in the Past 2 Decades
As previously mentioned, we use two internationally common indicators, per capita water resources and the water utilization rate, to assess the water scarcity situation in China. Figure 4a shows the changes in Chinaʼs per capita water resources during the 20-year period from 1998 to 2018. In 2018, Chinaʼs per capita water resources were only 1958 m3, less than a quarter of the worldʼs per capita level. Overall, Chinaʼs per capita water resources show a downward trend, from 2726 m3 in 1998 to 1958 m3 in 2018, a decline of about 30%, which shows that Chinaʼs water shortage is still increasing. Although the downward trend of per capita water resources has eased after the implementation of Chinaʼs strict water resources management policy in 2011, it has not yet returned to the level of 20 years ago, and there is still much room for improvement.
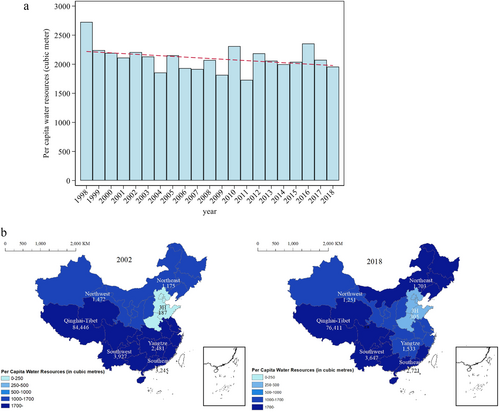
(a) Water scarcity in China during 1998–2018: Per capita water resources. (b) Per capita water resources by region in 2002 and 2018. The earliest available data for this indicator is 2002.
We further show the distribution of Chinaʼs per capita water resources in different regions in Figure 4b. It can be seen that the region with the lowest per capita water resources in 2018 is the 3H region, with a per capita water resources of only 305 m3, which is far below the threshold of 500 m3, and is in an absolute water shortage state (Falkenmark, Lundqvist, and Widstrand 1989). The highest per capita water resource is in Qinghai-Tibet region, with a per capita water resource of 76,411 m3, which is 200 times higher than that of the 3H region. Although Qinghai-Tibet is a special region with abundant water resources and is sparsely populated, it can be seen to some extent that the distribution of water resources in China is very uneven, and the water shortages in different regions are very different. Generally speaking, the water shortage situation in the north is more serious than that in the south. At the same time, we can also compare the changes in per capita water resources from 2002 to 2018. We find that the per capita water resources in the 3H region and Northeast region have increased by 63% and 45%, respectively. However, the 3H region is still in a state of absolute water shortage even though it has increased due to the fact that it has the most serious water shortage situation itself. The per capita water resources in the Yangtze region, Southeast region and Northwest region have further declined, especially in the Yangtze region, where the decline of 38% is the most serious. There is relatively little change in per capita water resources in the Qinghai-Tibet region and Southwest region.
The trend of water utilization rate is slightly different from the per capita water resources, as shown in Figure 5a. It can be seen that overall, the water utilization rate shows an upward and then a downward trend. From 1998 to 2011, the water utilization rate increased from 16% to 26%, but after the implementation of the strict water management policy in 2011, the water utilization rate began to decline, falling to 21% in 2018, and the groundwater utilization rate and surface water utilization rate also showed the same trend, but compared to 20 years ago is still relatively slightly higher, indicating that Chinaʼs water shortage situation still has room for alleviation.
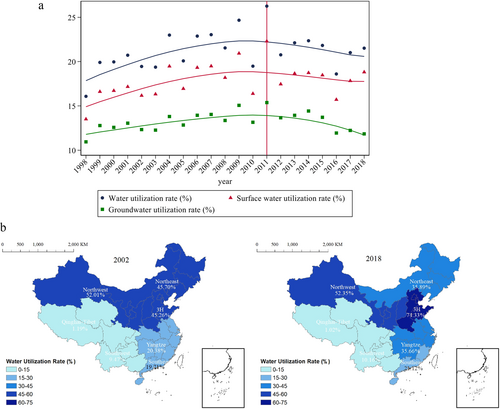
(a) Water scarcity in China during 1998–2018: Water utilization rate. (b) Water utilization rate by region in 2002 and 2018. The earliest available data for this indicator is 2002.
Figure 5b also shows a similar distribution of per capita water resources in different regions, and similar conclusions are found. Chinaʼs water utilization rate also varies greatly in different regions, with the 3H region being the highest, reaching 74%, well above the 40% of water shortage threshold (Alcamo and Henrichs 2002), while the Qinghai-Tibet region is still the lowest, with only 1.02%. The change in distribution from 2002 to 2018 differs significantly from the per capita water resources. The water utilisation rate in the 3H regions did not decrease and even increased by 74%, while another region that increased was the Yangtze regions. Although the Qinghai-Tibet region exhibited a small numerical change from 1.19% to 1.03%, this represents a substantial proportional decrease. Meanwhile, the Northeast region experienced a more significant decline, with the water utilization rate dropping from 45.70% to 35.89%. Other regions, however, showed relatively little change during the same period.
3.3 Correlation Between Rural Transformation and Water Scarcity
In this section, we will further explore the correlation between rural transformation and water scarcity and investigate whether the correlation varies under different stages of rural transformation.
Firstly, Figure 6a,b show the scatter plot and fitted curves, respectively, between per capita water resources and water utilization rate and rural transformation variables at the national level, and the corresponding regression estimation equations of the fitted curves are also shown. It can be seen that both the share of high-value agriculture (RT1) and the share of rural labour employment in non-farm (RT2) show a typical positive U-shaped trend in per capita water resources, while water utilization rate both shows an inverted U-shaped. The estimates with the addition of the quadratic terms are also in line with our expectations, with negative coefficients on the primary terms and positive and significant coefficients on the quadratic terms for per capita water resources. The estimated coefficients of water utilization rate are opposite to those of per capita water resources, and they are also significant. In other words, as the rural economic transformation progresses, water scarcity will increase first. However, when the rural economic transformation reaches a certain stage, the water scarcity situation will be alleviated. The turning points of different water scarcity indicators are very close to each other, approximately when RT1 reaches about 0.8 and RT2 reaches about 0.5, the condition of water scarcity begins to improve. Understanding this turning point is crucial, as it enables the government to effectively balance the dual objectives of rural economic transformation and water resource conservation.
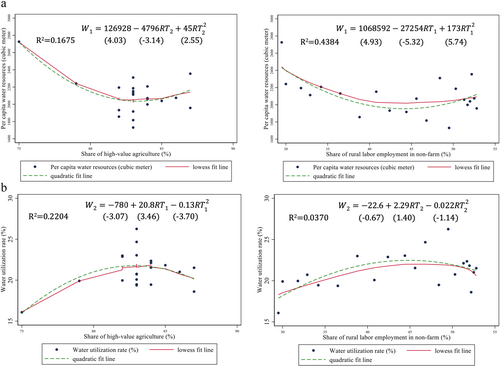
(a) Correlations of RT1 and RT2 with per capita water resources in China. (b) Correlations of RT1 and RT2 with water utilization rate in China.
A reasonable explanation for this phenomenon is that when agricultural production is transformed to high-value agriculture, such as cotton, oilseeds, sugar crops, etc., the water demand of these crops is mostly higher than that of grain crops. So in the early transformation process, there will be a continuous decline in per capita water resources, an increase in water utilization rate, and an aggravation of water resources shortage. However, with the continuous development of rural transformation, the type of employment of rural labourers has been changing to non-agricultural employment. More and more farmers have reduced the scale of agricultural production and shifted to industries with higher water use efficiency, which in turn has led to the alleviation of the water shortage situation. The per capita water resources has begun to rebound, and the water utilization rate has fallen back.
Meanwhile, Figures 7 and 8 demonstrate the relationship between per capita water resources, water utilization rate and agricultural economic transformation in different regions. On the one hand, we can find that most of the regions have the same trend as the national trend, with per capita water resources showing a positive U-shape or both sides of a positive U-shape and water utilization rate showing an inverted U-shape or both sides of an inverted U-shape. Furthermore, because different regions are at various stages of development in their RT1 and RT2, their relationships with the water scarcity indicators are also at different stages. When RT1 is used as the measure of rural transformation, the Northwest region is in the early stage under both indicators, and the development of rural economic transformation will make water shortage intensify. The Yangtze region is in the late stage and water scarcity will be alleviated with the advancement of rural transformation. The Northeast and Southwest regions are both at a relatively stagnant or uncertain stage, with overall trends close to the national level. The Qinghai-Tibet region is special in that it is in the early stage for the indicator of per capita water resources, and in the late stage for the water utilization rate. When RT2 is used as the measure of rural transformation, the results for most regions are similar to those measured by RT1, except that the Yangtze region is in the early stage under RT2, and the water utilization rate indicator for the Qinghai-Tibet region is at an uncertain stage.
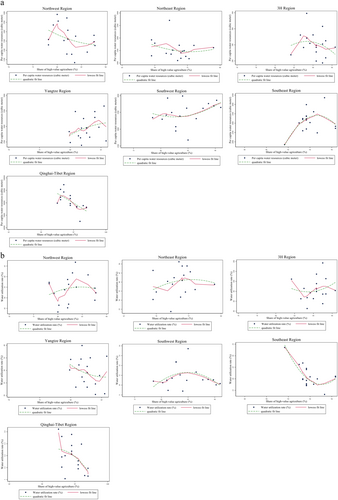
(a) Correlation between RT1 and per capita water resources by region in China. (b) Correlation between RT1 and water utilization rate by region in China.
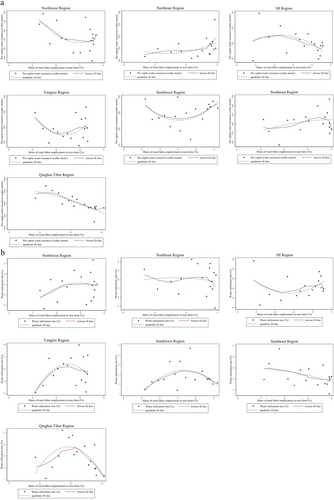
(a) Correlation between RT2 and per capita water resources by region in China. (b) Correlation between RT2 and water utilization rate by region in China.
On the other hand, regardless of whether RT1 or RT2 is used, the 3H and Southeast regions show a trend opposite to the national trend in both water scarcity indicators, namely, per capita water resources first increase and then decrease, while the water utilization rate first decreases and then increases. The reasons for this phenomenon vary from region to region. In the case of Southeast region, the local economy is more developed, and the level of rural economic transformation is high. At the same time, the local water resources are rich, and the constraints on water resources are weak. This makes the relationship between water scarcity and rural transformation in Southeast region different from the national trend. As for the 3H region, this phenomenon indicates that the current rural transformation and corresponding policies have not yet realized the real alleviation of water shortages, but may show a trend of alleviation at a later stage with the development of rural transformation.
4 Policy Responses Dealing With Water Scarcity
4.1 From Traditional to Green Economy
Transitioning from a traditional to a green economy represents a paradigm shift in how economies structure their production, consumption, and overall development strategies to embrace sustainability and environmental stewardship. In the context of China, this transition is particularly significant given its status as the worldʼs second-largest economy and its historical reliance on coal and heavy industries. The Chinese government has recognized the unsustainable nature of its previous growth model and has embarked on an ambitious agenda to transform its economic structure towards a more sustainable, green economy. This transformation, however, is not without its challenges. The transition requires significant changes in policies, regulatory frameworks, and financial systems to support green investment and innovation. Additionally, it necessitates a shift in mindset among businesses and the general population to prioritise long-term sustainability over short-term gains. Despite these challenges, Chinaʼs commitment to a green economy transition reflects a strategic vision that seeks to reconcile economic growth with environmental sustainability, setting a precedent for other nations to follow.
The Figure 9 delineates the trajectory of policy development related to Chinaʼs green economic transformation over a decade, charted through three distinct phases. The first phase (2011–2015), dubbed the ‘Early development stage’, saw the initiation of stringent water management systems and regulations aimed at curtailing pollution from large-scale livestock and poultry farming. Noteworthy during this period was the publication of a national bulletin on soil pollution and the implementation of the Water Ten Plan, both pivotal in laying the groundwork for sustainable agricultural practices. Concurrently, plans were set in motion to halt the growth of fertiliser and pesticide use by 2020, signifying a move towards reducing the ecological footprint of agriculture.
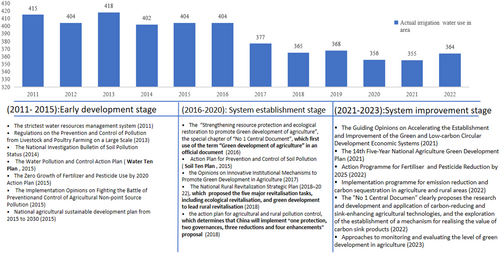
Policy documents related to the green transformation of Chinaʼs economy.
The subsequent ‘System establishment stage’ (2016–2020) built upon these foundations with a focus on reinforcing ecological protection and the green development of agriculture, as underscored by the ‘Green development of agriculture’ clause in the No. 1 Central Document of 2016. Key policy documents such as the Soil Ten Plan and measures for innovative institutional agricultural mechanisms were introduced, reflecting a commitment to ecological revitalisation and the implementation of strategic plans for rural development. This stage concluded with actions aimed at controlling agricultural and rural pollution, emphasising government strategies for resource conservation and enhancement.
Moving into the ‘System improvement stage’ (2021–2023), policies have pivoted towards accelerating the establishment and refinement of green, low-carbon circular economic systems. This is illustrated by the 14th Five-Year National Agriculture Green Development Plan and the commitment to further reduce fertiliser and pesticide usage by 2025. The No. 1 Central Document of 2022 articulated strategies for emission reduction and carbon sequestration in agriculture, signalling a targeted approach to realize the potential of the agricultural sector in contributing to the green economy. The year 2023 is marked by an evaluation of the progress in green development within the agricultural domain, indicating a strategic and phased policy approach to Chinaʼs environmental and economic objectives.
4.2 From Water Supply to Water Demand Management Strategies
The transition from water supply to water demand management strategies is a critical component of Chinaʼs broader shift towards a green economy, reflecting a nuanced understanding of the need for sustainable resource management amidst rapid urbanisation and industrialisation. Traditionally, Chinaʼs approach to water management was heavily centred on augmenting supply through large-scale infrastructure projects, such as dams and reservoirs, to meet the demands of its growing economy and population. However, this supply-oriented model has increasingly been recognized as unsustainable, leading to significant environmental degradation, including river ecosystem disruption, groundwater depletion, and pollution. In response, the Chinese government has begun to pivot towards demand-side management, emphasising water conservation, efficiency, and recycling to address the imbalance between water supply and demand.
This strategic shift is manifest in several policy initiatives and technological innovations aimed at reducing water consumption across all sectors of the economy, particularly in agriculture, industry, and urban development, which are the largest consumers of water. For instance, China has implemented stringent water efficiency standards for industries, introduced advanced irrigation techniques to reduce water use in agriculture, and promoted the adoption of water-saving appliances and fixtures in urban areas. Moreover, the government has launched national pilot programs for water rights trading, encouraging a market-based approach to water resource allocation that incentivises conservation and efficient use. These demand-side strategies are supported by comprehensive legal and regulatory frameworks that aim to strengthen water governance, enhance public awareness of water issues, and foster a culture of water stewardship. The move towards demand-driven water management underscores Chinaʼs commitment to integrating environmental sustainability into its economic development model, acknowledging that water security is fundamental to the nationʼs long-term prosperity and ecological health.
To address and mitigate the issue of water scarcity, the Chinese government has enacted a series of relevant policies from the early 21st century onwards. During the first decade of the 21st century, these policies primarily concentrated on initiating pilot projects aimed at creating a water-saving society and implementing quantified water use quotas for irrigation purposes. In 2002, the revised ‘Water Law of the Peopleʼs Republic of China’ explicitly stipulates that the state shall enforce water conservation and establish a water-saving society. In the same year, the Ministry of Water Resources (MWR) issued the ‘Guidance on Pilot Work for the Construction of a Water-Saving Society’, selecting representative regions to carry out national pilot projects for constructing a water-saving society. Since then, the pilot demonstration work for building a water-saving society has begun to advance, with the scale and scope of the pilots continually expanding. By 2010, the number of national pilots for constructing a water-saving society reached 100, with approximately 300 at the provincial level, forming a development pattern where national and provincial pilots progressed side by side. In terms of agricultural water saving, the ‘National Outline for Agricultural Water Saving Development (2001–2010)’ clearly proposes that, in addition to strengthening engineering management, water quotas for each major crop should be established, and irrigation water use should be determined based on these quotas. In 2003, the MWR required provinces (regions, municipalities) to develop irrigation water quotas.
Entering the second decade of the 21st century, the Chinese governmentʼs primary approach to water resource management has been to implement the most stringent water resources management system. This initiative places significant emphasis on promoting efficient water-saving irrigation technologies, reforming the water rights system, and adjusting the comprehensive pricing policies for agricultural water. In 2011, the Central Document No. 1 introduced the ‘three red lines’ system, characterised by total control over water resources, improving water use efficiency, and limiting pollutant discharge in water functional areas. Following this, water authorities comprehensively implemented these regulations, and successive policies on agricultural water-saving irrigation were issued. Local governments have made water-saving agriculture a core strategy for agricultural development, ranging from hydraulic construction to reforms in agricultural water pricing and water rights, establishing a systematic policy support system. In 2012, the State Councilʼs General Office issued the ‘National Outline for Agricultural Water Conservation (2012–2020)’, the first national guideline on agricultural water conservation, indicating a top-level design in this area and playing a crucial role in ensuring national food security, promoting modern agriculture, and building a water-saving society. In 2018, the ‘Notice on Intensifying Efforts to Promote Comprehensive Reforms in Agricultural Water Pricing’ was issued, which highlighted comprehensive reforms in agricultural water pricing as a pivotal aspect of agricultural water-saving efforts, urging the prompt formulation of agricultural water pricing adjustment plans and careful management of the scale and pace of price adjustments. In September 2019, President Xi Jinping emphasised the principle of ‘planning cities, land, population, and production based on water availability’, treating water resources as the most significant inflexible constraint.
4.3 From Investing in Water Supply Infrastructure to Water Saving Technologies
Under the guidance of transferring traditional to green economy and transferring water supply to water demand management, the promotion of the use of water saving technologies has been highly addressed by Chinese government and it has become one important strategy to coping with water shortages. By promoting water saving technologies, the government hopes to improve the efficiency of irrigation water use by farmers, thereby reducing water consumption and alleviating water shortages.
Figure 10 shows the changes in Chinaʼs irrigated area as well as irrigated areas adopting water saving technologies. It can be seen that the overall trend of Chinaʼs irrigated area has shown a year-on-year increase, rising by about 31% over the 20-year period from 1998 to 2018. And this expansion of irrigated area mainly comes from those areas adopting water-saving technologies. As can be seen from the figure, the growth of water-saving irrigation area is basically consistent with the irrigated area. The percentage of irrigated areas adopting water saving technologies over total irrigated area has also been rising, and by 2018, the percentage had reached 53%. This indicates that China has achieved initial results in the promotion of water-saving technology in recent years, and more and more land has begun to adopt water saving technology for irrigation.
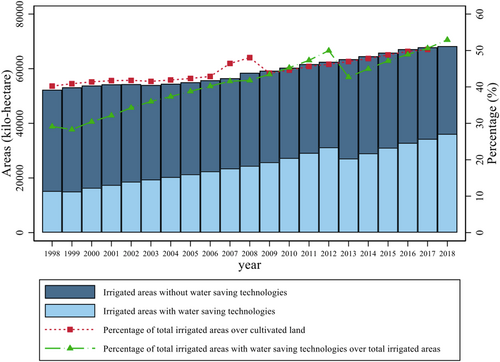
Irrigated areas with and without adopting water saving technologies in China (1998–2018).
Meanwhile, the changes in irrigation water use per mu and irrigation efficiency are shown in Figure 11a,b respectively. It is not difficult to find that the irrigation water use per mu in China is declining every year, down about 25% by 2018. Irrigation efficiency in all regions has also increased to some extent during these 20 years. This shows that with the promotion of water-saving technology, Chinaʼs water use in irrigation has indeed decreased, and irrigation efficiency has also increased. The promotion of water-saving technologies is indeed an important means of alleviating water scarcity.
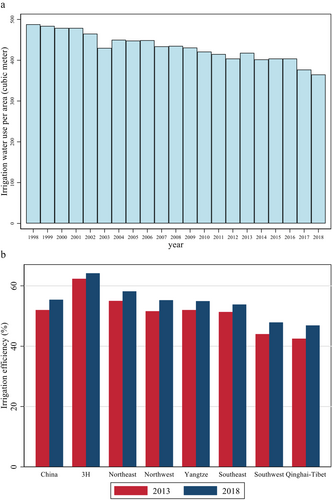
(a) Irrigation water use per area in China (1998–2018). (b) Irrigation efficiency in China and by region in 2013 and 2018.
5 Concluding Remarks
This study has extensively explored the intricate relationship between rural transformation and water scarcity in China, offering significant insights into the challenges and opportunities this dynamic presents. The evolution of Chinaʼs rural economy towards higher-value agricultural production and increased non-farm employment has brought about notable shifts in water usage patterns and heightened the urgency for effective water management strategies.
Our findings corroborate the hypothesis of a complex interplay between economic growth and environmental sustainability, where initial stages of economic transformation exacerbate water scarcity before potentially alleviating it as development progresses and transitions towards more sustainable practices. This dynamic is notably influenced by regional disparities in economic development and agricultural practices, necessitating tailored approaches to water management that consider local contexts and resources. Policy responses over the last 2 decades have progressively shifted from a focus on increasing water supply to enhancing water efficiency and implementing comprehensive demand management strategies. These policies reflect a growing recognition of the need for a sustainable balance between economic growth and environmental preservation, a balance that is crucial not only for China but also for other developing nations grappling with similar issues. However, while substantial progress has been made, the findings also highlight the need for ongoing adjustments and innovations in policy frameworks to address emerging challenges and uncertainties, particularly in light of climate change and its impacts on water availability and agricultural productivity.
Based on the findings of this study, we provide two key suggestions for other countries facing similar challenges. The first is adopting an integrated policy approach. Developing countries should adopt an integrated policy approach that considers the interconnection between rural transformation, sustainability, and water resource management. Policies should aim to promote rural development while ensuring sustainable use of water resources. This integrated approach could involve coordination between agriculture, industry, and environmental sectors, as well as the implementation of policies that balance economic growth with environmental conservation. The second is adopting an adaptive water management strategies. Governments should focus on developing adaptive water management strategies that address the challenges posed by water scarcity in rural areas. This could involve investing in water infrastructure, implementing efficient irrigation systems, promoting water-saving agricultural practices, and strengthening water resource management institutions. This includes adopting advanced irrigation technologies like drip and sprinkler systems to deliver water directly to crops, reducing waste (Sinha et al. 2021). It also involves incorporating remote sensing and data analytics to optimize irrigation timing, establishing robust monitoring systems, upgrading water storage infrastructure, enhancing capacity for enforcing regulations, developing inclusive governance frameworks, improving water pricing mechanisms and establishing water rights system (Bwambale, Abagale, and Anornu 2022; Gorguner and Kavvas 2020; Karthikeyan, Chawla, and Mishra 2020; J. Wang et al. 2016 2020). By adapting to changing water availability and demand patterns, countries can ensure a more sustainable use of water resources during the process of rural transformation. By implementing these policy suggestions, countries can better navigate the complexities of rural transformation, sustainability, and water scarcity, ultimately working towards achieving inclusive and sustainable development goals.
For future research, it would be beneficial to conduct more localized studies that can provide deeper insights into the effectiveness of specific water management strategies in different regions. Additionally, exploring the role of technological advancements and their integration into rural and agricultural development can offer further opportunities to enhance water efficiency and sustainability. In conclusion, the journey towards a sustainable equilibrium between rural transformation and water resource management in China is ongoing. The lessons learned and the strategies implemented serve as valuable references for other regions facing similar challenges, emphasizing the importance of adaptability, continuous learning, and proactive policy-making in the pursuit of sustainable development goals.
Acknowledgements
This work was supported by Australian Center for International Agricultural Research (ADP/2017/024), Ministry of Science and Technology of China (2021YFC3200500), and National Natural Science Foundation of China (41861124006, 71874007).
Open Research
Data Availability Statement
The data that support the findings of this study are available from the corresponding author upon reasonable request.


