Technoeconomic Perspective on the Electroreduction of CO2 to Formic Acid: Scale-Up Strategies Toward Industrial Viability
Graphical Abstract
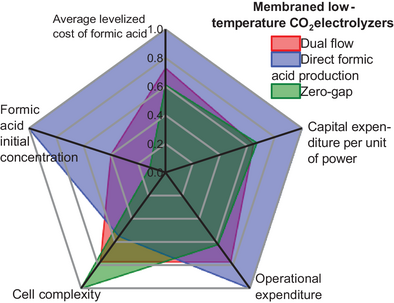
The current technoeconomic analysis of CO2 electroreduction to produce “green” formic acid highlights economic optimization through the implementation of multiple-cell stacking, positioning it as a competitive alternative to established industrial methods. Among the studied electrolyzer reactors, the direct formic acid production electrolyzer demonstrates enhanced viability due to the reduced costs associated with downstream processing.
Abstract
The conventional industrial synthesis of formic acid is an energy-intensive process that contributes to the CO2 footprint. As an alternative method, the electrochemical reduction of carbon dioxide (eCO2RR) to formic acid has emerged as a viable means to reduce atmospheric CO2 concentrations and advance the energy transition to a circular, carbon-neutral economy. Despite considerable progress in this field, the scale-up of electrolyzers from laboratory prototypes to commercial-scale production remains an important challenge. Thus, this technoeconomic analysis provides a detailed evaluation of the economic viability of upscaling the electrolyzer size to an industrial level, determining whether the eCO2RR process can economically compete with the conventional industrial production of formic acid. The proposed technoeconomic assessment employs a bottom-up approach based on realistic cost models using the three most successful designs: dual flow (DF), direct formic acid production (DFAP), and zero-gap (ZG) electrolyzers. The results from this study underscore the necessity of implementing multiple-cell stacking to economically compete with established industrial processes. Among the three studied designs, DFAP and, to a certain extent, DF are promising. Although the scalability of the DFAP electrolyzer may initially appear inadequate, it holds potential for commercial application, particularly if technical improvements in the center compartment and solid-state electrolyte are materialized.
1 Introduction
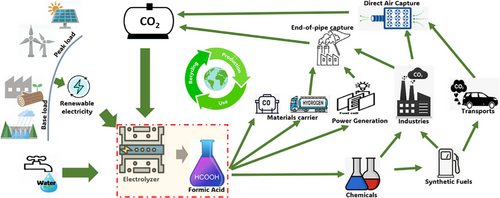
Climate change, driven by the anthropogenic production of carbon dioxide (CO2), is one of the major challenges of our time. The electrochemical CO2 reduction reaction (eCO2RR) to value-added products is increasingly considered as an alternative synthetic process promoting the transition to a circular carbon economy.[1-3] Technological advances in small cells over the last decade aim toward eventual scalability to achieve economic viability for industrial-scale application. In this regard, the synthesis of formic acid via eCO2RR shows promise to economically rival the current energy-demanding industrial processes.[4] Commonly produced from methanol,[5] the formic acid market was estimated at 1092.35 kilotons in 2022, with a unit cost of ∼€0.5 kg−1. This market shows a bright commercial future considering its potential in the energy transition. With its versatile range of applications, formic acid can integrate different sectors into a sustainable carbon cycle. During periods of high availability, renewable energy sources can power the eCO2RR to formic acid. As “green” formic acid, it can be easily stored and transported, facilitating its subsequent conversion back into energy and materials in a diversified manner (e.g., fuel cell power generation, industrial and transport fuel) or even achieve further processing (e.g., formamide derivatives).[6] Carbon capture technologies[7] close the cycle by capturing CO2 emissions (Figure 1).
The transition of the electrochemical production of formic acid from a laboratory scale to an industrial scale requires a huge global effort, whereby experimental work should complement theoretical calculations. Regarding the latter, technoeconomic analyses (TEAs) on the profitability of the eCO2RR to formic acid are fundamental to leverage the process toward a realistic industrial application. In the literature, various TEAs have focused on the production of multiple eCO2RR products. These include general analyses encompassing the production of carbon monoxide, formic acid/formate, ethylene, ethanol, n-propanol, and methanol,[8] as well as a similar approach focusing especially on the four aforementioned products.[9] Furthermore, TEAs targeting the production of ethylene,[10, 11] the electrochemical reduction of CO2 coupled with methanol to produce methyl formate,[12] and the evaluation of diverse CO2 electrochemical conversion strategies, highlighting their advantages and limitations,[13] have also been reported.
Upon examining the sole production of formic acid/formate, two distinct studies have emerged: The first, adopting a top-down approach, incorporates an environmental assessment and market potential analysis,[14] whereas the second is an analysis based on six case studies.[15] These studies—which consider the production of formic acid from eCO2RR in a global approach and are essentially based on generic cost and electrochemical models—have failed to distinguish the specific features of the conversion routes and the internal structure of each reactor involved. Moreover, the analyses have not taken into account the economies of scale to which electrochemical processes are highly sensitive.[16, 17] Analyses specific to formic acid did not apply a bottom-up approach, which is necessary for accurately assessing the impact of the electrochemical parameters and reactor design on the overall process performance. What is more, by considering the internal structure of the reactor, these analyses did not differentiate between formic acid and the easier-to-synthesize formate. Thus, the existing TEA literature still lacks comprehensive insights into the exclusive production of formic acid, which could provide valuable information for achieving scalability in the field.
To address this gap, the current study presents a comprehensive comparative analysis of the eCO2RR to formic acid as a singular product using the three most common low-temperature electrolyzer designs: dual flow (DF), direct formic acid production (DFAP), and zero-gap (ZG) (Figure 2). This study adopts a bottom-up approach, utilizing a realistic cost model and a careful selection of referenced experimental schemes. The methodology employed here is articulated around four main points, as illustrated in Figure S1, simultaneously defining the scope of this study. This process encompasses grey box modeling of the manufacturing unit (including CO2 supply, the electrolyzer, the CO2 recycling loop, and products separation/purification), system operation, and costs, followed by the steady-state simulation of the conversion process and derivation of key performance indicators (KPIs).

Among the 200 references documenting experimental studies on the production of either formate or formic acid using the three investigated reactor models, exactly 32 references focus on formic acid as a unique product. In this current study, only these references were considered for examining the operating parameters and the reactor architecture.
A typical DF electrolyzer (Figure 2a) comprises two distinct electrolyte flow channels designated independently for catholyte and anolyte. The CO2 gas channel and the catholyte channel are separated by a gas diffusion electrode (GDE), whereas a cationic exchange membrane (CEM), which allows ion exchange and mitigates product crossover, divides the catholyte and the anolyte chambers. The catholyte needs to be either neutral or acidic to facilitate the production of formic acid. This technology is mostly chosen in experimental laboratories for low-temperature CO2 electrolysis, with reported prototypes featuring electrode-active areas of 600 and even 1000 cm2.[18, 19] The DFAP electrolyzer (Figure 2b), however, has received less attention compared to the other two designs, with cell sizes not exceeding 25 cm2. Typically, it consists of three compartments, with a characteristic feature being the porous ion exchange resin—referred to as the solid-state electrolyte—used to enhance proton conduction and to provide structural stability (e.g., Amberlite IR-120H).[20] This resin is embedded in the center compartment and separated from the cathode and anode by an anion exchange membrane (AEM) and a cation exchange membrane (CEM), respectively.[21] With this configuration, CO2 is supplied in the cathode, whereas deionized water is circulated in the anode and center compartment. In the latter, the generated formic acid is flushed out as a pure product. This cell architecture offers the advantage of being liquid electrolyte-free given the static solid-state electrolyte. By contrast, the ZG electrolyzer (Figure 2c) features a two-compartment design, consisting of an anode and a cathode, divided by a membrane-electrode assembly (MEA). The MEA typically entails an ion exchange membrane (normally a CEM) that is sandwiched between the two catalyst layers of the GDEs. An innovative variation of this cell structure involves the perforation of the CEM in a bipolar membrane to facilitate the transport of formic acid to the anode when operating with a forward bias orientation.[22] As the central component of this electrolyzer design, the composition of the MEA plays a crucial role in the performance, durability, and cost of the reactor.[23] Although this technology is employed less frequently than DF, prototypes as large as 800 cm2 of active area have been reported.[24] The ion exchange membrane, as a key constituent in the three designs, has shown remarkable performance stability under diverse conditions and over extended periods of time. For instance, AEMs have exhibited stabilities ranging from 1000 to 3000 h within a wide pH range.[25, 26]
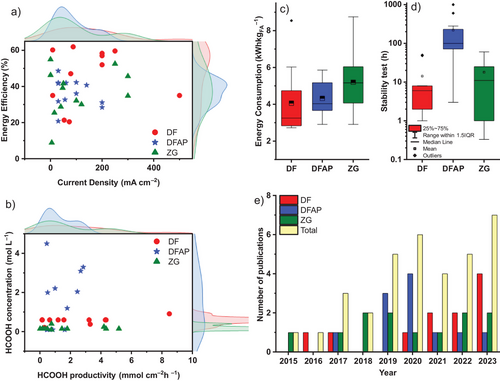
Figure 3a,b depicts the performance of the eCO2RR to formic acid, as indicated by the energy efficiency (Figure 3a) and formic acid concentration (Figure 3b) versus current density and production rate in the 35 herein reviewed case studies using the three reactors of Figure 2. The distribution of cell-active areas and the experimental lifetimes of the electrolyzers depend on their specific designs, as shown in Figure S3c,d. More indicators, including the faradaic efficiency and cell voltage variations, are provided in Figure S3. Based on these results, it is evident that within the same reactor category, the electrochemical parameters can vary drastically from one experimental scheme to another, with current densities ranging from ten to several hundreds of mA cm−2, faradaic efficiencies between 10% and 100% (Figure S3a), and energy consumption in the range of 2.7 and 8.7 kWh kgFA−1 (Figure 3c). Moreover, upon transitioning from one reactor design to another, there is no consistent trend observed in the electrochemical performance indicators (Figure 3a,b), perhaps because the experiments were optimized to different indicators. These two observations underscore the challenge of effectively comparing the electrochemical performance of these electrolyzers. Not only can the reactor design influence the electrochemical parameters and thus, the overall process performance, but the design can also affect the material requirements which, in turn, drive development costs. This further complicates the assessment of competitiveness among electrolyzers.
2 Results and Discussion
2.1 Technoeconomic Analysis
2.1.1 Cost Models
The capital expenditure (CapEx) considered in this study includes the cost of installing the electrolyzer (e.g., catalyst, membrane, GDEs, plates, assembly, etc.) and the associated balance of plant (e.g., flow control, CO2 supply systems, controls and instrumentation, electrical, frames, etc.), as well as product separation. The latter includes an amine-based recycling unit for unreacted CO2 and a formic acid purification unit that employs a hybrid extraction–distillation process. The analytical cost model for the electrolyzers utilizes the empirical data provided in two reports[27, 28] by the Battelle Memorial Institute for the U.S. Department of Energy for three different PEM fuel cell systems. The present model is developed within the context of eCO2RR; however, its applicability is evident as the discussed CO2 electrolyzer setups integrate identical components, differing only in the arrangement in DF design and the solid-state electrolyte sandwiched between two membranes in the DFAP design, as shown in Figure 2. The inventory of the components is detailed in Table S4. According to these reports, both the cost of the stack and the BOP vary significantly not only with the number of stacks manufactured but also with the size of the electrode active area. In this study, the cost of the electrolyzer was modeled mathematically as a two-variable polynomial function comparing the active area-specific electrolyzer cost ($ m−2) versus the cell's electrode active area (Figure S5). The validity of the model could be confirmed by the observed precision of the fit functions, as assessed through the coefficient of determination (r2 parameter), which consistently exceeded 0.999. The Supporting Information provides a detailed explanation of the developed cost model, derived from empirical data. This study examines two models for the three studied electrolyzers, one with a cell active area of 0.6 m2 and the other with 1.0 m2 and considers the mean value of the reviewed electrochemical experimental results (Figure 4). For the separation unit, the basic CapEx of CO2 recycling and extraction/purification of formic acid are derived for each case study based on the calculated product flows, from existing models,[8, 29] using the six-tenth power method[30] detailed in Supporting Information with Equations S14 and S16. The total basic CapEx thus obtained was then updated to the year 2023, considering the chemical engineering plant cost indices (CEPCIs) concerning the year of production of each of the databases used.

Operating expenses (OpEx) refer to all costs incurred annually for the purchase of electrical energy, CO2 supply, reactor maintenance (replacement of sensitive components), and other process consumables such as deionized water and electrolytes, all considered as a fixed proportion of the initial investment for the electrolyzer unit. Operation of the separation unit (CO2 recycling and formic acid purification) is considered as well, and related expenses are derived from the same models used to estimate CapEx. However, as OpEx is closely tied to energy costs and operating time, and the cost of distillation depends on the initial concentration of product in the mixture, these costs are included in the calculation (Equations S16 and S17). Further details on the principle for deriving the separation unit's operating expenses are provided in the Supporting Information.
The breakdown of CapEx values (Figure 4b) reveals a significant contribution from product purification when DF and ZG technologies are used, resulting from the extreme dilution of the formic acid stream at the outlet of these reactors. A similar trend is observed in OpEx (Figure 4a), particularly for ZG reactors, where costs are largely driven by the downstream processing of formic acid. Although DFAP reactors tend to be relatively more energy-intensive with electricity scoring up to 49% in the OpEx (Figure 4a), they outperform the other designs, in both the CapEx and OpEx, due to the higher concentrations of formic acid solution they can produce, as discussed in the following sections.
2.1.2 Levelized Cost of Formic Acid
In Equation 1, CapEx0 denotes the capital expenditure or initial investment, OpExtot is the total operational expenditure, mFA is the mass of produced formic acid, and i is the discount rate. To provide a clearer image of the economic performance of each scheme relative to its electrochemical process, the capital expenditure specific to the electrical power input of the electrolysis unit, identified as CapEx-power (US$ kW−1), and the operational expenditure specific to formic acid production (US$ kg−1) are computed as well. Therefore, a grass-roots cost estimation of the eCO2RR to formic acid process is considered to operate under the governing baseline assumptions showcased in Table 1. The baseline calculations consider an electrolyzer design with a total reactor area of 3600 m2 with 200 cells per stack and either 30 (with a cell of 0.6 m2 of catalyst active area) or 18 stacks (with a cell with 1.0 m2 of active area).
| Item | Units | Value | Reference |
|---|---|---|---|
| Number of cells per stack | ∼ | 200 | Assumed |
| Cell's electrode active area | m2 | 0.6 | Assumed |
| Plant total active area | m2 | 3600 | Assumed |
| Plant capacity utilization factor (CUF) | % | 68 | Assumed |
| Single pass CO2 conversion efficiency | % | 60 | Assumed |
| Product losses during separation | % | 3 | Assumed |
| Process consumables as a percent of electrolyzer CapEx | % | 5 | Assumed |
| Average renewable energy cost | ¢ kWh−1 | 4.5 | Average large renewable energy price |
| CO2 cost | $ tonne−1 | 40 | Assumed from Ref. [8] |
| Deionized water cost | $ tonne−1 | 55 | Assumed from Ref. [31] |
| Reactor maintenance rounds frequency | Per year | 2 | Considering an average lifetime of 3000 h for membranes[25, 26] |
| Operating time per year | Hours | 6000 | Assuming 68% CUF |
| Discount rate | % | 5 | Assumed |
| Salvage value of the investment | % | 7.5 | Assumed |
| Project lifetime | Years | 20 | Assumed for electrochemical systems |
| CEPCI (2015) | – | 557 | Available from www.chemengonline.com |
| CEPCI (2023) | – | 798 |
The production costs of formic acid through the modeled process were initially calculated (Equation 1) for each experimental process of the reviewed articles, considering the three reactor technologies. These calculations are depicted in Figure 5, illustrating the empirical relationships between LCFA and the other metrics, including energy consumption (Figure 5a) and CapEx-power (i.e., the capital invested per unit of installed power input) (Figure 5b). Moreover, for each reactor technology (DF, DFAP, and ZG) considering two different cell sizes (0.6 m2 and 1.0 m2), a statistic of the LCFA calculation values, based on the reviewed experimental data, is also represented (Figure 5c). Baseline calculations, as depicted in Figure 5c, indicate that the DFAP electrolyzer emerges as the top performer, achieving LCFA values as low as US$0.42 kgFA−1 and an average of ∼ US$0.7 kgFA−1 regardless of the cell size. By contrast, the ZG electrolyzer is the least efficient, despite being the least energy intensive, as shown in Figure 4a. The areas highlighted by cyan blue color (Figure 5a,b) represent the best-performing data with LCFA < $0.6 kgFA−1 for energy consumption values of <5.0 kWh kgFA−1 (Figure 5a), and CapEx-power values of <k$5.0 kW−1 (Figure 5b). These experimental data correspond to those from the literature identified as Chi et al.,[32] Xing et al.,[33] and Oßkopp et al.[34] for DF, and Yang et al.,[20, 35] Lin et al.,[36] and Zheng et al.[37] for DFAP. This performance level could not be achieved using the ZG reactor, as all the case studies using this technology failed to achieve a LCFA below $0.6 kgFA−1. Besides, this result shows that the significant difference in the electrolyzer capital cost related to the cell size (shown in Figure S5) is minimized when calculating the average LCFA as the electrolyzer CapEx only contributes around 20% to the average LCFA of the finished product, as displayed in Figure 6. Here, the average LCFA is broken down into percentage contributions from main cost items, including the capital for the electrolysis unit (electrolyzer stacks and BoP), both capital and operational expenses for CO2 recycling, product purification, electricity supply, reactor maintenance, and consumables such as process water and electrolytes (Figure 6). This analysis indicates a general trend in the electrolyzer designs as the contribution of each cost item was calculated as the average across the reviewed experiments, based on the assumptions outlined in Table 1.

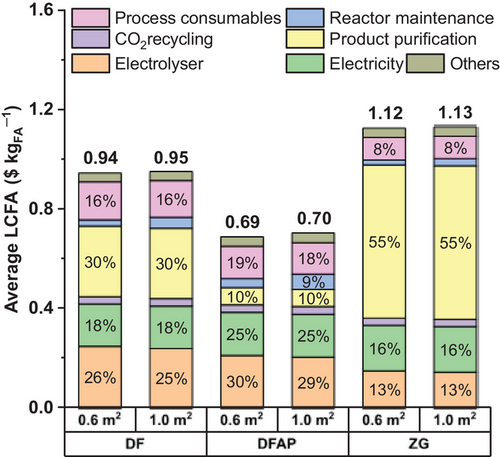
Electrical energy consumption represents a significant cost driver in the eCO2RR to formic acid across all reactors, whereas the impact of the formic acid separation stage is heavily dominating the unit cost of product in the case of DF and ZG reactors, reaching 55% in the latter (Figure 6). This contribution, which does not exceed 10% for the DFAP reactor, makes this technology the most efficient overall, despite its relatively higher energy consumption and significantly higher installation cost for the electrolysis unit (Figure 6). However, the DFAP electrolyzer, inventoried in Table S4, presents a significant challenge due to its internal structure, featuring a solid electrolyte sandwiched between two exchange membranes. This internal structure adversely affects the CapEx of DFAP technology as well as the maintenance costs included in the OpEx. Nevertheless, the high installation and operating costs are rapidly offset by the lower costs of the downstream treatment, as the DFAP reactor employs only CO2 and water as educts—no need for electrolyte salts—and yields higher concentration of formic acid at its outlet. This is because the formic acid purification relies on a hybrid extraction–distillation process in this model, where the related OpEx is inversely proportional to the formic acid concentration (Equation S17).[29]
2.1.3 Sensitivity Analysis
Sensitivity analyses were conducted to ascertain the dependency of the LCFA on the upscaling processes. This initially addressed the cell's electrode active area, and the size of the reactor fixed to 3600 and 9600 m2, translated in terms of the electrolyzer's total active area (the other parameters maintaining their assumed baseline values tabulated in Table 1). The results of these calculations are illustrated in Figure 7. As a general trend, the curves of average LCFA values versus the cell's electrode active area initially decrease markedly before leveling off at ∼0.5 m2 for the two investigated reactor sizes (3600 m2 and 9600 m2).
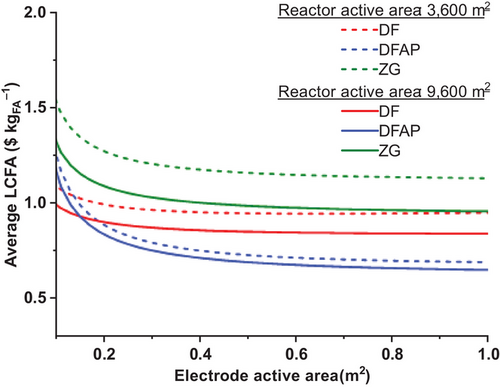
Although the shape of the curves is similar for 3600 and 9600 m2 reactors, the average LCFA is highly sensitive to the economies of scale with DF and ZG technologies. However, the LCFA values in the DFAP design are less influenced by the total reactor active area. Calculations in the sensitivity analysis and multicriteria comparison utilize baseline assumptions of Table 1, i.e., 0.6 m2 of cell active area and a total reactor area of 3600 m2.
Although the previous analysis provides valuable insights into the upscaling required to lower the production costs of formic acid, other parameters related to electrochemistry (faradaic efficiency, cell voltage, current density), operating conditions (initial formic acid concentration, reactor maintenance, and the plant's capacity utilization factor), and the economic environment (discount rate, capital expenditure, and the electricity price) are important to provide a deeper analysis on the average LCFA (Figure 8). This sensitivity analysis was also computed based on the sample of referenced case studies and assumptions outlined in Table 1, for DF, DFAP, and ZG electrolyzers. This more exhaustive analysis, where the values of the parameters have a margin of variation of +/−25%, shows a substantial dependence of the average LCFA variations on the type of electrolyzer. A significant influence from electrochemical parameters is observed in the three reactor designs, mainly the faradaic efficiency and current density. For example, with the DFAP design, a 25% increase in either the faradaic efficiency or the current density would reduce the average LCFA to $0.6 kgFA−1. However, the voltage has a moderate effect. This is because energy costs from voltage are often outweighed by other operational costs, such as product separation, process consumables, and reactor maintenance. Other parameters with a significant influence on the LCFA are energy price and plant capacity factor, for which values of 4.5 ¢ kWh−1 and 68% (equivalent to 6000 h of operation at full capacity) were, respectively, assumed in the baseline calculations. These two parameters are susceptible to suffering a deviation introduced by the reactor start/stop operation and maintenance and price variations between different energy sources. Figure 9 displays the combined effect of the electricity price and the plant capacity factor in the LCFA. The DFAP technology would be the least affected by rising energy prices and/or operational problems affecting the plant capacity factor. Hence, the ZG reactor, and to a lesser extent the DF reactor design, are the most benefited from renewable sources such as solar PV and wind, in terms of availability and price.


The parameter of formic acid concentration at the reactor outlet appears to be one of the key parameters in the LCFA and is practically the factor differentiating the economic performance of the reactors studied. Its impact is particularly noticeable in the case of DF and ZG reactors, where the low concentration of formic acid in the outlet stream requires oversized separation units with a detrimental effect on the LCFA. Based on data from Chi et al.[32] Yang et al.,[20] and Hu et al[22] (considered the best LCFA-performing experiments using DF, DFAP, and ZG reactors, respectively), the contour plots shown in Figure S6b support that the DFAP reactor's enhanced LCFA is due to the higher formic acid concentration it can produce. A slight increase in this parameter value for the other two reactors (DF and ZG; Figure S6a,c) would result in higher competitiveness, potentially surpassing that of the DFAP reactor. Further analyses were conducted to examine the combined effect of varying the cell's electrode active area and three other important parameters influencing the value of LCFA (energy price, cell voltage, and current density; see Figure S7) based on the same data used in Figure S6. A calculation showing the joint influence of the plant capacity factor and the project lifetime (in years) was analyzed and plotted in Figure S8.
2.2 Multicriteria Comparison
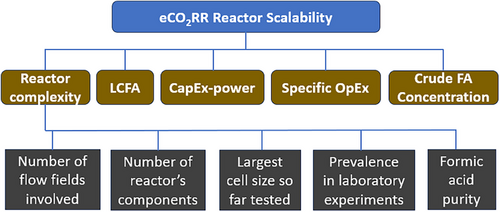
In this analysis, five criteria were retained for the comparison of the three investigated reactors: reactor complexity, levelized cost of produced formic acid, capital expenditure specific to installed power, specific operational expenditure, and concentration of produced formic acid (Figure 10). The first is a technical criterion that accounts for the easiness of setting up the reactor based on a) the number of flow fields involved, b) the number of individual components, as represented in Figure 2c) the readiness level of the technology, which is assessed by the size of its largest prototype tested to date and the prevalence of the technology at laboratory scale as reported in Ref. [38], and d) the purity of the produced formic acid at the reactor outlet.
The five criteria are compared in Figure 11, using scores averaged from the experimental results of the reviewed articles. In Figure 11a, the performance of each color-coded reactor is graphically represented by criterion. Subsequently, all the criteria are aggregated into a single metric, termed the “scalability index”, which is calculated through the weighted linear combination technique after normalizing the scores on the continuous 0–1 scale (Figure 11b). According to this metric, the DFAP reactor achieves the best performance, 0.91, consistent with previous calculations based solely on LCFA. Far behind are the DF and the ZG reactors, achieving scalability index values of 0.64 and 0.59, respectively (Figure 11b). Despite its relatively structural simplicity, the ZG reactor emerges as the least effective electrolyzer due to its comparatively higher LCFA, representing a significant limitation. The competitiveness of this electrolyzer is also compromised by the Specific-OpEx and CapEx-power because these are affected by the cost of the product purification stage. CapEx-power is primarily influenced by the cost of the product purification in DF and ZG reactors, whereas the Specific-OpEx is driven by energy costs in DF and DFAP reactors. The complexity criterion penalizes the DFAP electrolyzer due to its internal structure. The opposite occurs for the ZG electrolyzer, which profits from its simplicity and prevalence in laboratory experiments, achieving a score of up to 34% on the complexity criterion (Figure 11b). More details regarding the scoring of the criteria and subcriteria and computation of the index are given in Tables S10 and S11.

- Scenario 1: priority is given to the LCFA, the technoeconomic performance indicator.
- Scenario 2: priority is given to the ease of reactor implementation, reflected in cell complexity.
- Scenario 3: priority is given to the crude formic acid concentration at the electrolyzer outlet.
In all four scenarios, the ranking of electrolysis reactor technologies remains unaffected by variations in the weights assigned to the criteria (cf. Figure 12). DF and ZG reactors consistently show lower efficiencies than the DFAP reactor, given the shared low performance in terms of concentration of the produced formic acid. In Scenario 2, where the reactor complexity criterion is prioritized, the uncertainty linked to implementing the solid-state electrolyte in reactors with higher electrode active area[20] (as shown in Figure S3c, the DFAP design has only been tested on cells with an area up to 25 cm2) should be detrimental to the DFAP reactor. However, its score remains significantly higher than that of DF and ZG reactors in the other scenarios. This can be explained by the fact that this technology benefits from its ability to produce pure formic acid solution at higher concentrations (process optimization within DFAP reactors achieves concentrations of up to 5 mol L−1,[39] compared to 0.4 mol L−1 obtained with the ZG design[40]). In summary, the uncertainty associated with the scalability of the DFAP design is insufficient to make it less competitive than the other two technologies. Despite being more extensively studied, DF and ZG reactors are significantly hindered by the high costs associated with the formic acid purification stage.

3 Final Remarks
This study examined experimental setups, which focused on formic acid as the primary product of the eCO2RR. In Figure 3a, it is evident that current densities are quite modest. Only a maximum of 500 mA cm−2 was reported with the DF reactor,[32] in contrast to the thousands of mA cm−2 often reported for formate production.[41-43] Considering the significant impact of current density on product cost, as illustrated in Figure 8, working at low current densities is economically unprofitable in the three reactors. Even though the formic acid production rates increase linearly with the current density (Figure S3b), the limited current densities yield low formic acid concentrations, averaging 0.6, 2.1, and 0.15 mol L−1 for DF, DFAP, and ZG reactors, respectively (Tables S1, S2, and S3). Given the downstream processing required to obtain higher concentrations, this hampers profitability in the process as the separation/purification stage can represent up to 55% of the average levelized cost of electrolytic formic acid (Figure 6, ZG reactor). Current industrial processes produce formic acid in concentrations above 85 wt% or 22 mol L−1.[15] Synthetic production is based mainly on two main routes: hydrolysis of methyl formate and direct synthesis from formates.[5] In nonindustrial processes, azeotropic distillation is reported to concentrate diluted formic acid from 30 to 85 wt%.[8, 15] Pervaporation, proposed as a lower-cost alternative to azeotropic distillation, is still in the research phase.[44] Thus, in the present study, the process involving azeotropic distillation preceded by a liquid–liquid extraction step described in Ref. [29] as hybrid separation–distillation is adopted by similarity, along with the associated cost model that is updated as described by Equations S16 and S17. The DFAP technology stands out as the most viable option for which downstream processing of the product can be effectively envisioned due to its ability to generate pure formic acid at a concentration higher than 20 wt% or 5.2 mol L−1, albeit at the expense of the reaction's faradaic efficiency,[39, 45] which significantly increases the LCFA (Figure 8b). Based on data reported in Refs. [20, 35, 36, 39, 46] using DFAP reactor designs and baseline parameters values (as provided in Table 1), in the customized computational model used in this study, the average LCFA lies around $0.7 kgFA−1, whereas the lowest values are close to $0.42 kgFA−1 (Figure 5c), exactly comparable to the market price of commercial formic acid. This demonstrates a new industrial perspective of the DFAP reactor. However, s this reactor has only been tested experimentally on small cells (25 cm2) so far, considerable uncertainty persists regarding its suitability for larger cells, such as the 0.6 m2 one considered in this study. This uncertainty arises from the complexity of the center compartment, which involves porous ion-exchange resin.
In terms of complexity, the ZG is certainly the most interesting electrolyzer, despite being severely penalized by low product concentration and purity. Recent advances have led to the development of a bipolar membrane with a perforated CEM yielding 0.25 mol L−1 of formic acid at 300 mA cm−2 with 45% energy efficiency. Currently being the best-performing result with ZG electrolyzers, this bodes well for further advancements in the field.[22] Future technological developments should strive not only to better understand the behavior of intracellular arrangements on larger scales but also to improve product concentration. Such enhancements are essential for increasing the cost-effectiveness of the process in practical applications.
By comparing the three technologies and considering only the average LCFA throughout the eCO2RR to formic acid, the DFAP electrolyzer demonstrates a significant advantage over the other two, with a value of $0.69 kgFA−1 compared to $0.94 kgFA−1 for DF and $1.12 kgFA−1 for ZG, according to the baseline assumptions (Figure 8).
From an operational perspective, the dependence of this technology on the electrolyte leads to uncertainty regarding the downstream processing. Two of the best results using DF reactors[33, 34] utilize KHCO3 and K2SO4 as catholytes. These substances must subsequently be separated from concentrated formic acid through a purification/distillation process. This implies that, although DF reactors have been extensively investigated on a laboratory scale, including cell sizes of up to 600 cm2,[18] objectively comparing them to the DFAP design, which produces a pure solution of formic acid, presents challenges.
4 Conclusions
This study conducts a technoeconomic comparison of the three predominant electrolyzers employed in the low-temperature electrochemical reduction of CO2 to formic acid. It provides a detailed evaluation of the economic viability of upscaling the reactors to an industrial scale to determine whether the eCO2RR process can economically compete with conventional, fossil fuel-driven pathways of formic acid synthesis. The eCO2RR process model used in this study was designed to be as complete as possible using a bottom-up analysis, integrating the CO2 supply, the electrolysis unit, the recycling of unconverted CO2, and the formic acid separation/purification stage.
When downstream processes were overlooked, the DF, and to a lesser extent, the ZG reactor emerged as the optimal choice. The performance of the DF reactor in this case was attributed to its favorable capital expenditure, and most notably, to its capability to achieve high current densities of up to 500 mA cm−2, resulting in a substantial production yield. By contrast, the direct formic acid production (DFAP) electrolyzer is penalized by its complex internal structure, which includes a solid-state electrolyte, as well as by its high energy consumption. However, when downstream processes, especially the hybrid extraction-distillation process, were considered, our technoeconomic analysis suggests that the DFAP reactor has the potential to support industrial production due to its ability to produce a more concentrated formic acid solution, despite its complexity. Nevertheless, the uncertainty regarding the integration of the porous ion-exchange resin in reactors with an active area larger than 25 cm2 remains a significant obstacle to its commercial deployment.
5 Study Limitations and Outlook
The current analysis model is significantly limited by the lack of experimental data on the long-term stability of sensitive components in the reactor. This limitation stems from the fact that most reviewed case studies only demonstrated stability for a few hundred hours. In this study, it was assumed that three rounds of the reactor's core components replacement would take place every 2000 h of operation, equating to a plant capacity factor of 68%, assuming operation at full capacity. Both the membrane and the catalyst must withstand this duration for the results of this study to remain valid. Moreover, the direct extrapolation of results obtained in laboratory settings using miniaturized reactor prototypes (with less than 25 cm2 of active area) to sizes of 0.6 m2 introduces uncertainty that needs to be addressed. Hence, future experimental process studies targeting the long-term stability of functional components, such as membranes and GDEs, in reactors with higher active surface area would help to provide more realistic technoeconomic analyses.
Supporting Information
The authors have cited additional references within the Supporting Information.[37, 47-63]
Acknowledgements
The authors acknowledge the financial support from the German Federal Ministry of Education and Research (BMBF) within the project “iNEW2.0—Inkubator Nachhaltige Elektrochemische Wertschöpfungsketten” Project No. 03SF0627A.
Open access funding enabled and organized by Projekt DEAL.
Conflict of Interests
The authors declare no conflict of interest.
Biographies

Dr. Urbain Nzotcha received his MSc and PhD degrees in renewable energy systems from the National Advanced School of Engineering of the University of Yaoundé I (Cameroon) in 2016 and 2020, respectively. Since 2022, he is working as a postdoctoral researcher at Forschungszentrum Jülich GmbH, Institute of Energy Technologies – Fundamental Electrochemistry (IET-1). His work focuses on technology assessment of power-to-X value chains in the context of CO2 electrocatalytic conversion into base chemicals and synthetic fuels.

Dr. Sergio Sanz completed both his chemistry degree (2002) and PhD (2007) at the University of Zaragoza (Spain), with research stays at the Department of Technological and Environmental Chemistry, Eötvös University (Budapest, Hungary, 2004) and the Laboratoire de Chimie de Coordination (Toulouse, France, 2005). He held postdoctoral positions at the University Jaume I (Castellón, Spain, 2009–2010) and the University of Edinburgh (2010–2018) before moving to Peter Grünberg Institute (PGI-6) at Forschungszentrum Jülich (FZJ, Germany). In 2023, he joined the FZJ's Institute of Energy Technologies – Fundamental Electrochemistry (IET-1), where he investigates the electroreduction of CO2 to value-added chemicals.

Dr. Hermann Tempel studied chemistry at Darmstadt Technical University with a focus on inorganic and technical chemistry. He received his PhD in inorganic chemistry on the topic of the synthesis of 1D nanomaterials and their application in electrochemical energy storage and photochemical energy conversion. Afterward, he was a postdoctoral researcher and team leader at Forschungszentrum Jülich. Since 2022, he is acting department head for electrochemical synthesis and electrocatalysis. His research interest is on gas separation, carbon dioxide conversion, ammonia generation as well as alkaline water electrolysis.

Prof. Rüdiger-A. Eichel earned his diploma in solid-state physics at the University of Cologne, Germany, and obtained his PhD degree in physical chemistry at the Swiss National Institute of Technology (ETH) in Zürich, Switzerland. Prof. Eichel was qualified as a university lecturer (venia legendi) in physical chemistry at Darmstadt Technical University. Prof. Eichel holds a chair for Energy Conversion and Storage at RWTH Aachen University, Germany, as full professor. In a joint appointment, he acts as scientific director of the Institute of Energy Technologies (IET-1) at Forschungszentrum Jülich, Germany. Prof. Eichel is also founding director of the “Competence Center Sustainable Electrochemical Process Engineering” (ELECTRA) of the State of North-Rhine-Westphalia (NRW). Current research interests focus on electrochemical energy conversion and storage technologies and their integration in sustainable value chains.
Open Research
Data Availability Statement
The data that support the findings of this study are available from the corresponding author upon reasonable request.


