A Strongly Coupled Metal/Hydroxide Heterostructure Cascades Carbon Dioxide and Nitrate Reduction Reactions toward Efficient Urea Electrosynthesis
Graphical Abstract
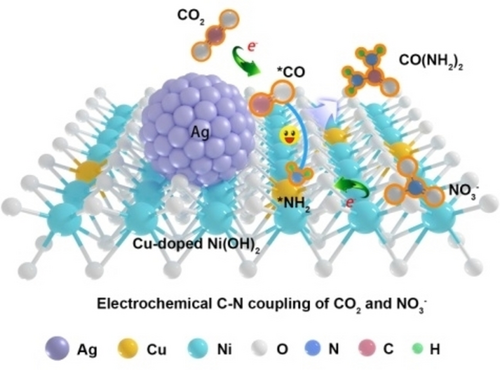
A strongly coupled metal/hydroxide heterostructure was constructed. The heterostructure provides dual-sites for carbon dioxide reduction and nitrate reduction reactions, and thus facilitate efficient C−N coupling toward urea formation. The obtained Ag−CuNi(OH)2 composite delivers greatly enhanced urea yield rate and Faradaic efficiency compared with individual Ag and CuNi(OH)2.
Abstract
The direct coupling of nitrate ions and carbon dioxide for urea synthesis presents an appealing alternative to the Bosch–Meiser process in industry. The simultaneous activation of carbon dioxide and nitrate, however, as well as efficient C−N coupling on single active site, poses significant challenges. Here, we propose a novel metal/hydroxide heterostructure strategy based on synthesizing an Ag−CuNi(OH)2 composite to cascade carbon dioxide and nitrate reduction reactions for urea electrosynthesis. The strongly coupled metal/hydroxide heterostructure interface integrates two distinct sites for carbon dioxide and nitrate activation, and facilitates the coupling of *CO (on silver, where * denotes an active site) and *NH2 (on hydroxide) for urea formation. Moreover, the strongly coupled interface optimizes the water splitting process and facilitates the supply of active hydrogen atoms, thereby expediting the deoxyreduction processes essential for urea formation. Consequently, our Ag−CuNi(OH)2 composite delivers a high urea yield rate of 25.6 mmol gcat.−1 h−1 and high urea Faradaic efficiency of 46.1 %, as well as excellent cycling stability. This work provides new insights into the design of dual-site catalysts for C−N coupling, considering their role on the interface.
Introduction
Urea (CO(NH2)2), the paramount artificially synthesized neutral nitrogen fertilizer, has substantially elevated crop yields, directly contributing to the surge in global population over the last century.1-4 The conventional approach to urea synthesis, however, involves the century-old Bosch–Meiser process, wherein carbon dioxide (CO2) and ammonia (NH3) undergo direct coupling under harsh conditions (temperature: ~200 °C, pressure: ~210 bar).5 In addition, this is an energy-intensive process (including ammonia and urea synthesis), accounting for approximately 1 %–2 % of the world's annual energy consumption and contributing 3 % of global carbon emissions.3, 6 Therefore, to realize the goal of carbon neutrality, the imperative is to develop an efficient and sustainable industrial urea synthesis technique with minimal carbon emissions.
The electrochemical direct coupling of CO2 with nitrogen-based precursors is coming to be seen as an ideal alternative to the well-established Bosch-Meiser process, primarily because it enables electrolysis under mild and environmentally-friendly conditions, such as room temperature, normal atmospheric pressure, and the ability to be powered by sustainable electricity.7-9 Moreover, nitrates (NO3−) are prevalent water pollutants found extensively in surface water. Extracting nitrates from surface water to support urea synthesis not only transforms waste into a valuable resource, but also establishes a closed artificial nitrogen cycle. Nevertheless, urea electrosynthesis from CO2 and NO3− continues to face challenges associated with low urea yield rates and low Faradaic efficiencies (FEs). These difficulties stem from the complex nature of the reaction pathways, which involve 16-electron transfers, and the difficult co-activation of CO2 and NO3− to generate the targeted C- (*CO) and N-intermediates (*NH2) for C−N coupling. Besides, CO2 reduction reactions (CO2RR), which need larger overpotential, are more difficult to trigger than NO3− reduction reactions (NO3RR), resulting in unmatched reduction kinetics.10, 11 Integrating dual-active sites for the CO2RR and the NO3RR in a composite catalyst appears to be an effective strategy for promoting C−N coupling.12, 13 The efficiency of C−N coupling is significantly influenced, however, by the spatial distribution of the in situ generated *CO and *NH2. If *CO and *NH2 are widely separated, their migration requires overcoming a high energy barrier for successful C−N coupling. Consequently, the C- and N-intermediates tend to go through extensive reduction, yielding C1–3 products and NH3 separately, rather than engaging in C−N coupling. This leads to a low urea yield rate and a low FE, as well as diminished C- and N-selectivity.14 The design of a heterogeneous interface offers an ideal solution to the mentioned challenges. By integrating CO2RR and NO3RR active sites on the interface, the dual-sites are positioned closely enough to effectively facilitate the subsequent C−N coupling process.
Here, CO2RR-active Ag and NO3RR-active Cu-doped layered α-Ni(OH)2 (Ag−CuNi(OH)2) were selected to construct a metal/hydroxide interface for cascading the CO2RR and the NO3RR toward urea synthesis. The strongly coupled metal/hydroxide interface facilitates the breaking of H−OH bonds of the interfacial water to generate more active hydrogen atoms on the Ag surface to boost *CO formation. Simultaneously, CuNi(OH)2 ultrathin nanosheets (NSs) accelerate the *NH2 formation kinetics by Cu2+ doping. On the interface, the in situ formed C- and N-intermediates are spontaneously coupled, which was confirmed by operando spectroscopic characterizations and theoretical calculations. As a result, the obtained Ag−CuNi(OH)2 composite sample delivers an urea yield rate of 25.6 mmol gcat.−1 h−1 and an urea FE of 46.1 %, respectively, far exceeding those of individual Ag nanoparticles (NPs) and CuNi(OH)2 NSs.
Results and Discussion
To develop a catalyst for efficient urea electrosynthesis, a robustly coupled Ag−CuNi(OH)2 heterostructure was fabricated. This design was motivated by the fact that Ag NPs exhibit exceptional capability in catalyzing the CO2RR, while CuNi(OH)2 NSs potently boosts NO3RR activity.15 Ag NPs were chemically anchored on ultrathin CuNi(OH)2 NSs using AgNO3 as the silver source and NaBH4 as the reductant. As determined by inductively coupled plasma–atomic emission spectrometry (ICP–AES), the actual Cu doping amount in CuNi(OH)2 and Ag loading amount in the composite are 7.5 wt % and 9.0 wt %, respectively. Powder X-ray diffraction (XRD) patterns of the sample display the characteristic diffraction peaks of α-Ni(OH)2 and face-centered cubic (fcc) phase of Ag (Figure 1a), demonstrating the integration of Ag and CuNi(OH)2. The Ag−CuNi(OH)2 heterostructure still maintains the original two-dimensional (2D) structure of CuNi(OH)2 NSs (Figure 1b and Figure S2). Quasi-spherical Ag NPs with average size of 4.4±2.1 nm uniformly anchored on CuNi(OH)2 NSs were detected (Figure 1c and Figure S5). The lattice spacing of 0.23 nm is attributed to (111) planes of fcc Ag (Figure 1d), while the carrier (CuNi(OH)2 NSs) displays poor crystallinity as it is sensitive to electron beams. Figure 1e clearly shows the Ag/CuNi(OH)2 interface, which was achieved by adjusting the electron beam parallel to the surface of the nanosheet. The elemental mapping image (Figure 1f) depicts Ag bright signal points and a uniform distribution of Cu across the entire nanosheet, further confirming the formation of the Ag−CuNi(OH)2 composite sample. Control samples with different Cu doping levels in α-Ni(OH)2 were synthesized through the same procedure just by adjusting the molar ratios of Cu to Ni precursors (x=0.1 : 5, 0.2 : 5, 0.3 : 5, 0.4 : 5, and 0.5 : 5 in Figures S1–S4).
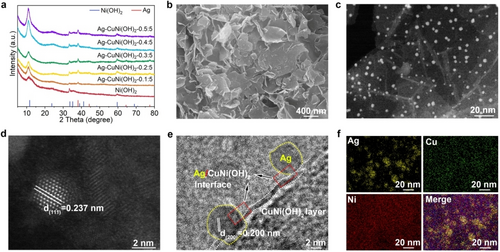
(a) XRD patterns of Ag−CuNi(OH)2-x with different Cu : Ni ratios (x=0 : 5, 0.1 : 5, 0.2 : 5, 0.3 : 5, 0.4 : 5, and 0.5 : 5). (b) Scanning electron microscope (SEM) image, (c,d) aberration-corrected high-angle annular dark-field scanning transmission electron microscope (HAADF-STEM) images, (e) high-resolution TEM (HRTEM) image and (f) elemental mapping images of Ag−CuNi(OH)2 sample (Ag, yellow; Cu, green; Ni, red).
To characterize the electronic structure of Ag−CuNi(OH)2, X-ray photoelectron spectroscopy (XPS) test was performed (Figure S6). The high resolution Ag 3d spectrum for the Ag−CuNi(OH)2 sample (Figure 2a) shows a pair of peaks with binding energies located at 367.7 and 373.7 eV, which are ascribed to 3d5/2 and 3d3/2 of Ag0, respectively.16 The position of the 3d5/2 peak, however, is negatively shifted by 0.5 eV compared with that of Ag NPs, suggesting the occurrence of charge transfer between Ag and CuNi(OH)2. The accumulated electrons on the Ag surface can enhance the efficiency of the CO2RR, and finally improve the C−N coupling.17 The Cu 2p peaks (Figure 2b), in which the signal of Cu2+ is dominant, suggesting that the dopant in the carrier is Cu2+.18 This dopant, specifically Cu2+, has been shown to enhance the NO3RR. The fine structure of the sample was further characterized by synchrotron radiation-based X-ray absorption fine structure (XAFS) spectroscopy. Figure 2c and 2d shows the Ag K-edge X-ray absorption near edge structure (XANES) and the extended XAFS (EXAFS) compared to Ag foil and Ag2O, respectively. The Ag−Ag path with coordination number (CN, Table S1) 11.4 was resolved in the first shell, suggesting the metallic nature of Ag nanocrystals. Cu K-edge XANES and EXAFS spectra were also obtained. Only the Cu−O bond with CN=3.6 was resolved, indicating that Cu2+ was doped into the Ni(OH)2 matrix by replacing Ni sites (Figure 2e and 2f, and Table S1).19 The fine structures of the Ag and Cu K-edges were further confirmed by wavelet transform spectra and fitting results in R space (Figure 2g and 2h, and Figure S7).
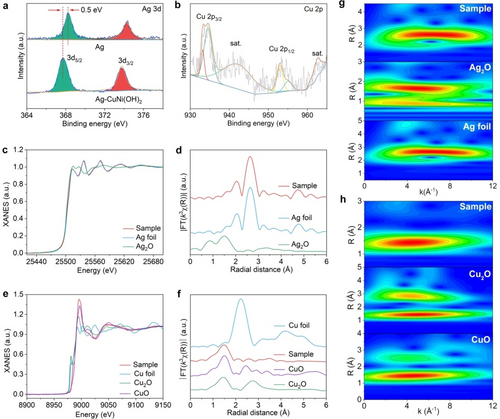
(a) Ag 3d and (b) Cu 2p spectra of Ag−CuNi(OH)2 composite sample. (c) Normalized Ag K-edge XANES spectra of Ag−CuNi(OH)2 sample with Ag foil and Ag2O reference samples, (d) k3-weighted Fourier-transform Ag K-edge. (e) Normalized Cu K-edge XANES spectra of Ag−CuNi(OH)2 sample with Cu foil, Cu2O and CuO references, (f) k3-weighted Fourier-transform Cu K-edge. (g, h) Wavelet transforms of the k2-weighted Ag and Cu K-edge EXAFS signals for the high-coordination shells with Ag foil, Ag2O, Cu2O, and CuO as reference samples.
Urea electrosynthesis testing was carried out in an H-type cell at room temperature using the three-electrode system, in which the anode and cathode chambers were divided by Nafion 117 membrane. The generated urea in the electrolyte in the cathode chamber was quantified spectrophotometrically using the diacetylmonoxime colorimetric and urease decomposition method (Figure S8).1, 20 Linear sweep voltammetry (LSV) measurements were first conducted in different electrolytes to evaluate the current response. As shown in Figure 3a, the current densities for Ag−CuNi(OH)2 sample are ranked as follows: I(KNO3)>I(KNO3+KHCO3)>I(KHCO3+CO2)>I(KNO3+KHCO3+CO2). The lower current density of (KNO3+KHCO3+CO2) suggests that Ag−CuNi(OH)2 can selectively catalyze C−N coupling, because the co-reduction of CO2 and NO3− involves low rate complex reaction pathways with 16-electron transfers.1, 8 Then, the optimal Ag loading and Cu doping in the carrier for urea formation were determined (Figures S9, S10 and 3b). The urea yield rate for Ag−CuNi(OH)2 with 20 wt % Ag loading at −0.5 V versus reversible hydrogen electrode (RHE) was 7.3-fold higher than that of pristine CuNi(OH)2 NSs (Figure S10), which indicates that the urea electrosynthesis activity is greatly improved by the strongly coupled metal/hydroxide heterostructure. The formation kinetics of the key N-intermediate (*NH2) in the NO3RR was enhanced by the Cu doping in layered Ni(OH)2 NSs,15 which can, in turn, facilitate the C−N coupling. As shown in Figure 3b, the urea yield rates and FEs show a volcano-shaped relationship with the Cu doping level in Ni(OH)2, and Ag−CuNi(OH)2–0.3 : 5 (the ratio of 0.3 : 5 denotes Cu : Ni molar ratio for the precursors) delivers the best urea electrosynthesis performance. Therefore, unless otherwise specified, the Ag−CuNi(OH)2 sample refers to CuNi(OH)2–0.3 : 5 with 20 wt % Ag loading. The role of Ag decoration and Cu doping in promoting urea formation indicates that the C−N coupling process is correlated with Ag/CuNi(OH)2 integration. In addition, the potential-dependent C−N coupling performance was assessed. As shown in Figure 3c and Figure S11, the most suitable potential for Ag−CuNi(OH)2 is −0.5 V, at which the urea yield rate is 25.6 mmol gcat.−1 h−1, surpassing most of current state-of-the-art electrocatalysts, as summarized in Table S2. The quantification of the generated urea in the electrolyte was further determined using the urease decomposition method and direct 1H NMR spectra of urea, and the results align consistently with the above finding (Figures S12–S16).
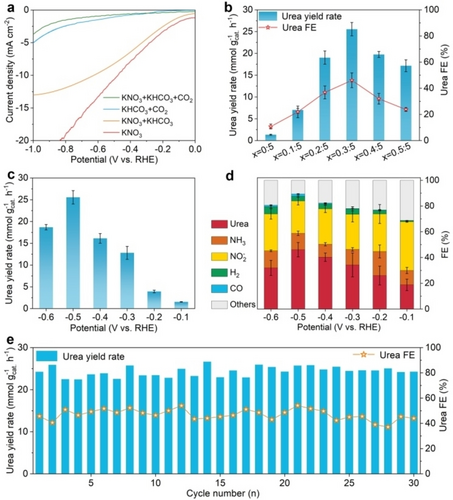
(a) LSV curves of the Ag−CuNi(OH)2 composite sample recorded in different electrolytes. (b) Comparison of the urea electrosynthesis performance of Ag−CuNi(OH)2-x composite samples with different Cu : Ni molar ratios assessed at −0.5 V in a mixture of 0.1 M KHCO3+0.1 M KNO3 with CO2 bubbling. (c) Potential dependence of the urea yield rates and (d) the corresponding FEs of the possible products for the Ag−CuNi(OH)2 composite sample. (e) Cycling stability test with 2 h for one cycle.
In the co-electrolysis of CO2 and NO3−, various kinds of C and N by-products can be formed. Hence, FE is an important parameter for the catalyst evaluation. The possible liquid by-products (e.g., NH4+, as shown in Figure S14, and NO2−, as shown in Figure S12) and gaseous by-products (e.g., H2, CO, as shown in Figure S17) were quantified by spectrophotometry and gas chromatography (GC), respectively. As shown in Figure 3d, the FEs of urea were 18.8 %, 26.0 %, 34.3 %, 40.3 %, 46.1 % and 31.9 % at the corresponding potentials of −0.1, −0.2, −0.3, −0.4, −0.5, and −0.6 V. Besides urea, NO2− is dominant in the electrolyte with FEs of 37.8 %, 29.1 %, 27.2 %, 27.5 %, 25.0 %, and 28.6 %. The FEs of NH3, H2, and CO are all consistently below 10 % across all applied potentials, indicating the effective suppression of half-reactions (NO3RR and CO2RR) and the competitive hydrogen evolution reaction (HER).
To validate the origin of the obtained urea from the C−N coupling of CO2 and NO3−, urea electrosynthesis tests were conducted with/without CO2 feeding. The urea yield rate at −0.5 V decreased from 25.6 mmol gcat.−1 h−1 in the presence of CO2 feeding to 5.9 mmol gcat.−1 h−1 in the absence of CO2 supplementation (Figure S18). Furthermore, 15N isotope labeling experiments, utilizing 15NO3− as the nitrogen source, provided additional confirmation that the urea was indeed formed through the C−N coupling of CO2 and NO3− (Figure S19).21
The stability of a catalyst during repeated cycling is a crucial factor in evaluating its performance. In the case of the Ag−CuNi(OH)2 composite, an assessment of its cycling stability was conducted to gauge its durability and reliability over multiple reaction cycles. The results of the long-term current-density-time (I-t) test reveal that the current density remained nearly constant, showing minimal decay over the course of 50 hours, suggesting a high level of stability in the system (Figure S20). The evaluation of urea yield rates and urea FEs also revealed remarkable stability throughout 30 repeated cycles (60 hours), further indicating the outstanding stability of the composite catalyst (Figure 3e). These results are supported by XRD analysis, TEM, HRTEM and EDS elemental mapping images after the durability test, where the characteristic diffraction peaks for α-Ni(OH)2 and fcc Ag are maintained (Figure S21a). In spite of the slightly increased Ag size, Ag NPs remain firmly anchored on CuNi(OH)2 NSs (Figure S21b–21e). XPS result (Figure S22) also confirmed that there were no oxidation of Ag and reduction of Cu2+ after catalysis, confirming the rigidity of the catalyst.
To decode the tandem role of the composite for the CO2RR and NO3RR, it is essential to determine the role of Ag and CuNi(OH)2 in C−N coupling. The electrochemical performances of Ag NPs (Figure S23) and CuNi(OH)2 NSs in the sole NO3RR and sole CO2RR were assessed. Figure 4a and 4b shows the NO3RR-to-NH3 performance for Ag NPs and CuNi(OH)2 NSs in the potential range of −0.1 to −0.6 V, respectively. The NH3 yield rate and FE at −0.6 V are 178.0 mmol gcat.−1 h−1 and 77.0 % for CuNi(OH)2 NSs, far exceeding those of Ag NPs (6.4 mmol gcat.−1 h−1, 2.1 %). The reason could be ascribed to the interrupted NO2−-to-NH3 process on the Ag surface, which is confirmed by the much higher NO2− yield rate and FE (Figure S24).22 As expected, Cu doping in Ni(OH)2 NSs indeed speeds up NO3RR-to-NH3 conversion (Figure S25). The electrochemical CO2RR-to-CO performance in 0.1 M KHCO3 with continuous CO2 bubbling was investigated, and CO was the only product in the sole CO2RR. As shown in Figure 4c, CO yield rates for Ag NPs were significantly increased as the applied potentials negatively shifted to −0.6 V. The optimal CO yield rate reached 157.2 mmol gcat.−1 h−1, even though the best CO FE was only 24.4 % at −0.3 V.23, 24 In contrast, the CuNi(OH)2 NSs were almost inert towards the CO2RR over the whole potential range (Figure 4d), and only a trace amount of CO was detected. The above results indicate that Ag effectively catalyzes the CO2RR to produce C-intermediate, while the CuNi(OH)2 NSs could only catalyze the NO3RR to generate N-intermediate.
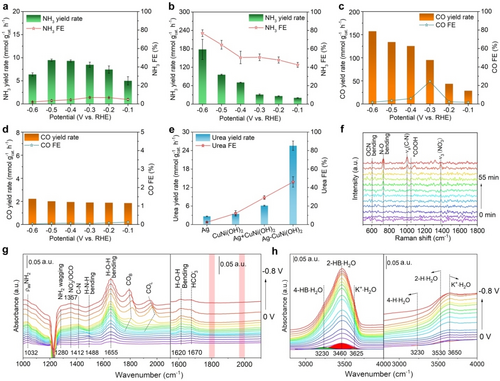
Potential dependence of the NO3RR-to-NH3 performance of (a) Ag NPs and (b) CuNi(OH)2 NSs assessed in 0.1 M KNO3. Potential dependence of the CO2RR-to-CO performance of (c) Ag NPs and (d) CuNi(OH)2 NSs assessed in 0.1 M KHCO3 with continuous CO2 bubbling. (e) Comparison of the urea yield rates and urea FEs of Ag NPs, CuNi(OH)2 NSs, a physical mixture of Ag NPs and CuNi(OH)2 NSs, and the Ag−CuNi(OH)2 sample. (f) Time-resolved in situ Raman spectra for the Ag−CuNi(OH)2 sample recorded in urea electrosynthesis at −0.5 V. (g, h) Potential-dependent in situ infrared spectra for Ag−CuNi(OH)2 and Ag NPs between 0 and −0.8 V with an interval of 0.05 V. The left and right sides in g, h are assigned to Ag−CuNi(OH)2 and Ag NPs, respectively.
To confirm the tandem role of the metal/hydroxide interface in C−N coupling, its electrochemical C−N coupling towards urea synthesis was further evaluated using a physical mixture of Ag NPs (20 wt %) and CuNi(OH)2 NSs (80 wt %) as a catalyst (Figure 4e). The urea yield rate and FE were only 6.1 mmol gcat.−1 h−1 and 29.2 %, respectively, much lower than those of Ag−CuNi(OH)2 (25.6 mmol gcat.−1 h−1 and 46.1 %), verifying that the metal/hydroxide interface indeed facilitates C−N coupling. It is reasonable that C- and N-intermediates participate in C−N coupling more easily due to the following two reasons: 1. The metal/hydroxide interface can simultaneously supply C- and N-intermediates by catalyzing the CO2RR and NO3RR. 2. The dual-sites on the interface are close enough to participate in C−N coupling (Figure S26). In addition, to demonstrate the optimal matching of the metal/hydroxide interface for C−N coupling, noble metal nanoparticles (Pt, Pd, Au, Ag, Ru) and transition metal dopants in Ni(OH)2 (Fe3+, Co2+, Cu2+, Zn2+) were screened. It was found that the Ag/CuNi(OH)2 interface exhibits the optimal matching for urea synthesis (Figures S27–S30).
To trace the possible intermediates for unraveling the reaction pathway, operando Raman and Fourier transform infrared spectroscopy (FTIR) measurements were conducted. Figure 4f shows time-resolved in situ Raman spectra for the Ag−CuNi(OH)2 sample recorded at −0.5 V. The Raman shifts located at 733 and 1384 cm−1 are ascribed to the N−O bending mode and ν3 mode of free NO3−, respectively.25, 26 The peak located at 1044 cm−1 is assigned to *COOH, which appears at 30 min and then disappears at 60 min,27 suggesting that the *CO2 is initially converted to *COOH and then to *CO. The Raman shift located at 604 cm−1 is attributed to OCN bending mode, which is a characteristic peak of *NH2CO, indicating that C−N coupling involves *NH2 and *CO.28 The signal located at 998 cm−1 is assigned to the ν(C−N) mode of urea, demonstrating the formation of urea29 (See the control experiments in Table S3). Thus, it is concluded that the key C- and N-intermediates for C−N coupling toward urea synthesis are *CO (CO2RR) and *NH2 (NO3RR), respectively.30, 31
Figure 4g and 4h show operando infrared signals for the Ag−CuNi(OH)2 sample collected from 1000 to 4000 cm−1, negatively scanned from 0 to −0.8 V versus RHE in comparison with Ag NPs. The vibration peaks located at 1032 and 1280 arise at 0 V and at 1488 cm−1 at −0.05 V, ascribed to ρasNH2, NH2 wagging, and H−N−H bending, respectively, suggesting the conversion of NO3− to NH3 beginning at 0 V.32, 33 Two obvious peaks located around 1800 and 2000 cm−1 emerged at −0.55 V and were assigned to bridge-adsorbed CO (COB) species and linear-adsorbed CO (COL) species, respectively.34 Accordingly, the C−N bond signal at 1412 cm−1 appears at −0.35 V, suggesting the formation of urea.1, 31 The result confirms that *CO is the key C-intermediate for C−N coupling, consistent with the in situ Raman spectroscopy result. In contrast, the *CO signal does not appear over the entire potential range for Ag NPs (see right of Figure 4g). Considering the inert nature of CuNi(OH)2 in the CO2RR, it is inferred that the interface boosts the *CO formation. This conclusion is confirmed by the CO yield rate when normalized to active Ag (Figure S31). Notably, the metal/hydroxide interface has little effect on the NO3RR to NH3. The greatly enhanced *CO formation kinetics could be ascribed to two reasons: 1. The accumulated electrons on Ag on the interface expedite the CO2RR conversion.35 2. The Ag/CuNi(OH)2 interface accelerates the CO2RR kinetics by facilitating the water splitting process to boost active hydrogen atoms for the deoxyreduction processes in urea formation.
Urea formation by CO2 and NO3− coupling is a multi-electron and multi-proton involved process (CO2+2NO3−+16e−+18H+→CO(NH2)2+7H2O). The supply of active hydrogen atoms by water splitting in alkaline media speeds up urea formation by facilitating the deoxyreduction processes, although it is generally ignored. The metal/hydroxide interface alters the microenvironment of the Ag surface, especially the interfacial water structure, which generally determines hydrogen evolution activity.36 Therefore, the hydrogen evolution kinetics is significantly increased due to the Ag/CuNi(OH)2 interface, which is fully supported by the declined Tafel slopes value in the HER (Figure S32). The signal of interfacial water structure in the operando FTIR spectra was further extracted and decoded. The H−O−H bending signal for the composite sample at 1655 cm−1 is much stronger than that of the Ag NPs, suggesting that the intensification of the interfacial water is assisted by the interface. A vibration signal of interfacial water between 3000 and 3700 cm−1 was acquired, which could be deconvoluted into three interfacial water structures, including 4-HB ⋅ H2O (3230 cm−1), 2-HB ⋅ H2O (3460 cm−1), and K+ ⋅ H2O (3650 cm−1).37, 38 As shown in Figure 4h, the signal of interfacial H2O over the whole potential range for the Ag−CuNi(OH)2 sample is stronger than that for Ag NPs. Moreover, K+ ⋅ H2O directly improves the kinetics of H−OH bond breakage, confirming that the metal/hydroxide interface alters the interfacial water structure around Ag and supplies sufficient active H atoms to accelerate the formation kinetics of *CO. Ex situ FTIR spectra also indicated that the configuration of adsorbed water molecules on the interface is changed by promoting Ag⋅⋅⋅H2O⋅⋅⋅Ni2+(OH)2 interaction (Figure S33).39 These results indicate that the generation of active hydrogen atoms at the Ag/CuNi(OH)2 interface is boosted, which, in turn, facilitates the deoxyreduction process. More interestingly, the boosted active hydrogen atoms on the Ag surface tend to add to *CO2, instead of participating in H−H coupling to release hydrogen (Figure 3d).31 As a result, the *CO formation kinetics is accelerated, and the following C−N coupling toward urea formation is accordingly increased.
Theoretical calculations based on density functional theory (DFT) were carried out to deeply understand the unique role of the metal/hydroxide interface in the tandem mechanism. According to HRTEM results, Ag(111) plane and Ni(OH)2 nanosheet were employed as the slabs. The energy profiles of the NO3RR on the Cu-doped Ni(OH)2 and the Ag(111) plane were first calculated (Table S4). Figure 5a depicts the reaction pathway and the calculated configurations of *NO3-to-NH3 on CuNi(OH)2. Figure 5b shows the energy profile (▵G) of each elemental step on the Ag(111) and CuNi(OH)2 planes. It is found that all the steps in the NO3RR on the CuNi(OH)2 plane are exothermic processes except for the step of *HNO→*NHOH with an energy barrier of 0.10 eV (Figure S34). In contrast, the process of *NO2→*HNO2 on the Ag(111) plane is a typical endothermic process with a ▵G of 0.30 eV, which is regarded as the potential-determining step (PDS) in the NO3RR (Figure S35). It is manifest that the *NO2-to-NH3 process needs to overcome a larger energy barrier on the Ag(111) plane, which leads to NO2− and to desorption from the catalyst surface. The DFT result well explains the larger NO2− FE for Ag NPs, confirming the interrupted nature of the *NO2-to-NH3 process on the Ag surface. All the above results demonstrate that the NO3RR occurs on the CuNi(OH)2 surface, rather than on the Ag surface.
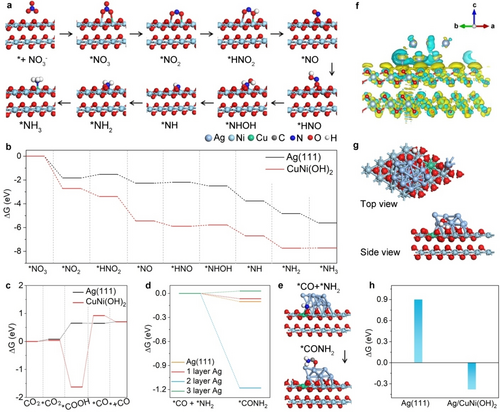
(a) DFT-calculated NO3RR cycle on the CuNi(OH)2 surface. Energy profiles of each elementary step (b) in NO3RR and (c) in CO2RR catalyzed by Ag(111) and CuNi(OH)2 planes. (d) Energy profiles of the first C−N coupling process in urea synthesis as it occurs on the Ag(111) plane and on the Ag/CuNi(OH)2 interface with different Ag layers. (e) Side view of the adsorption configurations of *CO+*NH2 and *CONH2. (f) Differential charge density for the Ag/CuNi(OH)2 interface. The isosurface value of the yellow contour is 0.0015 e/bohr3. (g) The adsorption configuration of *H+*OH, and (h) the energy barriers for H−OH bond dissociation on the Ag/CuNi(OH)2 interface and on the Ag(111) plane.
The energy profiles for the CO2RR on the Ag(111) and CuNi(OH)2 planes were also calculated (Figures S36, S37 and Table S5). As shown in Figure 5c, although the *CO2→*COOH process delivers large energy drop on the CuNi(OH)2 plane, the following step of *COOH→*CO needs to overcome an energy barrier of 2.54 eV, indicating the complete inhibition of the *CO2-to-*CO process on the CuNi(OH)2 surface. This result is consistent with the fact that no CO product was detected on CuNi(OH)2 NSs. Although the conversion of *CO2→*COOH is a endothermic process with a ▵G of 0.58 eV on the Ag(111) plane, *CO can still be generated on the Ag surface at a negative potential. Based on the calculation results for the two half-reactions, the CO2RR and the NO3RR, it is concluded that Ag(111) catalyzes the CO2RR to produce the key C-intermediate (*CO), while the NO3RR tends to occur on the CuNi(OH)2 surface to generate the key N-intermediate (*NH2) toward C−N coupling.
There is another question as to whether *CO on the Ag(111) plane and *NH2 on the CuNi(OH)2 surface can be coupled on the Ag/CuNi(OH)2 interface. To simplify, the energy barriers for the first C−N coupling process were calculated, *CO+*NH2→*CONH2, and urea formation occurred on the metal/hydroxide interface. As shown in Figure 5d and 5e, the process of *CO+*NH2→*CONH2 that occurs on the interface is exothermic (▵G=−1.18 eV) with 2 layers of Ag, suggesting that the C−N coupling process on the metal/hydroxide interface is spontaneous. To further demonstrate that C−N coupling is directly determined by the Ag/CuNi(OH)2 interface, the energy barriers for C−N coupling with different Ag layers on the interface were calculated (Figure S38). Interestingly, as the number of Ag layers increases from 2 to 3, the energy barrier is acutely increased from −1.18 eV to 0.03 eV. It is reasonable to speculate that the energy barrier is further increased as the number of Ag layers increases. Because the in situ generated *CO on the outermost layer is far away from the *NH2, it is difficult for them to participate in C−N coupling. It is worth mentioning that C−N coupling of *NH2 and *CO easily occurs on the Ag(111) plane (▵G=−0.10 eV). The interrupted *NO2-to-*NH2 process, however, impedes the supply of sufficient *NH2, resulting in terrible urea electrosynthesis performance for Ag NPs. Notably, the formed *CONH2 intermediate undergoes the second C−N coupling to form urea or occurs hydrogen addition to formamide. The former process delivers a huge energy drop of −7.14 eV, suggesting the formation of urea is preferred on the Ag/CuNi(OH)2 interface. This conclusion is further confirmed by no signal of formamide in 1H NMR spectra of the electrolyte (Figures S39, S40).40
Differential charge density was employed to analyze the electronic structure on the Ag/CuNi(OH)2 interface. As shown in Figure 5f, the electrons are transferred from CuNi(OH)2 and accumulated on Ag. The accumulated electrons not only facilitate the adsorption of *CO,41 but also intensify water splitting to produce active H atoms on the Ag surface. Hence, the energy barrier against H−OH breakage was calculated. As shown in Figure 5g and 5h, the ▵G values are −0.38 and 0.90 eV on the metal/hydroxide interface and the Ag(111) plane (Figure S41), respectively. This indicates that H−OH bonds are spontaneously split on the metal/hydroxide interface. Therefore, the urea formation is boosted.
Conclusion
In summary, our study illustrates that the metal/hydroxide interface serves as an efficient dual-site system for cascading the CO2RR and the NO3RR towards urea electrosynthesis. Specifically, the metal site is responsible for the CO2RR to *CO, while the hydroxide site catalyzes NO3RR to *NH2. Moreover, the metal/hydroxide interface alters the interfacial water structure and assists water splitting to supply active hydrogen atoms on Ag. The formation kinetics of *CO and *NH2 are all accelerated on the Ag/CuNi(OH)2 interface. The key *CO and *NH2 intermediates on the interface are spontaneously cascaded due to the sufficient distance between the dual sites. Consequently, the synthesized Ag−CuNi(OH)2 composite sample delivers a higher urea yield rate of 25.6 mmol gcat.−1 h−1 and a urea FE of 46.1 % at −0.5 V, as well as excellent cycling stability. Theoretical calculations have confirmed the spontaneous coupling of *CO and *NH2 on the interface. This work provides new insights into catalyst design toward highly efficient and selective C−N coupling based on the metal/hydroxide interface.
Acknowledgments
W. Ye, F. Wu, W. Wang, L. Chen, P. Gao would like to acknowledge financial support provided by the National Natural Science Foundation of China (22005268, 22479125, 22309039, 22206042), the University Leading Talents Program of Zhejiang Province (4095C502222140203, 4095C502222140201), the Zhejiang Provincial Natural Science Foundation of China (LQ22B060007), and the Medical Health Science and Technology Project of the Zhejiang Provincial Health Commission (2023KY1009). The authors thank Dr. Tania Silver for her helpful discussions. Open Access publishing facilitated by University of Wollongong, as part of the Wiley - University of Wollongong agreement via the Council of Australian University Librarians.
Conflict of Interests
The authors declare no conflict of interest.
Open Research
Data Availability Statement
The data that support the findings of this study are available in the supplementary material of this article.


