Targeting Mitochondrial Guanine Quadruplexes for Photoactivatable Chemotherapy in Hypoxic Environments
Graphical Abstract
We report an oxygen independent photoactivatable chemotherapeutic, Ru-TAP-PDC3, that targets mitochondrial guanine quadruplexes. Photoirradiation induces depletion of mitochondrial DNA and mitochondrial dysfunction causing cell death by triggering apoptosis. Importantly, Ru-TAP-PDC3 is negligibly toxic under dark conditions but upon irradiation, significant toxicity is observed.
Abstract
A first example of a mitochondrial G-quadruplex (mitoG4s) targeted Ru(II) photooxidant complex is reported. The complex, Ru-TAP-PDC3 induces photodamage toward guanine quadruplexes (G4s) located in the mitochondrial genome under hypoxic and normoxic conditions. Ru-TAP-PDC3 shows high affinity for mitoG4s and localises within mitochondria of live HeLa cells. Immunolabelling with anti-G4 antibody, BG4, confirms Ru-TAP-PDC3 associates with G4s within the mitochondria of fixed cells. The complex induces depletion of mtDNA in live cells under irradiation at 405 nm, confirmed by loss of PicoGreen signal from mitochondria. Biochemical studies confirm this process induces apoptosis. The complex shows low dark toxicity and an impressive phototoxicity index (PI) of >89 was determined in Hela under very low intensity irradiation, 5 J/cm2. The phototoxicity is thought to operate through both Type II singlet oxygen and Type III pathways depending on normoxic or hypoxic conditions, from live cell assays and plasmid DNA cleavage. Overall, we demonstrate targeting mitoG4s and mtDNA with a photooxidant is a potent route to achieving apoptosis under hypoxic conditions that can be extended to phototherapy.
Introduction
Phototherapy comprises several modalities, including photodynamic therapy (PDT) and photoactivatable chemotherapeutics (PACT). It is an evolving treatment for cancer and infection that can offer high specificity and reduced off-site toxicity, a challenge for conventional chemotherapy.1, 2 The majority of photosensitisers (PSs) operate through a Type II mechanism where cytotoxic singlet oxygen (1O2) is generated as a result of Dexter energy transfer between a triplet state of the PS and triplet oxygen (3O2). A limitation of Type II PDT is its dependence on oxygen as a co-reagent within the tissue environment, since hypoxia is a feature of 90 % of solid tumours.3, 4 Type I processes can also accompany Type II where the excited PS undergoes electron transfer either via substrate oxidation or to molecular oxygen to form superoxide (O2⋅−) leading to subsequent formation of other ROS.5 An alternative Type III process has been suggested where PSs can damage biological substrates without participation of oxygen.6, 7 The majority of Ru(II) complexes reported as PSs are Type II systems.8 They are widely investigated in this regard due to their chemical stability, photostability, and their long-lived 3MLCT that can promote triplet photosensitisation for both 1O2 and ROS generation.9-11 Ruthenium (II) polypyridyl complexes have been increasingly used in PACT development, where σ/π ligand character can tune photoreactivity and photoinduced ligand dissociation, releasing cytotoxic ligands or metal centres with anticancer activity that may be oxygen independent.12-19 An additional and potentially important class of PACT agents are those capable of direct photooxidation or photoactivatable crosslinking DNA, for example, Ru(II) complexes bearing electron deficient tetraazaphenanthrene (TAP) ligands.20-24 Such ligands shift the photooxidation potential of the complex to provide the thermodynamic driving force to directly photooxidise guanine nucleobases through what is believed to be a proton coupled electron transfer (PCET).25 PCET has been shown to effectively cleave DNA, and in some instances also produce covalent photoadducts through an oxygen independent pathway.26, 27 We recently reported strategies to drive complexes of this type to the nucleus of live cells for the first time where they showed significant phototoxicity but low dark cytotoxicity.28
Many phototherapeutics tested to date are not discretely targeted within the cell, but even with broad dispersion through the cell, activity often arises from damage to duplex DNA, most frequently to the guanine residues, as they are the most easily oxidised. G-rich DNA and RNA sequences can form guanine quadruplexes (G4s) under physiological conditions, where guanines are stabilised through Hoogsteen hydrogen bonding and Van der Waals forces to form tetrads that are further stabilised between monovalent cations.29 These structures have been confirmed to form in cells and are associated with essential biological processes.30-32 In particular, G4 forming sequences, GnNxGnNxGnNxGn; n≥2, x≤7, have been shown to be abundant in untranslated and promoter regions of oncogenes.33 Thus, ligands that bind G4s have potential as anticancer therapeutics, by stalling cell proliferation, inducing DNA damage and causing apoptosis.34-37 G4s offer a unique target for redox active therapeutics, due to the vulnerability of guanine as the most readily oxidised base. Additionally, when multiple guanines are contiguous in a DNA sequence, the oxidation potential of the 5′ most guanine becomes further reduced, this is an exciting and as yet underexplored prospect for specific targeting.38 The Thomas group developed and investigated the bimetallic [{Ru(tap)2}2(tpphz)]4+ complex for its G4 binding capacity where the complex was shown to photodamage G4s in solution and induced phototoxicity in human C8161 melanoma cells.23 Elijas et al. have reported recent examples of Ru(II)-TAP containing complexes that associate with non-canonical DNA structures (G4s) in solution.30, 39 In the latter case, cell uptake was observed with wide distribution of complex in fixed cells. The complex showed phototoxicity, although the origin of this effect was not identified, it was noted that the complex reached the nucleus.
Mitochondrial G4 structures (mitoG4s) have recieved less investigation compared to their nuclear counterparts and their presence and impact on cellular functions is not yet fully resolved. Nonetheless, mitochondria are a rational target for therapeutics due to their essential role in cellular energy generation in the form of ATP through oxidative phosphorylation, in cell death signalling and in maintaining redox homeostasis.40-44 Mitochondria possess their own genome, approximately 16.5 kb in length with circular double stranded nucleoids encoding for 37 genes involved in oxidative phosphorylation in most mammalian cells. Furthermore, mitochondria present favourable K+ rich conditions for G4 formation (150–180 mM). G-rich sequences are prevalent in mammalian mtDNA with >200 putative quadruplex forming sequences identified in the mitochondrial genome.45 In comparison to nuclear DNA, mtDNA lacks protective histones and has reduced repair machinery resulting in high vulnerability to mtDNA targeting drugs. Therapeutic drugs designed to target and irreparably damage mtDNA can cause loss of mitochondrial function, caspase 9 activation and apoptosis. However there is currently a lack of probes that specifically target mitoG4s to enable study and no mitoG4 targeted phototherapeutics to date.46, 47
Furthermore, while the majority of cellular studies investigating PSs to date have been centred around 2D cell monolayer testbeds, the use of 3D cellular models, such as multicellular tumour spheroids (MCTS), is increasing steadily as they offer a more physiologically relevant intermediate between in vitro cell monolayer and in vivo studies. For example, we recently reported an osmium(II) complex, [Os-(R4)2]10+, that successfully penetrated pancreatic MCTS, and a ruthenium(II) complex, [Ru(bqp)(bqpCOOEt)]2+, and its bioconjugates that showed excellent phototoxic potential in pancreatic MCTS.48, 49 Other examples include work by Raza et al. with human melanoma MCTS to study the phototoxic capacity of their [{Ru(tap)2}2(tpphz)]4+ complex in a 3D cellular environment and Karges et al. who prepared exceptionally large (800 μm) MCTS.50-52 The layered structure of MCTS more accurately mimics the tumour microenvironment with proliferative, quiescent, senescent and hypoxic or necrotic regions, making them an ideal choice of 3D cell model.
Here we present, to our knowledge, the first Ru(II) complex directed toward photodamage of G4s located in the mitochondrial genome. We evaluate the affinity of Ru-TAP-PDC3 toward putative mitoG4 structures and compare it to duplex DNA. We demonstrate that the complex localises within mitochondria of live HeLa cells where, upon irradiation at 405 nm, mtDNA is depleted, mitochondrial potential is reduced, caspase activation occurs, and apoptosis is induced. The process is proposed to originate from photoinduced electron transfer (PET) directly damaging mtDNA, and occurs in normoxic and hypoxic conditions, generating a potent and selective light activated therapeutic that targets mitoG4s and mtDNA.
Results and Discussion
The synthetic route to Ru-TAP-PDC3 is illustrated in Scheme 1B. Phendione-DC3 was synthesised as recently reported.53 The TPPHz-PDC3 ligand was generated through Schiff-base condensation between phendione-DC3 and 5,6-diamino-phenanthroline, followed by direct complexation to the metal centre. Since [Ru(tap)2Cl2] is less reactive than similar polypyridyl complexes, the Ru-aquo intermediate ([Ru(tap)2(H2O)2]) was prepared by treatment of [Ru(tap)2Cl2] with silver triflate prior to TPPHz-PDC3 complexation. The complex was purified on C-18 preparation silica plates. Characterisation was completed using 1H NMR and high-resolution mass spec (Figures S2 and S6) and purity was confirmed through HPLC (Figure S7).
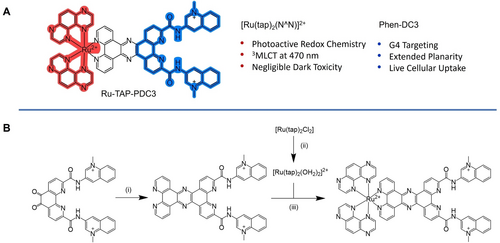
(A) Structure of Ru-TAP-PDC3 and its associated features. (B) Synthetic Scheme of Ru-TAP-PDC3, (i) reflux in dry MeCN under argon with 5,6-diamino-phenanthroline, 18 h. (ii) reflux in water with AgCl for 4 h. (iii) reflux overnight in ethylene glycol/water (4/1).
As shown in Figure 1B, the absorption spectra of Ru-TAP-PDC3 shows features at 375, 415 and 465 nm with a shoulder extending to 525 nm in water, buffer and MeCN. DFT calculations indicate that the visible absorbance originates from 1MLCT transitions. Interestingly, as reflected in the electron density difference maps, the lowest energy transition contains contributions from both MLCT localised on the TAP ligands and a transition involving the tpphz bridge. Excitation into the MLCT absorbance Figure 1B, results in an intense emission with maxima at 628 nm (H2O), 625 nm (buffer), and at 615 nm (MeCN). A hypochromic shift occurs when exciting the complex in buffer compared to DI water (ca. 15 %) under absorbance matched conditions. The emission decays according to biexponential kinetics. In water the complex has lifetimes and fractional amplitudes of 1=795 ns (81 %) and 2=75 ns (19 %), in MeCN 1=634 ns (90 %) and 2=39 ns (10 %), and in phosphate buffer 1=616 (70 %) ns and 2=93 ns (30 %). Similar biexponential decay was observed from the previously reported phenanthroline derivative, RuPDC3.53
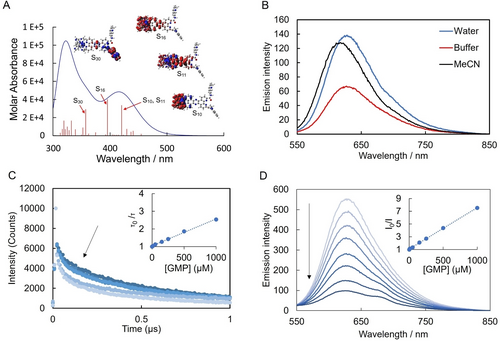
(A) Theoretical absorption spectrum modelled and electron density difference maps for highest oscillator strength transitions from DFT calculations in water (see Supporting Information for details) (B) Absorption and emission spectra of Ru-TAP-PDC3 (10 μM) in DI H2O, MeCN and KPi buffer (10 mM potassium phosphate, 100 mM Potassium chloride 7 pH), with excitation at 470 nm. (C) Lifetime and (B) Luminescent quenching of Ru-TAP-PDC3 (10 μM) lifetimes with increasing concentrations of GMP (0 mM–1 mM) in KPi buffer, insets: Stern–Volmer plot of (C) lifetimes and (D) luminescent intensity.
Given the low-lying states on the PDC3, we first estimated the photoreduction potential of the complex to anticipate if there is sufficient driving force for guanine photooxidation. From voltammetric and 77 °K emission studies (Figure S8 and S9) Ru-TAP-PDC3 has an E*red of ∼1.3 eV, which is indeed sufficient.54 Correspondingly, in titration of GMP (guanosine monophosphate) against Ru-TAP-PDC3 (Figure 2C) both steady state emission intensity and luminescence lifetime decreased. The inset of Figure 1C and Figure 1D show the resulting Stern–Volmer plots revealing a modest difference in the slopes of each plot (0.0015 and 0.0065 respectively). This indicates the quenching observed is a combination of static and dynamic process, the static component attributed to ion pairing between the cationic complex and anionic GMP. The lifetime data can be used to estimate the quenching constant; Stern–Volmer plot derived from the lifetime quenching studies (inset Figure 1C) was used to calculate the quenching constant, kq=2.5×10⁹ s−1, consistent with a diffusion-controlled process for the dynamic component of quenching attributed to photoinduced electron transfer.
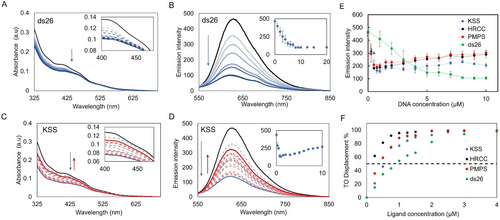
Representative UV/Vis absorption for Ru-TAP-PDC3 (10 μM) when titrated against (A) ds26 (dsDNA) and (C) KSS (mitoG4), decreases in absorbance are represented in blue and increases are represented in red. insets: Absorption spectra of (A) ds26 and (C) KSS titration from 400 nm to 475 nm. Representative luminescence titration of Ru-TAP-PDC3 (10 μM) when titrated with (B) ds26 and (D) KSS (λex=465 nm), inset: luminescence at 630 nm when titrated with (B) ds26 and (D) KSS. (E) Luminescent quenching curves of Ru-TAP-PDC3 (10 μM) against a series of DNA oligonucleotides (KSS, HRCC, ctDNA and PMPS). (F) G4-FID curves of Ru-TAP-PDC3 against a series of DNA oligonucleotides (HRCC, KSS, PMPS and ds26). Error bars show standard deviation of n= 3 replicate measurements
Association of Ru-TAP-PDC3 with DNA was investigated initially by absorbance and luminescence spectroscopy on titration against representative nuclear G4, mitoG4s and dsDNA sequences. The selected oligonucleotides were; the human telomeric quadruplex; 22AG, putative mitoG4s; KSS, PMPS, and HRCC and the hairpin oligonucleotide; ds26. 22AG forms a mixed hybrid structure when annealed in buffer with a high K+ concentration (100 mM KCl). Whereas the three mitoG4s all form parallel structures under these same conditions. G4 assembly was confirmed using circular dichroism (CD) (FigureS13). Titrations were carried out in KPi buffer (10 mM potassium phosphate buffer with 100 mM KCl at 7.4 pH). Luminescent and lifetime quenching studies of Ru-TAP-PDC3 were completed with the mitoG4s selected, indicating a primary contribution from static quenching when Ru-TAP-PDC3 is fully bound to mitoG4s (Figure S10. For all titrations in this study, measurements were made after sufficient time to ensure no further spectral changes occurred ensuring that equilibrium had been reached.
Absorbance titrations of the dsDNA hairpin oligonucleotide, ds26, are shown in Figure 2A. Ru-TAP-PDC3 titrated with increasing concentrations of dsDNA induced a hypochromic response, at 415 nm and 465 nm with a saturable response. In contrast, for parallel mitoG4s, there is hypochromism on initial Ru-TAP-PDC3 binding, however, this is followed by a hyperchromic shift at higher G4 concentration. These hyperchromic and hypochromic changes in the absorption binding studies are reflected also in the luminescence spectral binding studies (Figure S11and S12).
When Ru-TAP-PDC3 is titrated with nuclear G4s and mitoG4s the luminescence is partially quenched. Given that G4s comprise contiguous guanine sequences, the decreased emission intensity is taken to indicate that PET occurs on Ru-TAP-PDC3 binding. Following this initial emission decrease, signal saturates at a binding ratio of 4 : 1, Ru-TAP-PDC3 to G4 followed by a modest increase in luminescence with increasing concentrations of G4s. When the luminescence is corrected to account for changes to absorbance cross section, the modest increase in luminescence remains. This behaviour is taken to indicate that multiple G4 binding modes occur for the complex that vary in electron transfer efficiency, e.g. through distance effects. When titrated against the dsDNA oligo, ds26, quenching is also observed however the response is linear (Figure 2B). The McGhee-von Hippel binding model may typically be applied to extract binding affinities, but, attempts to fit our data were unsuccessful in case of G4s, due to the complexity of the response.55
Instead, to estimate binding affinity a G4 fluorescent intercalator displacement (G4-FID) assay was carried out. This assay is widely applied to study binding affinity of novel DNA probes based on the competitive displacement of Thiazole Orange (TO) from G4s or dsDNA.56 Affinities are reported as concentrations required to displace 50 % of TO (DC50). Figure 2F illustrates the results of the G4-FID assay for Ru-TAP-PDC3. Ru-TAP-PDC3 showed outstanding displacement of TO across all oligonucleotides tested with near 100 % displacement at saturation (Table 1). In particular it is evident from Figure 2F that Ru-TAP-PDC3 binds with higher affinity to G4s when compared to ds26. The complex exhibits particular preference for the parallel mitoG4s HRCC, PMPS and KSS with DC50 values 0.20, 0.53, 0.40 μM respectively. These values indicate that Ru-TAP-PDC3 is a high affinity ligand for each mitoG4. The mixed hybrid, 22AG, had a DC50 value 0.90 μM, and can be defined as a medium affinity ligand, likewise, dsDNA had a DC50 of 0.91 μM. In comparison to literature reported of Phen-DC3 G4-FID experiments, Ru-TAP-PDC3 shows comparable displacement values. Phen-DC3 has a significant DC50 0.31 μM when binding to 22AG and 0.25 μM binding to c-kit under the same conditions.56
Solution |
Absorbance features (nm) |
Emission (nm) |
DC50 (μM) |
|---|---|---|---|
MeCN |
373, 419, 455 |
615 |
|
DI H2O |
373, 413, 464 |
628 |
|
Buffer |
376, 410, 461 |
625 |
|
KSS |
378, 429 |
630 |
0.40 |
HRCC |
382, 423 |
627 |
0.20 |
PMPS |
373, 414 |
627 |
0.53 |
ds26 |
374, 424 |
620 |
0.91 |
Circular Dichroism (CD) measurements were carried out to evaluate any impact of Ru-TAP-PDC3 on the G4 structures. Interestingly, when Ru-TAP-PDC3 binds to mitoG4s, no significant change in CD or induced CD is observed. These observations in combination with significant displacement of TO are suggestive of end-capping as the primary binding mode for the parallel mitoG4s. However, when bound to 22AG at increasing concentrations ([1]:[5], [G4]:[Ru]) a decrease at ca. 270 nm is evident (Figure S13). A similar change in the CD spectra of human telomeric G4s has previously been reported for Phen-DC3, where authors suggested the ligand disrupts the tetrad. As Ru-TAP-PDC3 incorporates Phen-DC3, this binding mode should also be considered as a possibility to explain the difference in binding affinities.57 Particularly interesting is the markedly different behaviour of Ru-TAP-PDC3 compared to related complex, Ru-phen-PDC3, where binding resulted in significant structural disruption of nuclear G4s of parallel topology in the latter case.53
Ru-TAP-PDC3 was examined in live HeLa and HEK-293 cells using confocal fluorescence microscopy. HeLa cells were selected for this study due to their mtDNA rich mitochondria.58 To investigate cellular uptake HeLa cells were incubated with Ru-TAP-PDC3, at varying concentrations between 30 μM to 200 μM for 24 h (FigureS14). 50 μM Ru-TAP-PDC3 was used thereafter as the optimum concentration for imaging that balanced emission intensity and phototoxicity. Assessing cellular uptake of Ru-TAP-PDC3 over time (3–24 h), a 24 h incubation was found to be optimum (Figure S15). Uptake was then tested in HEK-293 cells at 50 μM (24 h). Localisation of Ru-TAP-PDC3 in HeLa and HEK-293 cells was determined using co-localisation studies with well-established commercial probes (Table S2). The complex was found to localise mainly in the mitochondria of HeLa cells following 24 h incubation with 50 μM Ru-TAP-PDC3. However, following 48 h incubation, the mitochondrial accumulation of the complex was reduced and the Pearson's coefficient value with BioTracker 488 mitochondrial dye reduced from 0.60±0.11 at 24 h incubation to 0.33±0.04 at 48 h. This is likely due to the impact of the complex on mitochondrial membrane integrity after prolonged uptake. Moreover, a Pearson's coefficient of 0.46±0.08 and 0.39±0.06 with LysoTracker Green at 24 h or 48 h incubation of Ru-TAP-PDC3 respectively indicates that the majority of the complex is localised in the mitochondria and lysosomes of HeLa cells.
In contrast, in non-cancer HEK-293 cells, the complex was found to suffer endosomal entrapment, localising mainly in the late endosomes and lysosomes, with a Pearson's coefficient of 0.49±0.14 (Late Endosomes-GFP) and 0.39±0.01 (LysoTracker Green) respectively at 24 h. The extent of localisation of Ru-TAP-PDC3 to the mitochondria of HEK-293 cells at 24 h incubation was low, with a Pearson's coefficient of 0.30±0.04 with BioTracker 488, likely attributed to late arrival to the mitochondria from the endosome. If this distinction extends more broadly, between cancer and non-cancer cells it may offer a therapeutic advantage.
To understand if Ru-TAP-PDC3 is associating with G4s in the mitochondria we evaluated its co-localisation with the anti-G4 antibody BG4. BG4 is capable of labelling G4s throughout the cell, including nuclear, cytoplasmic RNA and recently it has been confirmed to label mitoG4s.31, 59 Co-stained images of cells with BG4 and Ru-TAP-PDC3 are shown in Figure 3B, where there is clearly excellent co-localisation between BG4 and the Ru-TAP-PDC3 (Pearson's coefficient of 0.63±0.07). It is expected that some BG4 and Ru-TAP-PDC3 foci do not overlap since BG4 also labels RNA G4s and there is partial lysosomal localisation of Ru-TAP-PDC3. Importantly, in the regions ascribed to mitochondria, the overlap is the strongest.
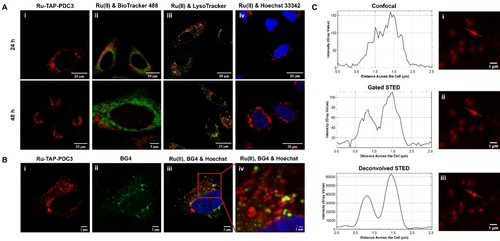
Confocal imaging of (A)(i) Ru-TAP-PDC3 (50 μM) in live HeLa cells after 24 or 48 h incubation and overlayed with (ii) BioTracker 488, (iii) LysoTracker green and (iv) Hoechst 33342 and (B) shows fixed HeLa cells with (i) Ru-TAP-PDC3 (50 μM, 24 h), (ii) BG4 and (iii & iv) the overlay with Hoechst 33342. Scale bars read 5 μm (i, ii & iii) and 1 μm (iv). (C) Depicts (i) confocal, (ii) gated STED and (iii) deconvolved STED images of Ru-TAP-PDC3 (50 μM, 24 h) in a live HeLa cell with corresponding profile plots (generated using ImageJ). An image of the full cell, with the region of interest labelled, can be found in Figure S20 (λ=405 nm). STED images were deconvolved using Huygens Professional deconvolution software. Scale bars read 1 μm.
STED microscopy was used to improve the resolution of the Ru-TAP-PDC3 foci. A 660 nm depletion laser was selected for STED imaging, which aligns with the 3MLCT emission of Ru-TAP-PDC3 at ca. 630 nm. A comparison of confocal, gated STED and deconvolved STED images of a selected region of interest (ROI) of a live HeLa cell treated with Ru-TAP-PDC3 showed a clear improvement in resolution of the foci (Figure 3C). The full cell image, showing the selected ROI, can be found in Figure S20. Dark toxicity studies of Ru-TAP-PDC3 determined that in the absence of light the IC50 was >200 μM in both HeLa and HEK-293 cells lines, confirming Ru-TAP-PDC3 shows negligible dark toxicity. In contrast, Ru-TAP-PDC3 was found to be highly phototoxic in the test cell lines and interestingly, this effect is time dependent at a low irradiation dose of 5 J/cm2 (Figure S24). Table 2 summarises the measured phototoxicity indices (PI), it is important to note that since PI is the ratio of light and dark toxicity, and the exact dark IC50 value could not be determined, the PI values of the complex are likely significantly higher than reported here. The highest phototoxicity was observed in HeLa cells following 24 h incubation with Ru-TAP-PDC3 where a PI of >89 was measured under very low intensity (5 J/cm2) irradiation conditions and >161 under 15 J/cm2 fluence (470 nm LED was used for both fluences). By comparison after 48 h incubation with the complex the PI values decreased to >69 (24 h) and >170 (48 h) at 15 J/cm2. Varying incubation time had minimal impact on the light IC50 values. Given the mitochondrial localisation diminishes between 24 h and 48 h, the data suggest that mitochondrial localisation may not alone be essential for phototoxic effect.
Cell Model |
Incub. time |
aLight IC50 (μM) |
bLight IC50 (μM) |
Dark IC50 (μM) |
aPI
|
bPI |
|---|---|---|---|---|---|---|
2D Hypoxic |
24 h |
>100 |
16±1.17 |
>200 |
|
>13 |
2D normoxic |
24 h |
2.24±0.04 |
1.24±0.04 |
>89 |
>161 |
|
48 h |
2.93±0.01 |
1.17±0.04 |
>69 |
>170 |
||
3D |
24 h |
23.07±3.31 |
|
36.61±0.13 |
1.6 |
|
- [a] Phototoxicity studies at 5±0.54 J/cm2 and [b] 15±1.6 J/cm2 using a 470 nm LED, where the phototoxicity index (PI) is the ratio of dark IC50 to light IC50.
Overall PI values are very impressive, compared to PSs reported under comparable conditions including clinically approved PSs.60, 61 For example, Delaey et al. have reported a PI of >10 (light IC50 2.57±0.17 μM & dark IC50>25 μM) for Photofrin (a clinically approved PS) in HeLa cells at a total irradiation dose of 5 J/cm2, under very similar conditions to the lower irradiation studies under normoxic conditions reported here.62 It is important to note that although we tried to match the irradiance power to this study, direct comparison of PI values across studies is challenging since different spectral bandwidths of irradiance are used.8, 62
Since Ruthenium complexes bearing TAP ligands are potentially capable of an oxygen independent phototoxicity, we wanted to examine the impact of a hypoxic environment on the phototoxic capacity of Ru-TAP-PDC3 in HeLa cells. Cobalt Chloride (CoCl2) was selected for phototoxicity studies as it is a widely used chemical hypoxia model for in vitro studies.63 With this method, the stabilisation of hypoxia inducible factor 1 alpha subunit (HIF-1α) is maintained for some hours after treatment, allowing for a greater window for experimentation when compared to low-oxygen induced hypoxia.63 The chemical induction of hypoxia with CoCl2 was confirmed in our test cells using an enzyme linked immunosorbent assay to detect HIF-1α in cell lysates.64
Under low irradiation conditions (5 J/cm2) a hypoxic light IC50 of >100 μM was determined, compared to a normoxic light IC50 of 2.24±0.04, indicating oxygen plays a significant role in phototoxicity observed under lower intensity irradiation. However, increasing the irradiation dose to 15 J/cm2 under hypoxic conditions, Ru-TAP-PDC3 notably displayed strong phototoxicity towards HeLa cells with a PI of >13 (light IC50, 16±1.17 μM). Although a higher light dosage is required under hypoxic conditions, 15 J/cm2 irradiation intensity remains a modest light dosage and well within intensities reported for PDT studies.65 The light/concentration effect observed under hypoxic conditions is expected, as the probability of PET to guanine depends on localisation, binding, and orientation within the G4 structure. This means that at low flux or concentration, the probability of PET is lower than for a Type III mechanism. Nonetheless, it can be promoted with a higher total irradiation dose rather than increased concentration, which is an important distinction for a chemotherapeutic.
Overall, the data indicates that both oxygen dependent and independent pathways operate for phototoxicity of Ru-TAP-PDC3. It is also important to highlight that a single molecule of Ru-TAP-PDC3 can turnover 1O2 in an oxygen rich environment, allowing for potent phototoxic effects. In contrast, the recovery of the Ru(II) centre, crucial for PET, may be slow or irreversible. Moreover, PET requires direct binding of Ru(II) to a G4 structure, and clearly, as the complex remains emissive in the cellular environment, not all Ru(II) reaches G4s. This results in a lower effective concentration and consequently a higher light intensity requirement for effect, suggesting that under hypoxic conditions there may be a light intensity threshold to oxygen independent PET and that ROS generation contributes to toxicity in the presence of oxygen.
Finally, gel electrophoresis studies were carried out using supercoiled pUC19 plasmid DNA exposed to Ru-TAP-PDC3, and 1O2 scavenger, sodium azide (NaN3). Normoxic control gels were carried out in the absence of NaN3. The resulting gels (Figure S30) indicated that Ru-TAP-PDC3 cleaves DNA highly efficiently under normoxic conditions, likely through singlet oxygen generation, but also confirms that cleavage persists in the presence of singlet oxygen trap, consistent with data from the cell studies. In addition, there was no emergence of bands that could be associated with photoadducts or covalent bond formation under irradiation conditions selected to mimic phototoxicity assays. This indicates that phototoxicity induced by Ru-TAP-PDC3 is induced through cleavage rather than photoadduct formation.
To understand the mechanism of phototoxicity, the impact of photolysis on mitochondrial membrane potential (ΔΨm) was investigated, using the commercial dye JC-1 (Figure 4D). By determining the ΔΨm of the HeLa cells immediately after irradiation we were able to capture the direct response of the cells to Ru-TAP-PDC3 when activated by 470 nm light and its impact on mitochondrial function. As shown in Figure 4D, there is a significant decrease in ΔΨm of HeLa cells treated with Ru-TAP-PDC3 (3 μM for 24 h) immediately after photoirradiation. A decrease of 51 % following a total irradiation dose of 5 J/cm2, 74 % at 15 J/cm2 under normoxic conditions and 69 % at 15 J/cm2 under hypoxic conditions was recorded. The data show that photoactivation of Ru-TAP-PDC3 causes significant mitochondrial depolarisation. Control studies, with Ru-TAP-PDC3 treated cells maintained in the dark, confirmed there was minimal disruption to the mitochondrial membrane potential without photoirradiation. Contextualising the magnitude of ΔΨm for the complex, a positive control using mitochondrial membrane disruptor, CCCP (carbonyl cyanide m-chlorophenyl hydrazone; 20 μM, 2 h) resulted in a 37 % decrease in ΔΨm relative to untreated control cells incubated in the dark.
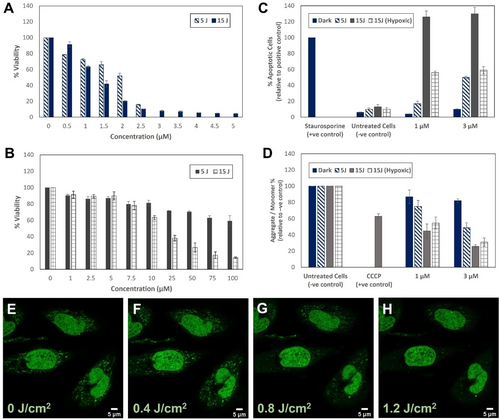
Viability of HeLa cells treated with Ru-TAP-PDC3 for 24 h and irradiated in (A) normoxic or (B) hypoxic conditions (total irradiation dose of 5 J/cm2 or 15 J/cm2 using a 470 nm LED, and results of the (C) FAM-FLICA polycaspase and (D) JC-1 mitochondrial membrane potential assays in HeLa cells (24 h incubation) where a decrease in the ratio of red (J-aggregates) to green (J-monomers) emission intensity indicates mitochondrial depolarisation. 5 J or 15 J in Figure legend indicates a total irradiation dose of 5 J/cm2 (0.5 h) or 15 J/cm2 (1.5 h) using a 470 nm LED. Confocal images in live HeLa cells pre-treated with Ru-TAP-PDC3 (3 μM, 24 h) show PicoGreen (E) prior to irradiation at 405 nm and after (F) 5, (G) 10 or (H) 15 minutes of continuous irradiation PicoGreen was excited at 495 nm with emission collected between 520–530 nm (total irradiation dose after 15 minutes=1.2 J/cm2)..
To investigate direct mtDNA damage caused Ru-TAP-PDC3 photoactivation, the commercial PicoGreen probe was used. PicoGreen stains both nuclear dsDNA and mtDNA (punctate cytoplasmic staining) in live cells.66 Fluorescent signal in the cytoplasm arising from PicoGreen emission is directly correlated to the quantity of mtDNA nucleoids within a cell and reduction of this signal is indicative of mtDNA depletion. HeLa cells treated with Ru-TAP-PDC3 for 24 h (2 μM) were counterstained with 2 μL/mL PicoGreen. As shown in Figure 4G and 4H, after 10 or 15 minutes irradiation of the Ru(II) complex (405 nm, 1.2 J/cm2), clear reduction of PicoGreen emission in the mitochondrial region is observed. This marks a reduction in the number of mitochondrial nucleoids, indicating mtDNA damage is occurring. Importantly, this result supports localisation of Ru-TAP-PDC3 to the mitochondria and that direct binding of mtDNA to the Ru(II) complex occurs. Excitation at 405 nm was used to irradiate cells in Figure 4E–D, as we observed in control studies that Picogreen photobleached under direct irradiation at 470 nm but was photostable under 405 nm excitation. This again confirms that a combination of the Ru(II) complex and light exposure leads to mtDNA damage. Furthermore, comparing BG4 staining of HeLa cells containing Ru-TAP-PDC3 (3 μM, 24 h) fixed and treated with BG4 before and after photoirradiation (470 nm, 5 J/cm2) as shown in Figure S19, we observed a loss of the punctate staining by BG4, observed outside the nucleus on irradiation. This we tentatively attribute to loss of mitochondrial G4 foci caused by their photocleavage.
To assess the mechanism of cell death when Ru-TAP-PDC3 is activated by light, a FAM FLICA polycaspase assay kit was used. The FLICA assay labels active caspase enzymes present during apoptosis to establish if cell death is by apoptosis. The results from the FLICA polycaspase activity assay (Figure 4D) indicate that apoptotic pathways in HeLa cells are being triggered when Ru-TAP-PDC3 is activated with 470 nm light. Activation of caspases is a central event in apoptosis. Thus, the upregulation of active caspase enzymes is an indication that cells are undergoing apoptosis. A positive control was prepared by treating the cells with 1 μM Staurosporine for 3 h and the percentage of apoptotic cells was determined relative to this control. At 3 μM Ru-TAP-PDC3, similar levels of apoptosis can be observed for normoxic cells irradiated at a dose of 5 J/cm2 and hypoxic cells irradiated at 15 J/cm2. Hypoxia is often associated with pro-survival responses in cells because of the stabilisation and activation of HIF-1α. The pro-survival effect may explain why, although the immediate response to irradiation (% apoptotic cells) is similar in both normoxic (5 J/cm2) and hypoxic (15 J/cm2) environments, the hypoxic light IC50 is significantly higher than the light IC50 under normoxic conditions. The higher irradiation dose (15 J/cm2) resulted in roughly 30 % more apoptotic cells (normoxic) in comparison to the positive control at both 1 and 3 μM of Ru-TAP-PDC3. Control cells treated with Ru-TAP-PDC3 and kept in the dark during the irradiation step remained healthy with ≤10 % apoptotic cells.
Apoptosis can occur through two pathways: the intrinsic (mitochondrial) pathway, and the extrinsic (death receptor) pathway.67, 68 The intrinsic pathway of apoptosis is initiated following mtDNA damage and results in a decrease in ΔΨm, thus apoptotic cells exhibiting reduced ΔΨm are thought to follow the intrinsic pathway.40, 69 Combining the results of the studies with JC-1, which indicate the ΔΨm of HeLa cells is reduced by Ru-TAP-PDC3 when activated by light and apoptosis confirmed by the FAM-FLICA assay, we can infer that apoptosis is occurring through the intrinsic pathway under normoxic and (chemically induced) hypoxic conditions.
As 3D cell cultures offer a more representative model of the tumour microenvironment compared to cell monolayers, we assessed if the phototoxicity of Ru-TAP-PDC3 carries through from HeLa cell monolayers to MCTS. MCTS typically produce weaker luminescence signal intensity compared to cell monolayers due to their 3D volume and light scattering effects, therefore using a higher concentration of the complex can enhance visualisation and improve imaging quality. Confocal fluorescence imaging at 100 μM Ru-TAP-PDC3 confirms uptake of the complex into HeLa spheroids after 24 h incubation (Figure 5). Despite the high cytotoxicity of the complex, the overall appearance of the MCTS were healthy under imaging conditions (confirmed by lack of DRAQ7 uptake) suggesting the cytotoxic effects occurring within the MCTS are not apparent during imaging. For MCTS toxicity studies, the HeLa spheroids were ≥500 μm in size and appear to have developed a and necrotic core (Figure S29). While conventionally, the hypoxic zones within MCTS would contribute to diminished oxygen availability and thus lower efficacy of Ru-TAP-PDC3, it appears the complex did not penetrate throughout the entire spheroid (Figure S26). It is important also to note that as the emission intensity of Ru-TAP-PDC3 is reduced when bound to DNA, some uptake may not be easily visualised using confocal microscopy. As a result, it is not possible to be certain if this penetration depth limits the phototoxicity of the complex. The penetration depth of the LED light through the MCTS may also impact the light IC50 of the complex, resulting in a higher light IC50 value of 23±3.31 μM in HeLa MCTS at 5 J/cm2 (470 nm) compared to cell monolayers. Notably, Ru-TAP-PDC3 is far more dark toxic toward MCTS than cell monolayers since this value constitutes the denominator in the PI value a much lower PI value of 1.6 was observed for the spheroids. Control studies with untreated HeLa cells at 15 J/cm2 (2×7.5 J/cm2) indicated this irradiation dose was toxic to the MCTS, so this limited phototoxicity studies to low light fluence. The significant increase in the dark IC50 value in MCTS compared to cell monolayers (>200 μM) may be a result of their layered structure and lower number of proliferating cells, i.e. cells in MCTS may struggle to recover from Ru-TAP-PDC3 penetration in comparison to the actively proliferating cell monolayers. The difference in PI values between cell monolayer and MCTS studies highlights the importance of 3D cell studies. Differences in the penetration or toxicity patterns of luminescent probes have been reported previously.49, 70 It is important to note that IC50 and PI values are not the only indicators of phototoxic potential reported for spheroid studies of this nature. For example, Liu et al. demonstrated the phototherapeutic capacity of their ruthenium drug, RuAzNM (PI=8.3 at 2×6 J/cm2, 465 nm), in HepG2 liver cancer MCTS using growth curves.71 Further, Raza et al. studied the live/dead (propidium iodide) cell response to light and changes in cell morphology in C8161 human melanoma MCTS with their ruthenium TAP complex, [{Ru(TAP)2}2(tpphz)]4+.50 These studies show that although IC50 values are informative in MCTS, the phototherapeutic potential can be further investigated through a variety of additional studies such as measuring MCTS growth or morphological changes over time.
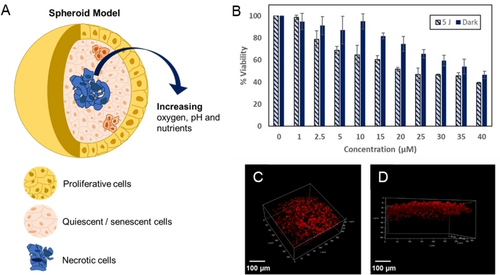
(A) Graphic of a 3D spheroid, (B) viability of HeLa MCTS treated with varying concentrations of Ru-TAP-PDC3 for 24 h and irradiated at a total dose of 5 J/cm2 compared to control MCTS kept in the dark. (C) and (D) show 3D reconstruction images of Ru-TAP-PDC3 in a live HeLa spheroid (100 μM, 24 h). Scale bars measure 100 μm.
Conclusions
We present one of the first examples of a phototherapeutic directed toward G-quadruplex mitochondrial DNA. The complex, Ru-TAP-PDC3, combines the high affinity G-quadruplex ligand, Phen-DC3 with Ru(II)TAP centre to drive PCET with DNA through both O2 dependent and O2 independent pathways.
The complex showed high affinity for mitoG4s with preference over dsDNA and was found to readily permeate the cell membrane. Ru-TAP-PDC3 preferentially accumulates in the mitochondria of HeLa cells where immunolabelling with anti-G4 antibody, BG4, confirms it associates with mitochondrial G4s. In 2-D cell culture it is non-toxic in the dark with IC50 values>200 μM in both HeLa and HEK-293 cells, but under photoirradiation it exhibits an exceptional phototoxicity index (PI) of >89 under low light conditions (5 J/cm2) and >160 at 15 J/cm2, evident in notable loss of ΔΨm, mtDNA depletion and ultimately apoptosis upon irradiation at 470 nm. Under hypoxic conditions in HeLa cells Ru-TAP-PDC3 maintained its phototherapeutic potential, although PI was reduced from >160 to >13, under 15 J/cm2 fluence. HeLa MCTS studies showed a decreased PI value of 1.6, which was attributed to poor penetration of the complex through the MCTS core. Overall, the results suggest that Ru-TAP-PDC3 is a great candidate for phototherapy and can be activated under both normoxic and hypoxic cellular conditions and more broadly that mitoG4s are an important potential target for phototherapy. Performance can be improved by applying reliable delivery approaches to maximise tissue penetration and mitochondrial targeting.
Acknowledgments
L.H. and T.E.K. gratefully acknowledge Science Foundation Ireland under grant [19/FFP/6428] and the Irish Research Council for funding under Government of Ireland Postgraduate Scholarship GOIPG/2019/2426. R.C.C. and T.E.K. gratefully acknowledge Science Foundation Ireland (SFI) for funding under grant no. 18/EPSRC-CDT/3585, and the Engineering and Physical Sciences Research Council (EPSRC) under grant no. EP/S023321. The authors thank the DJEI/DES/SFI/HEA Irish Centre for High-End Computing (ICHEC) for the provision of computational facilities. Open Access funding provided by IReL.
Conflict of Interests
The authors declare no conflict of interest.
Open Research
Data Availability Statement
The data that support the findings of this study are available from the corresponding author upon reasonable request.


