Phase Transition Engineering of Host Perovskite toward Optimal Exsolution-facilitated Catalysts for Carbon Dioxide Electrolysis
Graphical Abstract
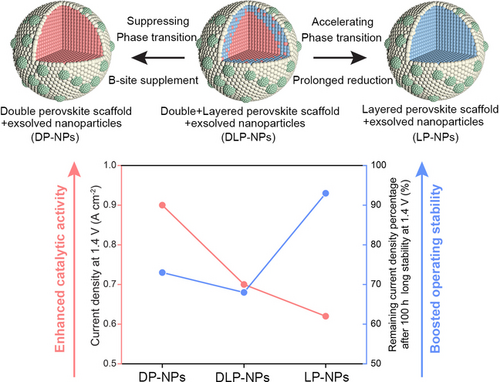
We have implemented a set of strategies to precisely control the phase evolution of host perovskite without compromising exsolution. Using carbon dioxide electrolysis as an example, we demonstrated how regulating phase structure can enhance the activity and stability of exsolved perovskites, emphasizing the importance of phase evolution control in catalytic chemistry occurring on perovskites with exsolution.
Abstract
The in situ exsolution technique of nanoparticles has brought new opportunities for the utilization of perovskite-based catalysts in solid oxide cells. However, the lack of control over the structural evolution of host perovskites during the promotion of exsolution has restricted the architectural exploitation of exsolution-facilitated perovskites. In this study, we strategically broke the long-standing trade-off phenomenon between promoted exsolution and suppressed phase transition via B-site supplement, thus broadening the scope of exsolution-facilitated perovskite materials. Using carbon dioxide electrolysis as an illustrative case study, we demonstrate that the catalytic activity and stability of perovskites with exsolved nanoparticles (P-eNs) can be selectively enhanced by regulating the explicit phase of host perovskites, accentuating the critical role of the architectures of perovskite scaffold in catalytic reactions occurring on P-eNs. The concept demonstrated could potentially pave the way for designing the advanced exsolution-facilitated P-eNs materials and unveiling a wide range of catalytic chemistry taking place on P-eNs.
Introduction
Perovskites with exsolved nanoparticles (P-eNs) have been extensively used as the electrocatalysts in solid oxide cells for energy conversion and storage.1-4 In recent years, significant efforts have been made to modify the size, density and composition of exsolved nanoparticles,5-10 thereby improving the catalytic activity of P-eNs.11 However, the perovskite scaffold, which plays a crucial role in extending the surface triple phase boundary and preserving the highly active sites, has received relatively little attention.12, 13 It is worth noting that the promoted exsolution of nanoparticles is at the cost of consuming the perovskite scaffold, the continuous stripping of reducible B-site cations and lattice oxygen from the host perovskites would result in an inadvertent structural reconstruction,14-17 even lead to the unintentional phase transformation in cases where the exsolution exceeds a critical threshold.18-20 This limits the full exploitation of the heterogeneous architectures on exsolution-facilitated perovskites and also, limits our current understanding on how the phase transformation of the perovskite scaffold affects the catalytic performances of P-eNs.
One of the key points in addressing the aforementioned concerns is controlling the phase evolution of perovskite substrate while facilitating exsolution,12, 21 however, there remains a scarcity of effective and straightforward methods to suppress phase transition without compromising exsolution.22 In addition, the lack of systematic investigation on the electrolysis processes on P-eNs with diverse nanoparticle support hinders the in-depth understanding of the role of perovskite scaffold in electrocatalysis.18, 23 Only by overcoming these two challenges can we more effectively design P-eNs materials for a wide range of reactions.
In this study, we have identified a set of strategies for controlling the phase evolution of the host perovskite without compromising exsolution on the perovskite Sr2Fe1.2Ni0.3Mo0.5O6-δ (SFN3M). In particular, the trade-off between promoting exsolution of Fe−Ni nanoparticles and preserving phase structure of host perovskite has been broken by a B-site supplement strategy (Scheme 1), thus broadening the scope of exsolution-facilitated perovskite. Using carbon dioxide (CO2) electrolysis in solid oxide electrolysis cell (SOEC) as an illustrative case study, we have demonstrated that the catalytic activity and stability of P-eNs can be selectively enhanced by controlling the phase evolution of host perovskites from double perovskite (DP) to layered perovskite (LP) structure. Combining the experimental and theoretical results, we reveal that the intentional manipulation of perovskite architectures can optimize the surface chemical environment and strengthen the surface-bulk interactions, thus dominating the cathode kinetics in response to the applied voltages and even altering the rate-limiting step. In addition, we propose two structural factors: structural stability of host perovskite itself and the concentration of the reducible B-site cations for predicting the robustness of P-eNs for CO2 electrolysis. The methodology of precisely regulating the architectures of host perovskite can offer the insights into the exsolution-facilitated P-eNs design for various electrocatalytic reactions and contribute to the comprehensive understanding of catalytic mechanisms occurring on P-eNs-based materials.
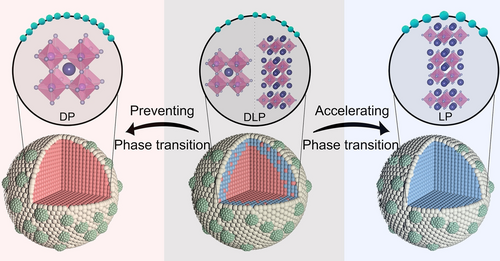
Design scheme of the Sr2Fe1.2Ni0.3Mo0.5O6-δ-based exsolution-facilitated P-eNs with a pure double perovskite (DP), a pure layered perovskite (LP) and their composite perovskite (DLP) as scaffolds, respectively. (In the 3D models, the red area represents DP structure, the blue area represents LP structure, the light green area represents Fe−Ni nanoparticles. In the 2D models, the purple spheres represent A-site atoms Sr, the pink spheres represent B-site atoms Fe/Ni/Mo, the gray spheres represent oxygen atoms, and the green spheres represent exsolved Fe−Ni alloy nanoparticles).
Results and Discussion
Figure S1 shows that the crystalline structure of SFN3M presents a pattern corresponding to DP-typed Sr2FeMoO6 (PDF#00-060-0459), while the LP-typed Sr3FeMoO6.5 (PDF#00-052-1715) as an emerging phase can be probed after reduction at 850 °C for 2 h (SFN3M-red-2h).5, 24 Secondary electron-scanning transmission electron microscopy (SE-STEM) and STEM with energy-dispersive X-ray spectroscopy (STEM-EDS) results confirm the formation of Fe−Ni alloy on the surface of SFN3M-red-2h (Figure S2), demonstrating that a composite substrate composed of DP and LP with the exsolved Fe−Ni alloy nanoparticles (DLP-NPs) has been well-constructed (Figure 1a(i)). By prolonging the reduction duration of SFN3M to 10 h at 850 °C (SFN3M-red-10h), the stripping of reducing cations continued, and a state of near-complete phase transition has thus been attained. (Figures 1a(iii) and S3). On the contrary, to eliminate the compromise between the promotion of exsolution and inhibition of phase transition, we incorporated the redox-stable Fe ions into the host perovskite by ion exchange assisted exsolution, to enhance the structural stability of perovskite scaffold.12 X-ray diffraction (XRD) spectra of SFN3M loaded with various amounts of guest Fe (SFN3M+ Fe-red-2h, =0.5, 0.8, 1.2, where is the molar ratio of guest Fe/host Ni) after reduction reveal that the phase evolution into the LP has been gradually mitigated with increased Fe loading (Figure S4), and the DP structure is well preserved without any indication of the LP phase when =1.2 (Figure 1a(ii)). By tracking the phase evolution of parent perovskite throughout the reduction process of SFN3M+1.2Fe-red-2h (Figure 1b), we probed SrMoO4 phase at 400 °C. It implies that the ion exchange has initiated at this temperature because the incorporation of foreign Fe ions into the B-site vacancies of perovskite substrate would result in the formation of Sr2Fe1.5Mo0.5O6 (SFM) in the local area, which leads to the detachment of SrMoO4 phase at the relatively lower reducing temperatures.25 Further temperature ramping would cause more severe reducing conditions where SrMoO4 could completely redissolve back into the SFM lattice at 800 °C. Therefore, the well-preserved pure double perovskite substrate on SFN3M+1.2Fe-red-2h can be ascribed to the structural reinforcement of perovskite scaffold by B-site supplement with external Fe source.
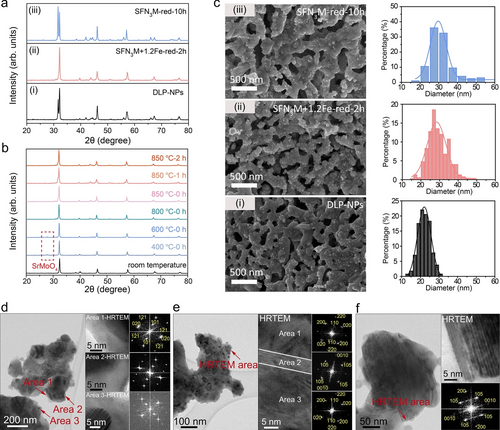
Construction of three P-eNs. a) XRD patterns of three P-eNs (DLP-NPs, SFN3M+1.2Fe-red-2h, SFN3M-red-10h). b) Ex situ XRD patterns of SFN3M+1.2Fe after reduction at different temperatures and time. c) SEM images of microstructures and size distribution histograms of the exsolved nanoparticles on DLP-NPs (black color), SFN3M+1.2Fe-red-2h (pink color) and SFN3M-red-10 h (blue color). d)–f) High resolution Environmental transmission electron microscope (HRTEM) images and the corresponding electron diffraction patterns of d) DP-NPs, e) DLP-NPs and f) LP-NPs, respectively.
Filed emission-scanning electron microscopy (FE-SEM) and STEM-EDS results substantiate that the Fe−Ni alloy nanoparticles, characterized by a larger size and increased population, have been evenly anchored on the surface of SFN3M+1.2Fe-red-2h via a thermodynamically favorable ion-swapping process (Figures 1c(i, ii) and S5).12, 26 However, as a result of the extended exsolution and Ostwald ripening, the exsolved Fe−Ni nanoparticles exhibit the larger size and less population on the surface of SFN3M-red-10h (Figures 1c(i, iii) and S5).5, 27, 28 Furthermore, Fe/Ni ratios of exsolved nanoparticles on SFN3M+1.2Fe-red-2h and SFN3M-red-10h are 2.72 and 1.29, respectively, higher than 0.67 on DLP-NPs (Figures S2, S6 and Table S1). Based on the characterization presented thus far, we can draw the conclusion that DP-NPs (simplified from SFN3M+1.2Fe-red-2h) and LP-NPs (simplified from SFN3M-red-10h) have been successfully constructed. Upon the examination of perovskite matrix using the high resolution TEM (HRTEM), only DP-typed Sr2FeMoO6 structure can be captured from the indexation of the diffractograms of DP-NPs (Figure 1d). However, for DLP-NPs, the HRTEM images of the randomly selected substrate reveal that the lattice structures of Areas 1 and 3 correspond to the DP structure, while that of Area 2 belongs to the LP-typed Sr3FeMoO6.5 structure (Figure 1e), where the existence of a streak in this diffractogram along c* indicates the formation of a stacking superstructure along the c axis. Close check of Area 3 reveals that LP-typed structure can be found as well (Figure S7). Judging by the sizes of these streaks, we postulate that they are at an early growth stage and by contrast, the LP-dominated areas are readily observed on the substrate of LP-NPs from the HRTEM image (Figure 1f).
To substantiate the significance of structural regulation of perovskite scaffold on the electrocatalytic performances of P-eNs, we applied all P-eNs in the CO2 electrolysis process, where CO2 adsorption is the first and crucial step. We first conducted Fourier transforming infrared spectroscopy (FTIR) and CO2 temperature programmed desorption (CO2-TPD) experiments on all P-eNs to understand the effect of the phase architecture of perovskite substrate on the surface CO2 adsorption capacity.29-31 The FTIR spectra of all P-eNs at 600 °C show that LP-NPs displays the strongest CO2 chemisorption with a bandwidth of 1300–1550 cm−1 at 600 °C (Figure S8).29 It is in good agreement with the results from the CO2-TPD experiments, where LP-NPs exhibits the strongest chemical desorption peak at 550 °C (Figure 2a). As the temperature of the CO2-TPD experiment increases to 850 °C, a more intensive chemical desorption peak with the onset temperatures of 760, 655 and 687 °C appears for DP-NPs, DLP-NPs and LP-NPs. It indicates that the surface of DP-NPs is the most favorable for CO2 adsorption at the operating temperatures above 800 °C. The X-ray photoelectron spectroscopy (XPS) results of O 1s illustrate that the concentration of chemisorbed oxygen species (O22−/O−, at the binding energy of ≈531 eV) is the highest for LP-NPs,32, 33 reaching 72 %, followed by DP-NPs with 59 % and DLP-NPs with 55 % (Figures 2b, S9 and Table S2). It demonstrates that the surface of the LP-NPs features the highest concentration of CO2 chemisorption sites, yet it does not exhibit the strongest desorption performance in CO2-TPD results (Figure 2b). This suggests that the surface concentration of oxygen vacancies ( ) cannot be directly correlated with the CO2 adsorption performance of P-eNs. With the observation of two distinct chemical desorption peaks in all CO2-TPD profiles, we propose that there are two CO2 adsorption scenarios occurring on the surface of P-eNs due to the different chemical environments of , either on the isolated or on the adjacent to the exsolved nanoparticles.
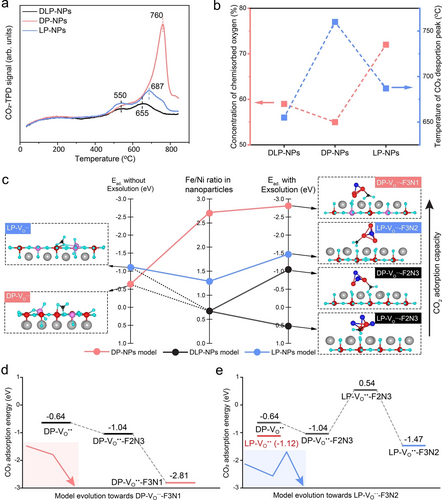
CO2 surface adsorption capacity and surface electronic structures of all P-eNs. a) CO2-TPD results of DP-NPs, DLP-NPs and LP-NPs up to 850 °C. b) Relationship between surface concentration of chemisorbed oxygen and temperature of CO2 desorption peak among three P-eNs. c) DFT-based CO2 surface adsorption configurations and energies ( ) on DP- , LP- , DP- -F2N3, DP- -F3N1, LP- -F2N3 and LP- -F3N2 models, and the Fe/Ni ratio in exsolved nanoparticles. In these DFT models, the grey balls represent Sr atoms, the red balls represent Fe atoms, the dark blue balls represent Ni atoms, the pink balls represent Mo atoms, the light blue balls represent O atoms. Change in with model evolution toward d) DP- -F3N1 and e) LP- -F3N2.
Density functional theory (DFT) was performed to investigate the various CO2 adsorption scenarios by calculating the CO2 adsorption energies ( ) (Figures S11 and S12). In the cases of SFM-based DP and LP with the presence of one on the surface (DP- and LP- ), the CO2 adsorption with a bidentate carbonate configuration at the of DP- and LP- is the most stable, the calculated were −0.64 and −1.12 eV (Figure 2c), demonstrating that SFN3M-based LP structure is more favorable for CO2 chemisorption without exsolution. For the other cases involving exsolved nanoparticles, it shows that the most stable configurations for CO2 adsorption on all the models exist in the form of the C atom of CO2 bound with a Fe atom from the Fe−Ni cluster, with an O ion attached to an adjacent of the perovskite substrate (Figures 2c and S13). DP-NPs model (DP- -F3N1) displays the most robust adsorption, with an of −2.81 eV, followed by −1.47 eV for LP-NPs model (LP- -F3N2) and finally, −1.04 and 0.54 eV for DLP-NPs models. We can find that the well-preserved DP structure results in a boosted CO2 adsorption during the evolution of the model from DP- to DP- -F3N1 with increasing Fe content in the nanoparticles (Figure 2d). Conversely, during the model evolution towards LP- -F3N2, the phase transition on the DLP-NPs models leads to an increase in from −1.04 to 0.54 eV, until the Fe/Ni ratio reaches 3 : 2, where the of LP- -F3N2 becomes slightly negative compared to that of LP- (Figure 2e). These findings indicate that DP-typed substrate is more favorable for CO2 adsorption at the adjacent to the exsolved nanoparticles compared to the LP-typed substrate.
All P-eNs were mixed with pure oxygen ion conductor Gd-doped ceria (GDC) to fabricate the cathode materials to evaluate their catalytic activities for CO2 electrolysis at 850 °C. The well-assembled SOECs (P-eNs-GDC|GDC|YSZ|GDC|(La0.6Sr0.4)0.95Co0.2Fe0.8O3-δ-GDC) were denoted as P-eNs-GDC for simplicity (Figure S14). Figure 3a presents the current density-voltage ( –V) curves of all SOECs, the order of under identical conditions is as follows: DP-NPs-GDC>DLP-NPs-GDC>LP-NPs-GDC. To track the electrode kinetics as a function of voltage, we extract the polarization resistance (Rp) of all SOECs from the electrochemical impedance spectroscopy (EIS) with the equivalent circuit LR(QHRH)(QLRL) (Figures 3b, S15 and Table S3).34 The smallest Rp of DP-NPs-GDC at all the monitored voltages confirms that DP-NPs-GDC exhibits the highest catalytic activity over a broad range of voltages. For DLP-NPs-GDC and LP-NPs-GDC with the nearly overlapping EIS curves, the voltage of 1.4 V appears to be a turning point, where LP-NPs-GDC exhibits the larger Rp at or below 1.4 V, while DLP-NPs-GDC demonstrates the larger Rp above 1.4 V. The simulated distribution of relaxation times (DRT) results from EIS data illustrate that LP-NPs-GDC exhibits a slightly larger integral area of P2 peak (charge transfer) than DLP-NPs-GDC at all tracked voltages, while the sizes of P3 peak (CO2 adsorption and activation) areas switch from DLP-NPs-GDC<LP-NPs-GDC to DLP-NPs-GDC>LP-NPs-GDC when the voltage increases from 1.4 to 1.6 V (Figures 3c and S16).35, 36 Considering the better adsorption behavior of LP-NPs than that of DLP-NPs, the smaller P3 peak of DLP-NPs-GDC below 1.6 V can be ascribed to its superior CO2 activation performance. Since electrons are involved in the activation of the surface-absorbed CO2 during electrolysis,37 all P-eNs were then subjected to the electronic conductivity tests at 850 °C. As listed in Figure 3d and Table S4, the electronic conductivities of all P-eNs follow an order of DP-NPs>DLP-NPs>LP-NPs in the atmospheres of 1 : 1 CO−CO2 and 2 : 1 CO−CO2, substantiating that CO2 activation on DLP-NPs is easier to proceed than that on LP-NPs.36, 38 XPS analysis of Fe 2p and Mo 3d with redox charge couples reveals that the higher electron conductivity of DLP-NPs than that of LP-NPs can be attributed to the more concentrated Fe2+−Fe3+ charge couples, which acts as the primary electronic pathways bridging the surface-adsorbed CO2 and SFN3M perovskite substrate (Figures 3d, S17 and Table S5).39, 40 The highest electronic conductivities of DP-NPs can thus be assigned to both the most concentrated Fe and Mo-related redox charge couples and B-site supplement in the perovskite substrate.
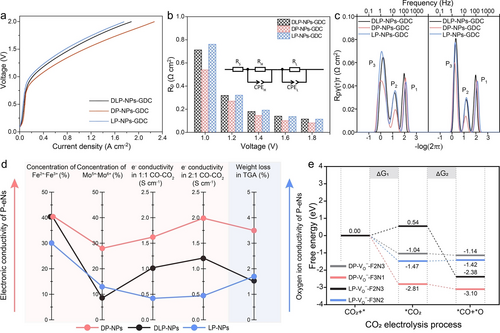
Electrochemical performances for CO2 reduction, charge transfer characterizations and free energy calculation of CO2 reduction reaction occurs on all P-eNs models. a), b) Comparison of catalytic activities among all P-eNs-GDC. a) Current density-voltage curves and b) EIS results of DP-NPs-GDC, DLP-NPs-GDC and LP-NPs-GDC for pure CO2 electrolysis at 850 °C. The inset is the equivalent circuit (LR(QHRH)(QLRL)) used to simulate the EIS data. c) DRT results of DP-NPs-GDC, DLP-NPs-GDC and LP-NPs-GDC at 1.4 and 1.6 V. (P1: oxygen ion transfer through electrolyte and oxygen evolution at anode. P2: charge transfer. P3: surface CO2 adsorption and activation). d) Index characterizations of electronic and oxygen ion conduction capability of DP-NPs, DLP-NPs and LP-NPs. e) Gibbs free energy diagram for CO2 electrolysis over DP-NPs model (DP- -F3N1), DLP-NPs models (DP- -F2N3, LP- -F2N3) and LP-NPs model (LP- -F3N2).
In addition to activating the surface-absorbed CO2,41 electrons also participate in the reduction of the surface intermediate to *CO and *O.37 The resulted CO is then desorbed from the surface, and the oxygen ions occupying are transported to the anode through a hopping mechanism.41 This process leaves new and electrons available to participate in a subsequent round of reaction. It is noteworthy that the transfer of oxygen ions, which is more difficult than electron transfer, may have a more pronounced impact on surface relaxation,42 especially at high voltages. It has been reported that there is negligible difference in oxygen ion migration between SFM-based DP and LP counterpart,3 the oxygen ion conductivities of all P-eNs catalysts are highly dependent on the concentration of . The thermogravimetric profiles of all P-eNs in a reducing atmosphere containing 5 % H2/95 % N2 reveal that the weight losses of DP-NPs and LP-NPs reach 3.5 wt. % and 1.7 wt. % after heating treatment up to 850 °C, which is higher than the weight loss of 1.5 wt. % observed in DLP-NPs (Figures 3d and S18). It suggests that the perovskite substrate of DLP-NPs has the fewest oxygen ion transfer pathways, which may lead to the slow oxygen penetration, thus resulting in sluggish surface exchange when a high voltage (≥1.6 V) is applied. It well explains the inferior CO2 surface adsorption and activation behaviors of DLP-NPs compared to that of LP-NPs observed in DRT results when the employed voltage is at or above 1.6 V.
DFT was further performed to elaborate the effects of phase transition on the CO2 electrolysis on all P-eNs. As depicted in Figure 3e, the *CO2 dissociation proved to be the rate-limiting step for DP- -F3N1 and LP- -F3N2, with the dissociation energies (ΔG2) of −0.29 and 0.05 eV, respectively. For DLP-NPs models, we can find that the energy barrier of rate-determining step of DLP-NPs changes from ΔG2 of −0.1 eV to CO2 adsorption energy (ΔG1) of 0.54 eV as the model evolves from DP- -F2N3 into LP- -F2N3, indicating that the poor CO2 adsorption resulted from the phase transition is the thermodynamic limiting factor for CO2 electrolysis taking place on DLP-NPs. And the DFT results align well with the electrochemical experimental results, demonstrating that DP-NPs exhibit a highest catalytic activity.
With a comprehensive understanding of the CO2 electrolysis on various P-eNs, we then delved into the robustness of these P-eNs for CO2 electrolysis. The 20 min short-term stability test results show that all SOECs display the satisfactory stability at 1.4 V or below (Figure 4a), after that, DLP-NPs-GDC undergoes a remarkable decay of , as opposed to the excellent stability with little attenuation of LP-NPs-GDC and the slight decay of DP-NPs-GDC. Due to the close-to-100 % Faraday efficiency of CO ( ) for all SOECs at all the examined voltages, the CO productivity of DLP-NPs-GDC reaches its peak at 1.6 V with 5.80 mL min−1 cm−2, which is lower than 9.17 and 6.71 mL min−1 cm−2 for DP-NPs-GDC and LP-NPs-GDC under the same conditions (Figure 4b). This highlights that a stable operation plays an important role in maintaining high CO yields at high voltages. We proceeded to investigate the robustness of all SOECs by 100 h long-term CO2 electrolysis tests at 1.4 V and 850 °C (Figure 4c). After excluding the first momentary data points of obtained from all SOECs, the of DLP-NPs-GDC, DP-NPs-GDC and LP-NPs-GDC decreased by 32 %, 27 %, and 7 %, with values dropping from 0.7, 0.95, and 0.63 A cm−2 to 0.48, 0.7, and 0.59 A cm−2, respectively. Unlike the monotonic decrease in the –V curves of DP-NPs-GDC and LP-NPs-GDC, DLP-NPs-GDC underwent a “degradation-activation-degradation” process, the process which has been recently proposed in our studies as the major degradation patterns of SFM-based catalysts in CO2 electrolysis at 850 °C.12 In particular, the of DLP-NPs-GDC experiences dramatic decrease in the first hour with a degradation rate of 220 mA cm−2 h−1, which is remarkably higher than 70 and 10 mA cm−2 h−1 of DP-NPs-GDC and LP-NPs-GDC (Figure S19). The post-characterization results of the cathode morphology demonstrate that severe coarsening has occurred in the exsolved nanoparticles on all perovskite substrates (Figures S20a–c), thereby ruling out the possibility that the thermal stability of the exsolved nanoparticles dominated the degradation. Meanwhile, the repeated local Raman analysis and XRD results reveal the detection of SrMoO4 and SrCO3 phases on both DLP-NPs and DP-NPs electrodes, while only SrMoO4 phase is present on the LP-NPs electrode (Figure S21). These observations suggest that perovskite scaffolds undergo varying degrees of exsolution under the synergistic effects of CO2/CO atmosphere and external voltage. As a result, diverse structural evolution occurs among the three P-eNs, including phase transition and the formation of secondary phases.
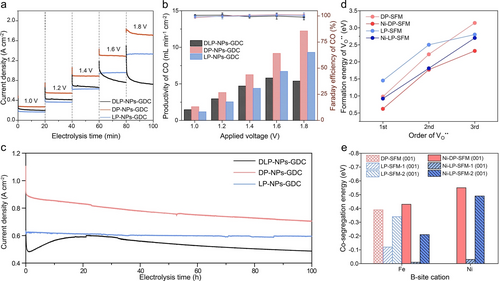
Stability performances of all SOECs and indicators of stability of P-eNs. a), b) Short-term stability tests. a) The current density response curves for the 20 min potential step chronoamperometry and b) the corresponded CO productivity (histogram) and Faraday efficiency of CO ( ) (markers) for DP-NPs-GDC, DLP-NPs-GDC and LP-NPs-GDC. c) Long-term stability performances of DP-NPs-GDC, DLP-NPs-GDC and LP-NPs-GDC at 1.4 V and 850 °C. d) Formation energy of first three oxygen vacancies ( ) on models DP-SFM, Ni-DP-SFM, LP-SFM and Ni-LP-SFM calculated by DFT. e) Co-segregation energies of Fe and Ni on slabs DP-SFM (001), Ni-DP-SFM (001), LP-SFM-1 (001), LP-SFM-2 (001), Ni-LP-SFM-1 (001) and Ni-LP-SFM-2 (001) calculated by DFT.
Given the ongoing depletion of lattice oxygen and subsequent removal of reducible cations from the perovskite substrate during the electrolysis,12, 43 DFT was adopted to examine the structural stability of different perovskite substrates by calculating the formation energy of ( ) and co-segregation energy of reducible cations ( , where M is donated as B-site cations such as Ni, Fe) (Figures 4d–e, S22, S23 and Tables S6, S7).20 Based on different structures of substrate and different degrees of reducible Ni exsolution (Figure S24), we constructed the DP models with/without Ni doping (Ni-DP-SFM/DP-SFM) and LP models with/without Ni doping (Ni-LP-SFM/LP-SFM). Figure 4d illustrates that the of the first three of the DP and LP models all show a downward trend after Ni doping, indicative of the detrimental effect of Ni doping on the stability of DP-SFM and LP-SFM.44 This is also confirmed by the lower than in Ni-DP-SFM (001) (−0.55 eV<−0.43 eV), Ni-LP-SFM-1 (001) (−0.03 eV<−0.01 eV) and Ni-LP-SFM-2 (001) (−0.49 eV<−0.21 eV) (Figure 4e). Furthermore, the and in Ni-DP-SFM (001) are more negative than those in Ni-LP-SFM-1 (001) and Ni-LP-SFM-2 (001) (Table S7). Likewise, the in DP-SFM is −0.39 eV, which is more negative than −0.12 eV of LP-SFM-1 and −0.34 eV of LP-SFM-2, demonstrating that the LP structure has the higher resistance to reduction compared to the DP structure. It elucidates the excellent stability performance of LP at high voltages owing to the perovskite scaffold‘s predominant composition of LP structure and relatively less residual Ni. However, in DLP-NPs with a composite substrate, the DP part still retains a relatively higher amount of reducible Ni, which can be readily released under the harsh reduction conditions during CO2 electrolysis, thereby leading to the rapid degradation in the initial stage of the long-term stability test. When the newly born nanoparticles emerge on the surface, the catalytic performance initially shows a recovery, but eventually deteriorates once the surface chemistry reaches equilibrium with the electrolytic environments. In contrast, although DP-NPs still retain almost intact DP structure, the relatively redox-stable Fe cations occupying B-sites significantly reduce the rate of lattice oxygen loss and B-site cation exsolution, resulting in a relatively milder decline during the initial stages. The agreement between experimental and theoretical calculations suggests that the structural stability of host perovskite itself and the reducibility of B-site cations can serve as the indicators to predict the stability performance of P-eNs under CO2 electrolysis conditions.
Conclusion
We have fine-regulated the phase structures of host perovskite while promoting exsolution and emphasized the essential role of architectures of perovskite scaffold in the catalytic reactions occurring on exsolution-facilitated P-eNs. In particular, the compromise between facilitated exsolution and well-preserved perovskite scaffold has been broken by implementing the B-site supplement on SFN3M. Applying P-eNs with different perovskite compositions for CO2 electrolysis, we found that DP-NPs exhibits the highest catalytic activity, while LP-NPs demonstrates remarkable stability performance over a broad range of voltages. Our experimental and theoretical findings reveal that the structural regulation of host perovskite plays a crucial role in optimizing the surface chemical environments, strengthening the surface-bulk interaction, thus dominating the cathode kinetics in response to the applied voltages and even altering the rate-limiting step. The outputs of this study also emphasize the considerations of inherent structural stability of host perovskite and the concentration of the reducible B-site cations in predicting the robustness of P-eNs for CO2 electrolysis. Our approach employs the unique regulation strategies of the host perovskites and a combined experimental-theoretical method and therefore, is able to offer a roadmap for the rational design and evaluation of novel exsolution-promoted P-eNs catalysts for a variety of applications and to gain a comprehensive understanding of the reaction mechanisms in P-eNs based catalysts.
Experimental Section
Detailed experimental and calculation procedures, Supporting Figures and Tables can be found in Supporting Information.
Acknowledgments
This work is supported by the Natural Sciences and Engineering Research Council (NSERC) of Canada, Discovery Grant (GRPIN-2016-05494) and Strategic Research Projects of Alberta Innovates Technology Futures (#G2016000655). As a part of the University of Alberta's Future Energy Systems research initiative, this research was made possible in part thanks to the funding from the Canada First Research Excellence Fund (CFREF-2015-00001).
Conflict of interest
The authors declare no conflict of interest.
Open Research
Data Availability Statement
The data that support the findings of this study are available from the corresponding author upon reasonable request.


