A Hydrogel Microneedle Assay Combined with Nucleic Acid Probes for On-Site Detection of Small Molecules and Proteins
Abstract
Point-of-care testing (POCT) of clinical biomarkers is critical to health monitoring and timely treatment, yet biosensing assays capable of detecting biomarkers without the need for costly external equipment and reagents are limited. Blood-based assays are, specifically, challenging as blood collection is invasive and follow-upprocessing is required. Here, we report a versatile assay that employs hydrogel microneedles (HMNs) to extract interstitial fluid (ISF), in a minimally invasive manner integrated with graphene oxide-nucleic acid (GO.NA)-based fluorescence biosensor to sense the biomarkers of interest in situ. The HMN-GO.NA assay is supplemented with a portable detector, enabling a complete POCT procedure. Our system could successfully measure four clinically important biomarkers (glucose, uric acid (UA), insulin, and serotonin) ex vivo, in addition, to accurately detecting glucose and UA in vivo.
Introduction
Point-of-care testing (POCT) is conducted close to the site of patient care and enables rapid turn-around of results, fast clinical actions, and patient-centered care.1, 2 POCT is growing rapidly, and its global market is expected to be worth $68.6 billion USD by 2030.2 To date, blood has been used as the main source of biomarkers; however, blood processing is labor-intensive, time-consuming, invasive, and requires sophisticated clinical equipment, making its use for POCT less favorable.3 A promising alternative to blood is interstitial fluid (ISF) which is originated from blood and fills the extracellular space; thus, it has common biomarkers with plasma/serum while also containing biomarkers unique to the local cells.4 A wide range of metabolites, including amino acids, lipids, and nucleotides as well as protein biomarkers can be detected in ISF,5-11 emphasizing the potential of ISF for health monitoring.9
Microneedle (MN)-based biosensors have recently emerged as a promising approach for interrogating the ISF. They enable minimally invasive penetration through the skin for ISF access and sensing.12 Off-MN and on-MN biosensors have been reported to analyze biomarkers of clinical relevance within the ISF.8, 12-14 The off-MN assays collect the ISF for subsequent off-site analysis.13, 15 The on-MN refers to the assays in which the recognition elements are integrated, thus enabling on-needle analysis. On-MN assays eliminate the need for sample processing and can be employed for POCT applications. For instance, solid MNs coated with specific enzymes have been developed to electrochemically detect glucose and ketone bodies- the cause of diabetic ketoacidosis.16, 17 A flexible MN coated with enzymes has also been reported to simultaneously detect glucose, uric acid, and cholesterol, but has not been tested for in vivo applications.18 In a recent paper, solid MNs integrated with miniaturized electronics have been used to enzymatically detect glucose, alcohol, and lactate in human subjects.19 Despite these significant achievements, enzyme-based biomarker detection is limited to a narrow range of biomarkers for which an enzyme is available. Non-enzymatic MNs immobilized with antibodies or aptamers have also been reported, but their detection strategy relies on adding extra reagents, complicating their POCT applications.14, 20
We have recently reported an optical hydrogel microneedle (HMN) biosensor capable of capturing and detecting analytes on-MN in a reagent-less fashion and without the need for external processing.21 The HMN biosensor was achieved by immobilizing a complex of the aptamer-displacement strand into the matrix of HMNs.21 Despite its ability for on-MN and reagent-less target detection, certain drawbacks exist with displacement strand-based sensing strategy limiting the versatility. For instance, finding an appropriate displacement strand is challenging. Further, the aptamer-displacement strand should be hybridized prior to immobilization, adding extra steps to the fabrication process. The POCT application of the developed HMN biosensor was also limited by its need for a sophisticated and bulky fluorescence microscope.
To establish a versatile design and simplify the fabrication process, we developed an HMN assay that incorporates graphene oxide-nucleic acid (GO.NA) optical sensors for POCT and sensing. The GO.NA optical sensor consists of GO nanosheets conjugated to fluorophore-modified nucleic acid (NA), in which GO acts as a quencher. Single-stranded NAs have a high affinity for binding to GO; therefore, in the absence of the biomarker of interest, the NAs are tightly bound to GO; in turn, their fluorophore tag is quenched.22-24 However, in the presence of a specific biomarker, the NAs bind to their target, inducing a conformational change that distances the fluorophore tag from GO, leading to fluorescence recovery and generation of an optical signal.22-24 GO also acts as a substrate for NA immobilization; therefore, protects the NA from degradation and prevents any potential NA release from HMN-GO.NA. To enable microscope-free patch visualization and optical measurements for POCT, we developed a miniaturized smartphone-based system that captures fluorescence images of the HMN-GO.NA patches (Scheme 1A and 1B), which are then analyzed using freely available software.
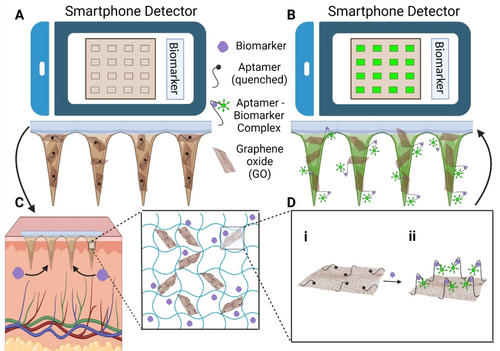
(A) To set the baseline fluorescence level; F0, the HMN-GO.NA patches are first imaged with a smartphone-based detector before skin application, and (B) another time after skin application when the level of fluorescence is increased; F. The response is then defined as the (F-F0)/F0. (C) The HMN-GO.NA patches are applied on the skin, where they extract the ISF along with the presented biomarkers. The inset illustrates the network of the HMN after ISF extraction, which is composed of the MeHA hydrogel, GO.NA (the sensing component), and the extracted biomarkers. (D) Schematic illustrating the sensing mechanism of GO.NA; (i) before and (ii) after the formation of the aptamer-biomarker complex.
We proved the versatility of our HMN-GO.NA by employing four different aptamers and detecting a range of different analytes, including small molecules and proteins. Aptamers were employed to detect glucose, uric acid (UA), serotonin, and insulin. The four biomarkers detected here all hold great clinical importance for health monitoring. POCT of glucose and insulin level has long been known as critical for diabetes management and mitigation of insulin over/under dose.25, 26 Changes in UA level are an important diagnosis and prognosis factor in many multifactorial disorders like metabolic syndrome, and hypertension.27, 28 Serotonin is critical in regulating certain body functions such as mood, sleep, digestion, wound healing, bone health, and blood clotting, making its monitoring highly valuable.29-35 The HMN-GO.NA showed precise analyte detection both in vitro and ex vivo. Further, the assay performance was examined for the detection of glucose and UA in vivo in diabetic rat models.
Results and Discussion
HMN-GO.NA Sensing Strategy
To make HMN-GO.NA assay, a mixture of hydrogel and GO.NA was prepared followed by MN fabrication using the micro-molding technique. The fabricated HMNs consist of an array of 10X10 needles with a height of 850 μm that can penetrate the skin, reach the epidermis, and extract ISF in a minimally invasive manner.21 The NA probes are conjugated to a fluorophore tag (Cy3) and act as the biorecognition element, while GO acts as the quencher element, quenching the fluorophore tag in the absence of the biomarkers.22, 23, 32 As illustrated in Scheme 1C, upon HMN-GO.NA insertion into the skin, ISF along with its biomarkers, is diffused into the needles. In the presence of the specific biomarker, an aptamer-biomarker complex is formed, inducing a conformational change that dissociates the fluorophore tag from GO, leading to fluorophore light-up (Scheme 1Di). The increase in the fluorescence signal is proportional to the concentration of target analytes, allowing accurate analyte quantification.
HMN-GO.NA Fabrication and Characterization
To fabricate the HMN-GO.NA patches, hyaluronic acid (HA), a highly biocompatible polymer, was modified with methacrylic anhydride to form the methacrylate HA (MeHA) as the hydrogel backbone.21, 33, 34 Similar to our previous work, the methacrylation process was confirmed via chemical techniques (Figure S1).
MeHA has been previously used to fabricate HMN arrays and has displayed a high degree of swelling, allowing increased ISF extraction and improved sensing.21, 33 HMN-GO.NA was then fabricated using a two-layer micro-molding technique. The first layer or the needle region is composed of a mixture of the hydrogel and GO.NA which was injected into the mold (Figure 1A). The second layer or the base is composed of the hydrogel mixture which was added after the needle region was semi-dry (Figure 1A). The two-layer fabrication technique prevents possible base deformation and enables the formation of sharper needle tips.35 We have tested different ratios of GO to NA and found that 100 μg ml−1 of GO per 2 μM NA resulted in the optimum signal, therefore, we used this ratio for the rest of the experiments (Figure S2).
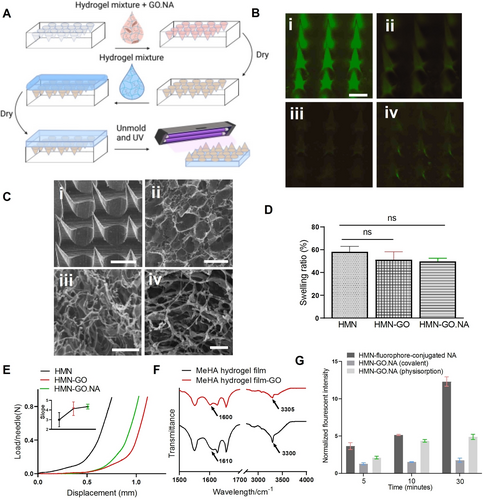
(A) Schematic showing the fabrication process for the two-layered HMN-GO.NA. (B) Fluorescence images of the (i) HMN with fluorophore-conjugated NA, (ii) HMN with aptamer-displacement strand, (iii) HMN with covalent GO.NA, and (iv) HMN with physiosorbed GO.NA (scale bar=250 μm, and lookup table (LUT)=100–10000). (C) SEM images of the (i) HMN-GO.NA array (scale bar=250 μm), (ii) MeHA hydrogel film, (iii) MeHA hydrogel film with GO, and (iv) MeHA hydrogel film with GO.NA (scale bars=20 μm), for pore size analysis. (D) The analyzed swelling ratio percentage for HMN, HMN-GO, and HMN-GO.NA shows no significant difference (ns) after the addition of GO and GO.NA to the HMN patch (P<0.05). At least four patches were tested per condition, and the error bars show the standard error of the mean (SEM). (E) The obtained mechanical strength for HMN-only, HMN-GO, and HMN-GO.NA patches with the inset showing the slope of the force-displacement Figure for each patch. Two patches were tested per condition, and the error bar shows SEM. (F) FTIR was performed on the MeHA hydrogel film and MeHA hydrogel film with GO. (G) The NA release experiment which assesses the release of fluorophore-tagged NA with and without conjugation to GO. To account for any possible changes that hydrogel release might cause, all the obtained fluorescence signals were normalized to the fluorescence signal of PBS that was incubated with the hydrogel-only patches. Each experiment was performed three times, and the error bars represent SEM.
We investigated two approaches to make the GO.NA complex: covalent bonding and physical adsorption (physisorption).22, 23, 32 In the covalent bonding approach, a covalent bond was formed between the carboxyl groups of GO and the amine groups on the amine-modified NA strands. In the physisorption approach, pi-pi stacking and hydrophobic interactions between the NA rings and the hexagonally shaped carbons in GO produced the strongly conjugated GO.NA complex.32 To assess the fluorescence quenching capability of GO, we fabricated HMN-GO.NA where NA was linked to GO either covalently or physically and imaged the HMN patches using a microscope. In the absence of GO or a quencher-conjugated displacement strand, a strong fluorescence signal was observed (Figure 1Bi). The fluorescence signal was significantly reduced when a quencher-conjugated displacement strand (our previously established technique21) was employed (Figure 1Bii). HMN patches with covalently-(Figure 1Biii) or physically- (Figure 1Biv) linked GO.NA also demonstrated a very low fluorescence signal, highlighting the quenching capability of GO. Knowing that GO can effectively quench the fluorescence, we investigated the characteristics of our HMN-GO.NA patches. Scanning electron microscopy (SEM) was performed to visualize HMN-GO.NA array with pyramid-shaped, sharp needles, which are essential for effective skin penetration (Figure 1Ci). Next, we studied the pore size of hydrogel, hydrogel-GO, and hydrogel-GO.NA films using SEM imaging (Figure 1C). The three sample types showed similar pore sizes with an average pore diameter of 7.8, 7.2, and 8 μm for the hydrogel, hydrogel with GO, and hydrogel with GO.NA, respectively.
Next to explore the effect of GO and GO.NA on the swelling capability of HMN, HMN patches without and with GO and GO.NA were fabricated, and their swelling ratios were measured. The addition of GO did not have a significant effect on HMN swelling ratio as the HMN, HMN-GO, and HMN-GO.NA showed close swelling ratios of 58 %, 50 %, and 51 %, respectively (Figure 1D). To crosslink the HMN-GO.NA patches, a longer UV radiation of 40 minutes was required, which led to a lower swelling ratio (58 %) compared to our previously developed HMN patch (98 %).21 Next, the mechanical strength of the HMN, HMN-GO, and HMN-GO.NA patches were evaluated (Figure 1E). HMN patches incorporated with GO, showed slightly higher slopes compared with patches without GO, indicating that the addition of GO has slightly increased the mechanical strength. Next, to characterize the interaction between GO and MeHA hydrogel network, we performed Fourier Transform Infrared (FTIR) spectroscopy on hydrogel and hydrogel-GO films (Figure 1F). GO contains carboxyl groups which can form hydrogen bonds with the amine and/or hydroxyl groups present in the MeHA hydrogel.36-38 The N−H stretching vibration peak at 3300 in the hydrogel-only spectrum has been shifted to 3305 in the hydrogel-GO spectrum, indicating the formation of hydrogen bonds.36 The N−H bending peak at 1610 has been also shifted to 1600 in the hydrogel-GO spectrum, further suggesting hydrogen bond formation between GO and the MeHA hydrogel.37, 39 Even though GO is highly biocompatible,40, 41 the formation of hydrogen bonds between GO and MeHA hydrogel ensured effective GO entrapment inside the MNs and relieved any concern regarding potential GO release. We also studied the release of NA from HMN-GO.NA patches (Figure 1G). Fluorophore-conjugated adenosine three phosphates (ATP) aptamer was used as the NA biorecognition element to construct HMN patches incorporated with covalently and physically linked GO.NA complex. A control sample was also fabricated by simply mixing MeHA hydrogel with NA without incorporation of GO (HMN-NA). The fabricated HMN patches were immersed in a buffer solution containing a high concentration of ATP for 5, 10, and 30 minutes, after which the patches were withdrawn, and the buffer was analyzed for the presence of the fluorophore-modified NA. As Figure 1G shows, the observed fluorescence intensity for HMN-NA patches has increased by increasing the incubation time, demonstrating the release of NA into buffer solution due to the loose entrapment of NA in the hydrogel matrix. However, such an increase was not observed for the covalent HMN-GO.NA patches. The physiosorbed HMN-GO.NA patches also showed an increase in the fluorescence signal as a result of longer incubation time, yet their increase was much lower than that of HMN-NA. These observations suggest that GO plays an important role in retaining the NA inside HMN patches; thereby, preventing NA release and maintaining functional biomarker sensing.
Ex Vivo Validation of HMN-GO.NA Assay for Biomarker Detection
After studying the characteristics of HMN-GO.NA, we moved forward and tested its performance for the detection of a diverse range of clinically important biomarkers. The fabricated HMN-GO.NA patches were tested using agarose gel (Figures S3, and S4) and porcine skins (Figure 2) loaded with different concentrations of the targets of interest. We also ensured that our method could properly infuse the target biomarkers into the porcine skin pieces (Figure S5). Figure 2A represents the sensing mechanism of our HMN-GO.NA patches using a selected UA aptamer42 and UA as the target biomarker. To establish the shortest duration for patch insertion, we applied the HMN-GO.UA.aptamer patches on porcine skins containing 200 and 500 μM of UA for 2, 5, and 10 minutes (Figure 2B). 5 minutes appeared to be the optimum timespan for HMN-GO.NA action, as the highest response and response difference (between 200 and 500 μM UA) was observed after the 5-minutes application. It is noteworthy that such an increase in the fluorescence response was not observed when the control patches of HMN, HMN-GO, and HMN-UA.aptamer were applied on skins with 200 and 500 μM UA (Figure S6). For the rest of the ex vivo analysis, the HMN-GO.NA patches were applied for 5 minutes. The physiological range of UA in healthy adults is between 90–360 μM in women and 150–420 μM in men, with concentrations higher than upper limits considered hyperuricemia.27, 43 Importantly, our HMN-GO.UA.aptamer patches could detect UA in both physiological and hyperuricemia ranges with a limit of detection (LOD) of 32 μM (Figure 2C). HMN-GO.UA selectivity was also tested by applying the patch on skins loaded with non-specific targets (Figure 2C, inset). Neither of the non-specific targets could produce a response, attesting to the specificity of HMN-GO.UA.aptamer for UA. HMN-GO.NA aptamer was also employed for glucose detection using a selected glucose aptamer.44 Fasting glucose level ranges between 3.9 to 10 mM in healthy adults, with glucose levels lower than 3.9 mM and higher than 10 mM being considered hypoglycemia and hyperglycemia, respectively.45 Our HMN assay could accurately detect glucose at its biological and, more importantly, pathological level with a LOD of 2.1 mM (Figure 2D). The HMN-GO.Glucose.aptamer also displayed excellent selectivity for glucose (Figure 2D, inset). We next studied the detection of insulin, a small protein hormone secreted from the pancreas with a physiological range of 0.1–3 nM, using our assay.26 The response of our HMN-GO.Insulin.aptamer patches linearly correlated with insulin concentration showing a LOD of 1.3 μM (Figure 2E). HMN-GO.Insulin.aptamer patches were also selective towards insulin as no increase in fluorescence response was observed following patch exposure to non-specific targets (Figure 2E, inset). We also employed the HMN.GO.NA assay for detection of serotonin, a small-molecule neurotransmitter involved in numerous physiological processes in both central and peripheral nervous systems.29 Serotonin exists in the biological range of 0.5–1.6 μM, while higher concentrations require further clinical investigation.29-31, 46 Conventional techniques for serotonin detection mainly rely on liquid chromatography-electrochemical detection (HPLC-ECD), which is cumbersome and requires extensive sample pre-treatment.47, 48 Our HMN-GO.Serotonin.aptamer could accurately identify serotonin levels from 0.5–4 μM with a LOD of 0.1 μM (Figure 2F); offering an effective solution for POCT of serotonin. Moreover, the obtained LOD using our method is comparable to the LOD of current common-practice methods for serotonin detection.47 The HMN-GO.Serotonin.aptamer also was highly selective towards detecting serotonin (Figure 2F, Inset).
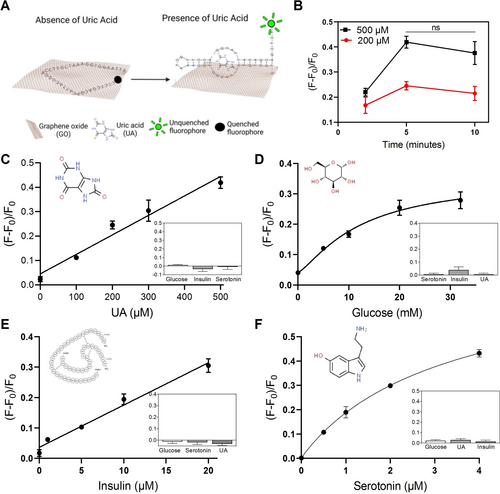
(A) Schematic figure illustrating the mechanism through which GO.UA.aptamer detects UA. (B) The HMN-GO.UA.aptamer patches were applied on porcine skins containing 200 and 500 μM UA and the fluorescence response was measured after 2, 5, and 10 minutes of patch insertion. The difference in fluorescence response between 5- and 10-minutes groups was not statistically significant (ns, P=0.4 and<0.05) (C) HMN-GO.UA.aptamer, (D) HMN-GO.Glucose.aptamer, (E) HMN-GO.Insulin.aptamer, and (F) HMN-GO.Serotonin.aptamer were applied on porcine skin containing different concentrations of UA, glucose, insulin, and serotonin, respectively. The insets show the response of the respective patches to non-specific targets. Each experiment was performed three times and the error bars represent SEM.
A Portable, Smartphone-based Detector for POCT Setting
Although fluorescence-based biosensors provide high sensitivity, a major obstacle is their need for sophisticated and bulky microscope imagers that can trigger the fluorophores, capture the emitted signal, and visualize the images. To address this challenge and enable our HMN-GO.NA assay for POCT, we developed a miniaturized optic system and fluorescence imagers consisting of a laser diode, microscopic objective, and filter as shown in Figure 3A. The HMN-GO.NA patch was excited by a 532 nm laser diode, corresponding to the excitation of Cy3 fluorophore, and the fluorescence signal was collected by the smartphone detector through a 4X objective lens and a bandpass filter.
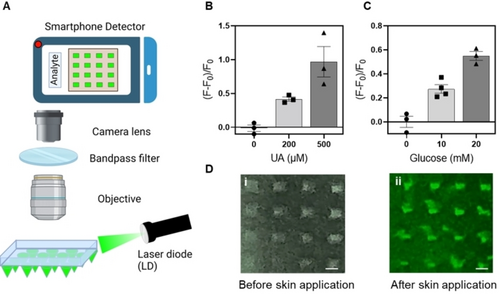
(A) Schematic showing the components of the developed smartphone-based detector. Representative Figures showing the fluorescence response[(F-F0)/F0] of (B) HMN-GO.UA.aptamer and (C) HMN-GO.Glucose.aptamer patches following insertion in porcine skins containing different concentrations of their respective biomarkers. The observed background fluorescence was subtracted from F and F0. At least three patches were tested per condition and the error bars represent SEM. (D) Representative images captured by smartphone-based detector i) before and ii) after applying the HMN-GO.UA.aptamer on porcine skin containing 200 μM UA (scale bar=200 μm).
HMN-GO.NA patches for UA and glucose detection were prepared, applied on porcine skins containing different concentrations of the targets, and visualized using the developed miniaturized optic system. An increased fluorescence response was observed when higher concentrations of UA and glucose were present in the porcine skin (Figure 3B and 3 C), indicating that the developed optic system can effectively capture images and successfully replace the previously used fluorescence microscope. An example of an imaged HMN-GO.UA.aptamer patch before and after introduction to 200 μM UA is presented in Figure 3D, showing a brighter image after the UA capture.
In Vivo UA and Glucose Detection in an Animal Model of Diabetes
The levels of serum uric acid (SUA) are found to be elevated in diabetic patients.49 The elevated SUA level acts as a key risk factor predicting diabetic-associated complications like stroke, kidney deterioration, and fatty liver disease,50, 51 necessitating SUA monitoring in diabetic patients in addition to glucose. The available at-home UA test kits like HumaSensplus and UASure require fingertip punctures, which hinders frequent UA measurement and discomforts patients- specifically children and elderly patients raising the need for a painless and convenient UA test.52-54 Further, the at-home UA test kits like UASure, cannot detect UA concentrations lower than 170 μM limiting their application for the diagnosis of certain diseases associated with low UA levels.53, 55 Importantly, 100 % of the SUA can also be found in ISF, qualifying MN-based detection as a highly promising method.56, 57 We, thus, employed our HMN-GO.NA patches to identify the levels of UA and glucose in diabetic rats. We have previously shown that MeHA-HMNs are biocompatible,21 yet to confirm that our patches would not evoke any inflammatory response, we performed hematoxylin and eosin (H&E) staining on the parts of skin that were treated with HMN patches (Figure S7). The control skin with no patch application and the skin treated with HMNs did not show significant differences in histological appearance, confirming the safe and inflammation-free nature of HMN-GO.NA (Figure S7). The workflow for HMN-GO.NA application is illustrated in Figure 4A. HMN-GO.NA patches were imaged prior to insertion, then applied on the rat's dorsal skin for 5 minutes, followed by another round of imaging (Figure 4A). Successful penetration of HMN-GO.NA patches were confirmed, by performing H&E staining and visualizing the needle's cavity with an approximate depth of 800 μm (Figure 4B). Knowing our MN can effectively penetrate, we moved to identify the level of UA and glucose presented in ISF (ISF UA and ISF glucose). Figure 4C represents HMN-GO.NA patches after being applied on rats with low (Figure 4C, i), medium (Figure 4C, ii), and high (Figure 4C, iii) levels of UA (top) or glucose (bottom). Figure 4D shows the results of UA measurement using HMN-GO.UA.aptamer assay. Concurrent with needle application, blood was collected from rat tail, and SUA levels were analyzed using a benchmark enzymatic test.58 The observed levels of ISF UA (obtained with HMN-GO.UA aptamer) closely matched the SUA level in individual rats indicating the accuracy of HMN-GO.UA.aptamer assay in detecting UA. Furthermore, consistent with previous findings, diabetic rats (with an average UA level of 287 μM) had higher UA than healthy rats (with an average UA level of 228 μM).59 HMN- GO.Glucose.aptamer was used to detect fluctuating levels of glucose in the ISF of diabetic rats (Figure 4E). To vary the glucose level in blood and ISF, the diabetic rats were first fasted for 5 hours which caused a significant increase in their glucose level, followed by insulin injection which gradually decreased the glucose level, and a subsequent feeding which again increased glucose levels.
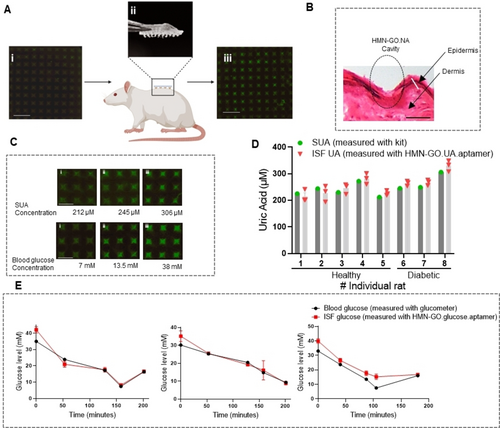
(A) The schematic illustrating the workflow for applying HMN-GO.NA on rats. Pictures representing the (i) fluorescent image of an HMN-GO.NA before patch application, (ii) a phone photo after patch application, and (iii) a fluorescent image after insertion into the dorsal skin of a rat (scale bar=1 mm, LUT=100–400). (B) Histology image showing a needles cavity (scale bar=500 μm). (C) Fluorescence images representing the HMN-GO.UA.aptamer (top, LUT=100–500) and HMN-GO.Glucose.aptamer (bottom, LUT=200–1200) after insertion on rats with different serum UA and blood glucose levels (scale bars=500 μM). (D) Figure representing the mean SUA levels measured with an enzymatic kit next to the mean ISF UA levels measured with HMN-GO.UA.aptamer in 10 rats. Three patches were tested per rat, and error bars represent SEM. (E) Figures representing the mean of blood glucose levels tested with a glucometer along with the mean of ISF glucose levels measured with HMN-GO.Glucose.aptamer patches in three individual rats. At least three patches were applied per condition and error bars represent the SEM.
The ISF glucose levels (detected with HMN-GO.Glucose.aptamer) were correlated with blood glucose levels (measured with a glucometer) in all three rats, further confirming the accuracy of HMN-GO.NA patches to detect biomarkers in live animals.
Conclusion
Herein, we integrated the GO.NA optical sensor with HMN arrays; thereby, leveraging the competitive advantages that HMN offers (such as biocompatibility, easy fabrication process, and increased ISF extraction) as well as the versatility of the GO.NA sensors. We tested our HMN-GO.NA assay for testing four clinically important biomarkers: UA, glucose, serotonin, and insulin. Additionally, the HMN-GO.NA design was compatible with both covalent and physisorbed GO.NA conjugates, further advancing the versatility of our technique. It is noteworthy to mention that the HMN-GO.Glucose.aptamer is not meant to replace the currently available continuous glucose measurement methods, but more to stand as an example showing the versatility of HMN-GO.NA design. Moreover, a smartphone-based detector was designed and assembled, which allows the HMN-GO.NA implementation at POCT setting. Compared to other POCT biosensors (Table S1) the HMN-GO.NA demonstrates a low-cost, rapid, and accurate approach for monitoring a diverse range of biomarkers.
The HMN-GO.NA assay holds great promise for POCT applications and is adaptable for the simultaneous detection of multiple biomarkers. Especially, simultaneous detection of glucose, insulin, and UA which is crucial for high-quality diabetic management.60 To enable our HMN-GO.Insulin.aptamer for detecting insulin at the physiological ranges (0.05–3 nM), the obtained LOD for insulin should decrease by 1000 folds which can be achieved by employing strategies like utilizing an insulin aptamer with higher affinity to insulin, amplifying the fluorescence signal by using a stronger fluorophore like quantum dots,61 and retaining the insulin target in the detection cycle for several rounds by degrading the insulin-bound aptamer.62 Our HMN-GO.Serotonin.aptamer assay also demonstrated a great capacity for accurately detecting serotonin at biological and pathological ranges, justifying further validations in animal models and human subjects. Overall, the HMN-GO.NA patches along with portable and automated imagers would pave the way for next-generation POCT health management.
Acknowledgments
We appreciate Dr. Amin GhavamiNejad's guidance with experimental design and data interpretation. The authors would also like to acknowledge the Giga-to-Nano Center for use of their electron microscopy, the Center for Advanced Materials Joining for their assistance with mechanical strength testing, Waterloo Advanced Technology laboratory for use of their FTIR machine, and the University of Waterloo's animal facility and staff for help with the rat experiments. This work has been financially supported by the University of Waterloo Start-up Funding, Natural Science and Engineering Research Council of Canada Discovery Grant, and the Ontario Graduate Scholarship.
Conflict of interest
The authors declare no conflict of interest.
Open Research
Data Availability Statement
The data that support the findings of this study are available from the corresponding author upon reasonable request.


