Monitoring the Reversibility of GPCR Signaling by Combining Photochromic Ligands with Label-free Impedance Analysis
Abstract
G protein-coupled cell surface receptors (GPCR) trigger complex intracellular signaling cascades upon agonist binding. Classic pharmacological assays provide information about binding affinities, activation or blockade at different stages of the signaling cascade, but real time dynamics and reversibility of these processes remain often disguised. We show that combining photochromic NPY receptor ligands, which can be toggled in their receptor activation ability by irradiation with light of different wavelengths, with whole cell label-free impedance assays allows observing the cell response to receptor activation and its reversibility over time. The concept demonstrated on NPY receptors may be well applicable to many other GPCRs providing a deeper insight into the time course of intracellular signaling processes.
Introduction
G protein-coupled receptors (GPCRs) form the largest family of cell surface receptors across the human body. Genes for about 800 GPCRs have been identified in the human genome.1 They all share the topology of seven transmembrane helices within one polypeptide chain, an extracellular ligand binding domain and an intracellular domain that transmits receptor activation by extracellular ligands into intracellular signaling cascades. Considering the number of genes encoding GPCRs, it is not surprising that they are involved in countless physiological processes and their dysfunction has been assigned to a myriad of severe diseases, such as diabetes, allergies, depression and certain forms of cancer.1, 2 Accordingly, GPCRs are among the most highly addressed drug targets. Approximately 35 % of all prescription pharmaceuticals on the market address GPCRs as agonists, antagonists or allosteric modulators.1
Since the identification of new and selective ligands for specific GPCRs has gained an ever-growing interest in basic research and in drug discovery, a variety of different tools and assays has been developed that monitor or manipulate the complex interplay between ligand, receptor, and associated signal transduction either directly or indirectly. Most of them are used in combination with cultured cells (over)expressing the receptor of interest. A direct approach uses radio- or fluorescence-labeled ligands to determine the dissociation constants without disclosing whether the receptor is activated or blocked. Others probe the activation of the receptor at different stages along the intracellular signaling cascades by quantifying (second) messenger molecules, protein activation or protein-protein interactions. Genetically encoded sensors as used in protein fragment complementation or reporter gene assays have expanded the GPCR toolbox significantly in recent years. The entire pool of assays is reviewed comprehensively elsewhere.3 Most of them rely on optical readouts either via photo- or bioluminescence. A label-free alternative to monitor GPCR activation in cultured cells is based on non-invasive electrochemical impedance measurements. In these assays the cells expressing the receptor are grown on planar gold-film electrodes and the impedance is recorded at designated AC frequencies as a function of time. Due to the insulating nature of the plasma membrane, adherent cells force the current to flow around the cell bodies so that impedance readings become very sensitive to cell shape changes below the resolution of conventional light microscopy. It has been shown in the past that these kinds of impedance readings are well-suited to follow GPCR activation in real time4 even for cells with endogenous receptor expression.5 Since the measurement integrates over the entire cell body, it benefits from intracellular amplification along the signaling cascades and it is often found to be more sensitive than assays reporting on molecular interactions confined to the receptor.6 On the downside, cell shape changes are a very generic indicator of receptor activation so that the missing molecular specificity needs to be compensated for by proper assay workflows and stringent controls.
Time-resolved impedance measurements become particularly valuable when light is used to control the activity of photochromic GPCR ligands as it avoids any interference with optical readouts. Photochromic GPCR ligands exist as two isomers that may get reversibly converted into each other upon irradiation with light of appropriate wavelengths. Ideally the two isomers provide significantly different pharmacological activities (photopharmacology) so that a precise spatio-temporal control of receptor activation becomes accessible and paves the way for external control of receptor function. Photochromic ligands have been described for a variety of GPCRs already.7 The analysis of their pharmacological activity is either conducted by endpoint assays, reporting only on receptor activation at a single time point, or by kinetic assays, continuously monitoring the status of receptor activation.8 Only the latter are capable of following any light-induced in situ switching between isomers to reveal a potential reversibility of receptor activation. Only two kinetic assays have proven their suitability for real time monitoring of photoswitching: (i) electrophysiology of G-protein coupled rectifying potassium channels (GIRK) and (ii) genetically encoded Ca2+/cAMP sensors. The former are applicable to those GPCRs controlling GIRK ion channels, the latter inevitably require genetic engineering.8 Impedance analysis as performed in the current manuscript is not limited by these restrictions and may pave the way to real-time monitoring of photoswitchable GPCR ligands even for cells with endogenous expression of a wide variety of GPCRs.
This study presents a collection of cyclic peptide ligands targeting the Y4 receptor, a member of the neuropeptide Y receptor family. Two different photochromic moieties based on azobenzene or arylazopyrazole have been introduced into the macrocycles providing E/Z isomers of each ligand. The ligands have been fully characterized with respect to their dissociation constants and agonistic activity by established assays. Impedance-based monitoring of the signaling cascade in Chinese Hamster Ovary (CHO) cells overexpressing the Y4 receptor confirmed the individual agonistic activities of the isomers. Moreover, time-resolved impedance profiles disclose the cellular response to receptor activation during single or repeated switching from one isomer to the other and vice versa. Our experiments suggest that isomerization of the ligands occurs in the binding pockets of the receptor rather than binding/dissociation of different isomers after photo-induced isomerization in the bulk phase. Combining photochromic GPCR ligands with real time and label-free impedance analysis significantly expands the available toolbox to directly monitor the dynamics and reversibility of GPCR signaling even in wild-type cells.
Results and Discussion
The design of the photochromic ligands is based on the previously reported cyclic peptide UR-AK86c (1, Figure 1), showing picomolar affinity to the NPY Y4R.9 In this work we synthesized photoswitchable derivatives based on this structure by incorporating the photochromic moiety either into the cyclic part or as an amino acid side chain. MD-simulations in the previous report showed that the cyclic part of UR-AK86c points towards the outside of the binding pocket giving this part of the molecule more space and freedom to alter its structure. Moreover, the cyclic part provides rigidity to the molecule so that replacing the succinyl residue by a photoswitch that is integrated in the macrocycle, should induce a big change in the overall structure of the molecule upon switching. Along this strategy we incorporated azobenzenes and arylazopyrazoles with different substitution patterns to create a small library of different ring sizes. As another modification strategy Tyr6 was replaced by the aromatic photoswitchable amino acid 16. Since the linear C-terminus of the molecule reaches deep into the binding pocket, a change in structure could either lead to a complete loss of affinity or to a big difference between the two isomers. Furthermore, we have previously reported that a replacement of Leu4 by Trp led to antagonism of the linear precursor and partial agonism for the cyclic product.9 Therefore, 16 was incorporated in this position as well to see if switching could change the mode of action (agonism vs antagonism). As a third modification we replaced Tyr2 by 16. When Tyr2 was replaced by Trp in the original structure no affinity loss was observed, changes in that position seem to be well tolerated.9
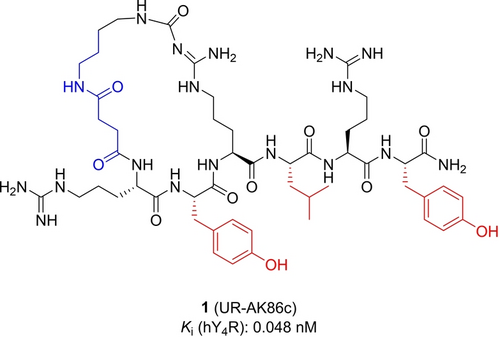
Structure of 1, incorporation sites for photochromic moieties 6–8, 12 and 13 are shown in blue and for 16 in red.
Synthesis
To replace the succinyl moiety in the macrocycle, azobenzenes 6–8 and arylazopyrazoles 12 and 13 were prepared according to Scheme 1 providing a free and a protected carboxylic acid and an individual substitution pattern. Therefore, the nitroso compounds 2, 3, 9 and 10 were synthesized from the corresponding amines in an oxidation reaction with oxone by a literature known reaction.10 The Mills reaction that yielded the azobenzenes 6–8 was conducted in acetic acid over four days. For the preparation of the arylazopyrazoles 12 and 13, the Mills reaction was performed under alkaline conditions in dichloromethane and triethylamine. The unnatural photoswitchable amino acid 16 was also synthesized in a Mills reaction. Starting from the amino-phenylalanine 15 and nitrosobenzene 14 the photoswitchable derivative of Fmoc-protected phenylalanine 16 was synthesized11 (Scheme 1).
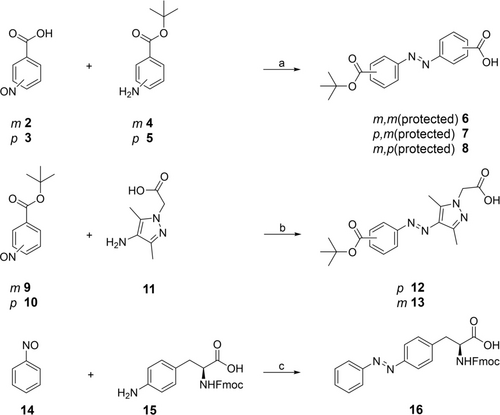
Synthesis of photoswitches 6–8, 12, 13 and 16. Reagents and conditions: a) acetic acid, rt, 4 d, 22–25 %, b) CH2Cl2, NEt3, rt, 3 h, 10–57 %, c) acetic acid, rt, 24 h, 59 %.
The Nω-carbamoylated arginine building blocks 17 and 18 (Figure 2), containing a dimethylene (17) or a tetramethylene (18) spacer, were used in solid phase peptide synthesis (SPPS) to incorporate the respective Nω-carbamoylated arginine in position 3 in the hexapeptides.

Structures of Nω-carbamoylated arginine building blocks 17 and 18.
The original linker length of four carbons in 1 was shortened to two carbons for the incorporation of 6–8, 12 and 13 to keep the ring size closer to the parental compound 1. Compounds 17 and 18 were synthesized using previously reported procedures (for detailed conditions see Scheme S1, Supporting Information).12
The linear peptides 19–26, precursors for the cyclic peptides 27–34, were synthesized by Fmoc strategy SPPS using a Sieber amide resin (Scheme 2). 2-(1H-Benzotriazol-1-yl)-1,1,3,3-tetramethyluronium hexafluorophosphate (HBTU)/hydroxyl-benzotriazole (HOBt)/N,N-diisopropylethylamine (DIPEA) were used as coupling reagents for the natural amino acids as well as for the unnatural amino acids 16–18. For the photoswitches 6–8, 12 and 13, benzotriazol-1-yloxytripyrrolidino-phosphonium hexafluorophosphate (PyBOP)/HOBt/DIPEA were used as coupling reagents. The natural amino acids were used in a “double coupling”, i.e. every coupling step was performed twice in 5-fold excess for 45 min at 35 °C. A “single coupling”, using 3-fold excess overnight at 35 °C, was applied for the unnatural amino acids 16–18 and photoswitches 6–8, 12 and 13. After the final Fmoc deprotection, either of the photoswitches 6–8, 12 or 13 was coupled to the peptide. For peptides 24–26, containing the photoswitch in the amino acid side chain, the resin was treated with succinic anhydride. Cleavage from the resin was achieved using a mixture of trifluoro acetic acid (TFA)/CH2Cl2 (1 : 3), followed by side chain deprotection using TFA/CH2Cl2 (1 : 1) and purification by preparative high performance liquid chromatography (HPLC) yielding the linear peptides 19–26. The cyclization of the peptides was conducted in solution not exceeding a peptide concentration of 5 mM. The amide bond was formed between the primary amine of the Nω-carbamoylated arginine residue and the carboxylic acid of the N-terminally attached photoswitchable moiety (19–23) or the N-terminal succinyl group (24–26). PyBOP/HOBt/DIPEA was used as coupling reagent and the reaction mixture was stirred at room temperature for 24 h. Purification of the final peptides was performed using preparative HPLC.
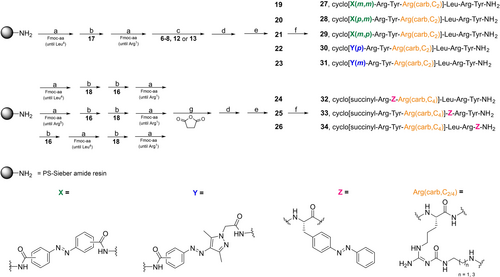
Solid phase peptide synthesis. Reagents and conditions: a) peptide elongation, amino acid coupling: Fmoc-amino acid/HBTU/HOBt/DIPEA (5/5/4.9/10 equiv), DMF/NMP (8 : 2), 35 °C, 2×45 min (“double coupling”), Fmoc deprotection: 20 % piperidine in DMF/NMP (8 : 2), rt, 2×10 min; b) 16–18/HBTU/HOBt/DIPEA (3/3/2.95/6 equiv), DMF/NMP (8 : 2), 35 °C, 24 h (“single coupling”), Fmoc deprotection: 20 % piperidine in DMF/NMP (8 : 2), rt, 2×10 min; c) photoswitches 6–8, 12 or 13/PyBOP/HOBt/DIPEA (3/3/3/6 equiv), DMF/NMP (8 : 2), 35 °C, 24 h (“single coupling”), Fmoc deprotection: 20 % piperidine in DMF/NMP (8 : 2), rt, 2×10 min; d) cleavage from resin: TFA/CH2Cl2 (1 : 3), rt, 2×20 min; e) TFA/CH2Cl2 (1 : 1), rt, 5 h, overall yields of linear peptides 19–26 after SPPS: 7–24 %; f) PyBOP/HOBt/DIPEA (5/5/10 equiv), DMF/NMP (8 : 2), rt, 24 h, cyclization yields: 30–76 %; g) succinic anhydride/DIPEA (10/10 equiv), DMF/NMP (8 : 2), 35 °C, 30 min.
Photophysical Characterization
The photophysical properties of all cyclic photoswitchable peptides and the linear peptides 20 and 25 were investigated in aqueous buffer to mimic physiological conditions. All compounds were switched to their cis-isomers by irradiation at a wavelength of 340 nm. Whereas compounds 20, 25, 27–29 and 32–34, containing an azobenzene, were switched back to the trans- isomer at a wavelength of 455 nm, arylazopyrazoles 30 and 31 were switched back to trans by using light of a longer wavelength (528 nm) due to a slightly red-shifted absorption spectrum. Switching back and forth over several cycles showed that the compounds exhibit high fatigue resistance. No decomposition or side reactions seem to take place upon irradiation (Figure 3).
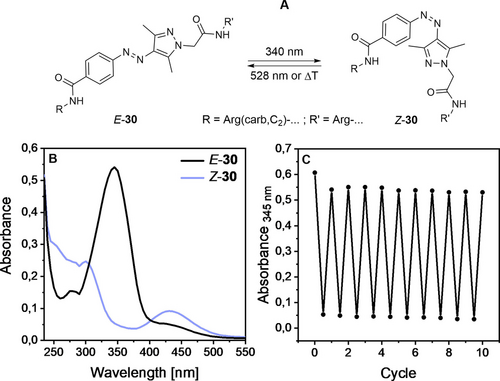
A) Light-induced cis/trans-photoisomerization of 30. B) UV/Vis spectra of both isomers of compound 30. C) Cycle performance of compound 30 (20 μM) in HEPES buffer (25 mM HEPES, 2.5 mM CaCl2, 1 mM MgCl2, pH 7.4) +0.1 % DMSO. This compound is shown here as a representative. Compounds 20, 25 and 27–34 showed similar photophysical properties (see Supporting Information).
Furthermore, all photochromic peptides showed high photostationary states (PSS) when switched to the cis-isomer (≥90 %). Switching back to the trans-isomer worked best for the arylazopyrazoles 30 and 31 with around 90 % PSS. Peptides 20, 25, 27–29 and 32–34 containing an azobenzene moiety could be switched back to the trans-isomer with 74–88 % PSS.
Thermal half-lives (t1/2), describing how fast the thermal back-isomerization to the trans-isomer occurs, ranged between 7.5 and 52 days, which ensures that during the time required for the biological assays back-isomerization is not significant. Table 1 summarizes the photophysical properties of the photoswitchable peptides.
Compound |
t1/2 [d][b] |
PSS (E→Z) [%][c] |
PSS (Z→E) [%][c] |
|---|---|---|---|
20 |
13.3 |
90 |
88 |
27 |
31.5 |
95 |
74 |
28 |
23.7 |
92 |
78 |
29 |
22.6 |
91 |
78 |
30 |
7.5 |
94 |
91 |
31 |
52 |
97 |
90 |
32 |
9.3 |
92 |
78 |
25 |
9.4 |
94 |
81 |
33 |
12.6 |
94 |
78 |
34 |
9.8 |
94 |
75 |
- [a] All cis-isomers were obtained by irradiation with 340 nm. Irradiation using (i) 455 nm yielded the trans-isomers of 20, 25, 27–29, 32–34 or (ii) 528 nm providing the trans-isomers of 30 and 31. Concentration: 20 μM in HEPES buffer (25 mM HEPES, 2.5 mM CaCl2, 1 mM MgCl2, pH 7.4) +0.1 % DMSO. [b] Half-life of the thermal back-isomerization to the trans-isomer determined after pre-irradiation to saturation with 340 nm. [c] PSS determination was done by analytical HPLC using UV/Vis detection at the individual isosbestic points.
Ligand Binding and Functional Characterization
In the following paragraphs the term “E-isomer” refers to the ratio of isomers after irradiating the compound in thermal equilibrium with 455 nm and 528 nm, respectively. The term “Z-isomer” refers to the ratio of isomers after irradiating the compound in thermal equilibrium with 340 nm. To ensure the optimized ratio for each individual isomer in binding studies and functional assays, the compounds were always pre-illuminated with the corresponding wavelength. Assays were performed immediately afterwards in the dark.
The photochromic peptides 20, 25 and 27–34 were investigated with respect to their Y4R binding affinity by radioligand competition binding yielding pKi values (Table 2). The incorporation of a photoswitchable moiety was well tolerated and binding affinities were still in the sub- to low-nanomolar range with 25 and 34 being the only exceptions. It was observed that for peptides 27–31, with the photoswitch integrated in the cyclic part, the Z-isomers exhibited higher Y4R affinities (lower Ki values) compared to their E-isomers. Z-27 and Z-30 showed the highest affinities, similar to the endogenous ligand human pancreatic polypeptide (hPP) and to 1. Compound 28 displayed the biggest difference between the E- and Z-isomer with an almost 10-fold difference in binding affinity (Figure 4A). In contrast, the E- and Z-isomer of its precursor 20 exhibited identical Y4R affinities. The isomers of 27, 30 and 31 exhibited seven- to eight-fold differences in Y4R binding. Selected compounds were also subjected to radioligand competition binding studies for the NPY receptor subtypes Y1, Y2 and Y5 (for details see Supporting Information Table S1) revealing a clear selectivity for the Y4R.
|
Y4R binding[a] |
Y4R agonism[b] |
|
|---|---|---|---|
pKi±SEM/Ki [nM] |
pEC50±SEM/ EC50 [nM] |
efficacy E±SEM [%] |
|
hPP |
10.02±0.06/0.10 |
8.62±0.03/2.7 |
100 |
E-20 |
9.76±0.01/0.17 |
8.11±0.06/7.8 |
77±3 |
Z-20 |
9.74±0.05/0.18 |
7.89±0.06/13 |
81±1 |
E-27 |
9.21±0.02/0.62 |
7.95±0.02/11 |
76±5 |
Z-27 |
10.04±0.05/0.09 |
8.47±0.04/3.4 |
88±3 |
E-28 |
8.37±0.04/4.3 |
7.08±0.02/84 |
62±2 |
Z-28 |
9.35±0.05/0.45 |
7.79±0.04/16 |
83±3 |
E-29 |
9.16±0.09/0.73 |
7.88±0.03/13 |
73±3 |
Z-29 |
9.86±0.02/0.14 |
8.29±0.05/5.1 |
82±1 |
E-30 |
9.31±0.06/0.50 |
8.08±0.06/8.3 |
50±3 |
Z-30 |
10.19±0.03/0.066 |
8.40±0.06/4 |
88±2 |
E-31 |
9.03±0.04/0.94 |
7.65±0.06/23 |
48±3 |
Z-31 |
9.94±0.03/0.11 |
8.21±0.02/6.3 |
75±2 |
E-32 |
9.58±0.08/0.27 |
8.09±0.06/8.2 |
82±2 |
Z-32 |
9.81±0.045/0.16 |
8.16±0.04/7 |
81±2 |
E-25 |
7.17±0.07/69 |
n.d. |
n.d. |
Z-25 |
6.61±0.09/260 |
n.d. |
n.d. |
E-33 |
8.76±0.09/1.8 |
6.70±0.13/201 |
78±9 |
Z-33 |
8.07±0.09/8.9 |
6.07±0.04/849 |
39±2 |
E-34 |
7.30±0.05/51 |
5.72±0.17/1914 |
32±2 |
Z-34 |
7.98±0.07/11 |
6.40±0.04/397 |
12±1 |
- [a] Determined by competition binding with [3H]UR-KK200 (Kd=0.67 nM,14a c=1 nM) at CHO-hY4R-mtAEQ-Gqi5 cells. [b] Determined in a miniGsi protein recruitment assay performed with HEK293T-CBRN-mGsi/Y4R-CBRC cells. Efficacies E were determined relative to the effect of 1 μM hPP. Data represent mean values from at least three independent experiments performed in triplicate (standard error of the mean (SEM) given for pKi, pEC50 and E values). n.d.: not determined.
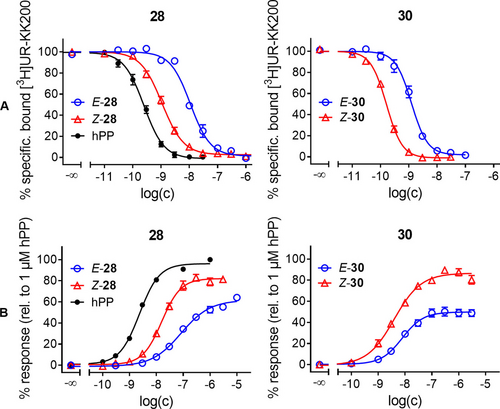
A) Radioligand displacement curves and B) Dose-response curves of hPP (black) and both isomers of 28 and 30 established from CBR miniGsi recruitment assays. For binding and dose-response curves of 20, 25, 27, 29 and 31–34 see Figures S51 and S52, Supporting Information. Data represent mean±SEM from at least three independent experiments performed in triplicate.
Moreover, the ligands were investigated in a miniGsi protein recruitment assay to study their capability of activating the Y4R. A split-luciferase-based miniGsi protein sensor was recently reported as a tool to characterize ligands for histamine receptors.13 The NanoLuciferase (NLuc) used for the histamine sensor shows a maximum emission around 470 nm. As the light emitted by NLuc may induce cis- to trans-isomerization under assay conditions for some of the ligands studied here, we developed a Y4R split-luciferase miniGsi recruitment assay based on the click beetle red luciferase (CBR) with an emission maximum around 615 nm. Due to its broad emission spectrum, partial isomerization of the photochromic Y4-peptides caused by CBR emission has to be considered. In order to keep the influence of CBR-induced photo-isomerization as low as possible, dose-response curves were established based on the maximum of the signal time courses instead of using the area under the curve (AUC). The former were observed approximately 4 to 7 minutes after agonist addition, whereas the AUC integration is typically extended beyond the signal maximum and thereby increases the impact of CBR-induced back-isomerization (see Figure S55, Supporting Information). For comparison, compound 28 was additionally investigated in a NLuc-based Y4R miniGsi recruitment assay, developed within the scope of this study. Whereas E-28 exhibited a 5-fold lower potency than Z-28 in the CBR-based miniGsi assay, the difference was less pronounced (2.5-fold) in the NLuc assay (Figure S53) indicating that NLuc-emitted light (λmax≈470 nm) may cause, to some extent, a back-isomerization from Z to E. All compounds were found to behave as partial agonists of the Y4R in the CBR-based miniGsi recruitment assay, like the parental compound 1.9 The arylazopyrazoles 30 (ΔEmax=38 %) and 31 (ΔEmax=27 %) and the peptide with the photoswitchable amino acid sidechain in position 4 (33, ΔEmax=39 %) revealed the largest differences in efficacy (Table 2). Consistent with the results found in the binding studies, Z-isomers of 27–31 were more potent than their correspondent E-isomers. In contrast, peptide 33 displayed a higher potency in its E-configuration. Whereas peptides 27–31 exhibited slightly lower potencies than the endogenous ligand hPP, 33 and 34 showed a drastically reduced potency. The differences in EC50 values between E- and Z-isomer were less pronounced than the differences in Ki values (Table 2). With a 5-fold difference in EC50 values, peptide 28 displayed the most pronounced change in potency for its two isomers, followed by 31 with an approximately 4-fold difference (34 is not considered here because of the low potency and efficacy). The discrepancies between Ki values and EC50 values may be due to the absence or presence of sodium ions in the buffer composition used for binding and functional assays, respectively, as has been discussed previously.14 In addition to miniGsi recruitment assays, the E- and Z-isomer of 28 were also studied in a Ca2+ aequorin assay, measuring intracellular calcium mobilization upon Y4R activation. In this functional assay Z-28 also proved to be more potent than E-28 by a factor of 3. However, compared to the data from the Y4R CBR miniGsi recruitment assay, the efficacies were considerably lower (cf. Figure S54, Supporting Information). Likewise, the potencies were slightly lower, which is most likely due to the strong non-equilibrium character (rapid cellular response) of the Ca2+ assay.
Impedance-Based Analysis of Y4R Activation
Both isomers of compounds 28 and 30 were analysed by time-resolved impedance measurements with respect to the response of adherent CHO cells overexpressing the Y4 receptor. These two compounds belong either to the azobenzene (28) or arylazo-pyrazole (30) family of photoswitches used in this study. In these experiments the cells were grown to confluence in 96-well plates with integrated, planar gold-film electrodes in every well. The impedance magnitude |Z| was recorded at an AC frequency of 12 kHz using non-invasive voltage amplitudes (40 mV) to induce a weak AC current in the μA range. As has been shown previously, activation of GPCR signalling cascades are readily monitored by the impedance time course that mirrors the associated changes in cell morphology.4d-5 Figure 5 summarizes a typical experiment using E-30, Z-30 (1 nM), the endogenous ligand hPP (100 nM) and a vehicle control (DMSO, 0.01 % v/v). The impedance magnitudes of the individual electrodes have been zeroed to the impedance of the cell-covered electrodes immediately before adding the agonists.
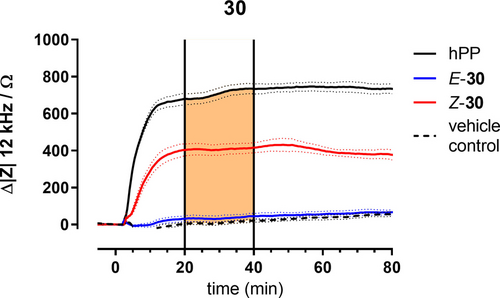
Typical impedance time courses at an AC frequency of 12 kHz along the stimulation of CHO-Y4R cells with different agonists (blue: E-30, red: Z-30, c=1.0 nM; solid black: hPP, c=100 nM, dashed black: vehicle control DMSO, 0.01 % v/v). Impedance magnitude |Z| was zeroed immediately before agonist addition. Vertical lines at t=20 min and t=40 min indicate limits of integration used to determine the area under the curve (AUC, orange box). Cells were pre-stimulated with forskolin (0.4 μM) for 30 min (not shown). Mean±SEM (n=3).
In these experiments 30 was irradiated with light of 528 nm or 340 nm to yield E-30 or Z-30, respectively, prior to cell exposure. Saturating the receptor with the endogenous ligand hPP (100 nM) induced an impedance change of approximately 650 Ω within 20 min and it remained stable within the observation time of 80 min. The corresponding DMSO control (0.01 % v/v) increased the impedance just by 20 Ω along the entire observation time. The two isomers Z-30 and E-30 showed distinctly different impedance responses when applied in 1 nM concentrations. Whereas Z-30 induced an impedance increase of approximately 400 Ω with a similar time course as hPP, E-30 was not significantly different from the DMSO control. For a more quantitative analysis we used the area under the curve (AUC) for each impedance time course in the time interval from 20 min to 40 min using the DMSO control as the lower border of integration (see orange area in Figure 5). AUC has proven to yield a more robust readout than the maximum impedance change in particular for non-monotonic time courses.6 Therefore, AUC analysis was applied to experiments conducted with increasing concentrations of both isomers of compounds 28 and 30 to reveal their individual dose-response relationships as summarized in Figure 6.
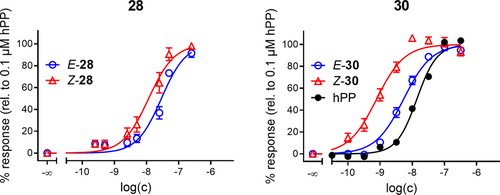
Dose-response curves of E/Z-isomers of 28 and 30 obtained by AUC calculation of impedance time courses at 12 kHz. hPP is included for comparison. Mean±SEM from at least three independent experiments performed in triplicate.
For both compounds 28 and 30, we found the Z-isomer to be more potent than the E-isomer, which is in line with the radioligand competition binding and the miniGsi recruitment assay (Table 2). pEC50 values as determined from impedance-based cell monitoring are summarized in Table 3. At saturating concentrations both compounds showed the same intrinsic activity as the endogenous ligand hPP. This phenomenon is often observed for integrative assays capturing the very end of the signalling cascade.15
|
Y4R[a] |
|---|---|
pEC50±SEM/EC50 [nM] |
|
hPP E-28 |
7.86±0.04/13 7.54±0.07/29 |
Z-28 |
7.94±0.06/12 |
E-30 |
8.27±0.03/5 |
Z-30 |
9.11±0.05/0.8 |
- [a] Determined from the time course of impedance by calculating the AUC between 20 and 40 min of exposure as illustrated in Figure 5 performed with CHO-Y4R cells. pEC50 values represent mean values from at least three independent experiments performed in triplicate.
Ki values of 28 and 30 determined from radioligand competition binding differed by a factor of approximately 10 between the isomers (E/Z). In miniGsi recruitment, this difference was less pronounced. The factor between EC50 values of the isomers was just 5 for 28 and 2 for 30. In impedance measurements 30 was found to show the bigger difference in potency between E and Z-isomers with an approximately 6-fold difference, whereas the factor for 28 was only 2.5. It is important to recognize that miniGsi-recruitment assays report on signalling events that are localized directly at the receptor (proximal) while label-free wholistic measurements like impedance analysis integrate over the entire cell body and the entire signalling cascade (distal) similar to experiments performed with entire organs.16 This integrative character together with the inherent amplification along the signalling cascade is also responsible for the fact that impedance measurements do not reveal any significant difference in efficacy for the two isomers relative to hPP in contrast to miniGsi recruitment.15b In impedance-based assays, both isomers of 28 and 30 are considered full agonists. Another result is noteworthy: in impedance-based analysis both isomers of 30 are significantly more potent than hPP. The other two assays do not report a similar behaviour. A potential explanation is functional selectivity (biased agonism).17 The concept of functional selectivity proposes that different ligands are capable of triggering different signaling cascades to different degrees upon binding to the same receptor. Whereas competition binding and G-protein recruitment assays report on molecular changes close to the receptor, impedance measurements are very distal integrating over all signaling cascades that might be involved as discussed above. As such, impedance measurements might be affected by functional selectivity whereas the other two readouts are not.
The observed impedance increase may report on two potential changes in cell morphology that are indistinguishable from the current data: (i) Strengthening of cell-cell interactions which leads to a reduced width of the intercellular cleft; (ii) enhancement of cell-matrix interactions which reduces the width of the narrow electrolyte-filled channel between lower cell membrane and electrode surface; or (iii) both. In either case, the pathways for ionic current flow are reduced which translates into an increase in impedance. Recording the impedance at a set of distinct frequencies instead of just one would allow for a clear assignment of the morphology changes18 but was not in the scope of this study.
Real-Time Monitoring of Light-Controlled Y4R Agonism
From the dose-response studies (Figure 6) the optimum concentrations for 28 (50 nM) and 30 (1 nM) were selected to perform in situ switching from one isomer to the other while the impedance is continuously monitored. Figure 7 summarizes the outcome of these in situ switching experiments for all four compounds: (A) Z-28, (B) E-28, (C) Z-30 and (D) E-30. The reader may take a look at the graphical abstract for a visualization of the experiment. For easy comparison, each graph contains the time courses of impedance for 100 nM hPP (solid black line) and the 0.01 % (v/v) DMSO vehicle control (dashed black line), which define the upper and lower limit of impedance values in this assay. Time course data for the pure isomers are given in red (Z) or blue (E). The green curve represents the isomer that was switched in situ by irradiation with the proper wavelength at the time indicated by the vertical dotted lines. When Z-28 (Figure 7A) was added to the CHO cells at time zero, impedance increased to about 80 % of the values recorded for 100 nM hPP in line with the dose-response data. Irradiating the system with 455 nm after 20 min of agonist exposure induced a sharp decrease of impedance and stabilization at values recorded for E-28 at this time point. Impedance did not change for almost 50 min indicating that the cells were equilibrated with these conditions. Subsequent irradiation with 340 nm almost 80 min after initial ligand exposure led to a pronounced increase again that does not quite reach the impedance levels of pure Z-28 but stabilized again. Repeating this sequence of light-induced isomerization yielded similar cell responses with some signs of fatigue within the reversibility of the signalling cascades or cell physiology in general as the signal changes became smaller. We take the fact that the impedance of all cell populations slightly drifted to lower values along the experiment as an indicator, that the prolonged stimulation in a buffer with a minimum of nutrients tires the cells out. In the same line, we have previously observed reduced cell responses to GPCR stimulation when we applied a cumulative dosing protocol during which the cells were sequentially exposed to increasing agonist concentrations.4e According to the in vitro characterization of the ligands, the observed phenomenon is not due to a limited reversibility of photo-induced isomerization but we cannot exclude changes in photostability in the binding pocket of the receptor. Figure 7B summarizes the opposite experiment. This time E-28 (green curve) was applied to the CHO cells before the system was irradiated with 340 nm to induce isomerization. Under these conditions impedance did not increase to values recorded for the Z-isomer at the same time but showed a minor rise that stabilized close to the values of the pure E-isomer. After the opposite in situ switching using 455 nm, the impedance dropped significantly as expected when going from Z to E and stabilized at a new steady state. When the switching cycle is repeated, the impedance increased and decreased as expected from dose-response data even though the absolute values showed some offset relative to the isomers that were exposed to light prior to the experiment. Figures 7C and D summarize similar in situ irradiation experiments for compound 30 demonstrating the reversible switching between two distinct agonistic activities in this assay monitoring the integrated cell response.
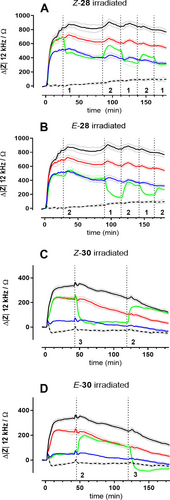
Impedance time courses at an AC frequency of 12 kHz when confluent CHO-Y4R cells were stimulated with different agonists combined with repeated in situ irradiation at wavelengths specified below. Impedance was zeroed in for the last data point prior to agonist addition. Control cells were either incubated with hPP (solid black line; c=100 nM) or DMSO (dashed black line; c=0.01 % (v/v)). The red curves represent the unperturbed Z-isomer of 28 (50 nM) and 30 (1 nM) whereas the blue curves stand for the corresponding unperturbed E-isomer. All green curves correspond to the isomer indicated in the header during light-induced in situ (re)isomerization. Times of irradiation are indicated by dashed vertical lines (=455 nm; 2=340 nm; 3=528 nm). Cells were pre-stimulated with forskolin (0.4 μM) for 30 min (not shown). Mean±SEM (n=3).
In these experiments the recorded impedance showed some drifting to lower values along the observation time as well. Since (i) the experiments were performed in serum-free buffer with a minimum of nutrients and (ii) impedance measurements are rather sensitive to morphological changes coupled to energy metabolism, we assign the impedance drift to assay conditions and length of experiment. In control experiments we carefully ensured that there neither is an impact of the light itself (i) on resting cells (ii) nor on cells stimulated with a non-photochromic ligand (iii) nor on the electrodes that may lead to misinterpretations. We therefore performed in situ irradiation with the intensities and wavelengths as used for photoswitching with confluent CHO-Y4R cells on the electrodes, but in absence of the photochromic ligands (Figure S59A, Supporting Information) or in presence of the ligands but without cells on the electrodes (Figure S59B, Supporting Information). In a third control experiment cells were stimulated with the non-photochromic endogenous ligand hPP and irradiated with light of the different wavelengths (Figure S59C, Supporting Information). In either case, impedance recordings did not show any significant change upon irradiation with light of wavelength 340 nm, 455 nm or 528 nm. Neither the cells without photochromic ligands nor the ligands without cells induced any measurable impedance shift upon light irradiation supporting our understanding that the individual interactions of the photochromic ligands with Y4R are responsible for the distinct impedance profiles.
A physiological interpretation of the impedance data during the switching cycles requires a closer look into the details of the Y4R-dependent signal transduction. The canonical coupling of the Y4R is reported to rely on Gα,i signalling and was verified by the miniGsi recruitment assay. Once Gα,i is released from the heterotrimeric G-protein, it binds to adenylate cyclase (AC) and inhibits cAMP formation. At the same time, cAMP is constantly degraded by cAMP-dependent phosphodiesterase (PDE). In resting cells constitutive activity of AC and PDE establish a dynamic equilibrium of cAMP production and degradation yielding a steady state concentration of cAMP. This energy consuming process is seemingly useless but allows very quick changes of cAMP concentrations in response to external triggers. Since cAMP-levels are low (<50 nM)19 in resting cells and get even lower from Gα,i activity, it is generally difficult to monitor Y4R activation by reading cAMP concentrations or downstream signalling events. Accordingly, it is common practice to pre-stimulate the cells by micromolar concentrations of forskolin, a receptor-independent, membrane permeable activator of AC isolated from plants. Forskolin increases intracellular cAMP concentrations to a level that facilitates experimental analysis of signalling mechanisms that lead to its reduction.20 Thus, a similar protocol was applied in impedance-based assays as performed in this study. Prior to adding the ligands, the cells were pre-stimulated by 0.4 μM forskolin. The subsequent forskolin-induced cAMP net production led to a significant decrease of the cell impedance by 400 Ω from values recorded for the resting cells. After the cells had equilibrated to these conditions within 30 min, the different ligands were applied and monitored for their impact on cell impedance (Figure 6, 7). Since forskolin concentrations were kept constant in all buffers and all phases of the experiment, release of Gα,i from the complete G-protein after receptor activation led to a competitive regulation of adenylate cyclase. Whereas forskolin—constantly present in all cell culture fluids—led to an activation of AC, Gα,i reduced its activity in a concentration-dependent manner. So, when the Y4 receptor and the associated signalling cascade were fully activated by the endogenous ligand hPP or high concentrations of the synthetic ligands, cAMP is efficiently reduced by over-compensating the forskolin activity bringing impedance back up to values of the resting cells or higher. Any partial activation of the receptor led to a reduced release of Gα,i activity and thus, to a competitive regulation of AC between forskolin and Gα,i that may be simply controlled by their individual concentrations and activities. If this interpretation applies, the in situ switching between the isomers and the associated change in receptor activation led to a fine-tuning of AC activity and all processes dependent thereof explaining the reversibility of the cell response during switching. For the CHO cells studied here, it seems that impedance measurements mirror the time-dependent cAMP concentrations inside the cell most likely via a cAMP-regulated protein or protein network that is involved in cell shape control. The response time of impedance readings to forskolin or agonist addition is in the order of 10–20 minutes. Accordingly, the cell response as reported by impedance is not dependent on changes in gene expression as the latter would require more time. The cell response is more likely determined by changes in functional activity of existing proteins.
Photoswitching Occurs inside Receptor Binding Pocket
In the experiments described in preceding sections, the ligands were added to the cells at time zero and were continuously present throughout the experiment. The question arose whether isomerization of the ligands upon irradiation occurs (i) in the bulk phase with subsequent competition for the receptor binding site between the bound ligand and its free isomer in solution or (ii) whether isomerization occurs in the binding pocket of the receptor without any ligand exchange. The average residence time for similar, radiolabeled Y4R ligands was found to be rather dependent on the experimental conditions and ranged between 5 and 30 min14a so that either mechanism is compatible with the impedance time courses. To gain more insight, we revisited the two isomers Z-28 and E-28 but adapted the experimental workflow by including a washing step after the ligands were incubated with the cells for 20 min (Figure 8).
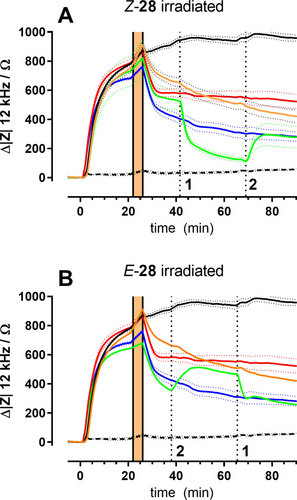
Time courses of impedance (12 kHz) during stimulation of CHO-Y4R cells with different agonists combined with repeated in situ irradiation at wavelengths specified below. Impedance was zeroed in for the last data point prior to agonist addition. Control cells were either incubated with hPP (without washing solid black line; with washing solid orange line, c=100 nM) or a vehicle control (dashed black line; c=0.01 % (v/v) DMSO). The red curves represent the unperturbed Z-28 (50 nM) whereas the blue curves stand for the corresponding unperturbed E-isomer. All green curves correspond to the isomer indicated in the header during light-induced in situ (re)isomerization. Times of irradiation are indicated by dashed vertical lines (1=455 nm; 2=340 nm). Time needed to wash out unbound ligands is indicated by the orange area. Cells were pre-stimulated with forskolin (0.4 μM) for 30 min (not shown). Mean±SEM (n=3).
The time interval needed for washing is indicated by the orange box. The colour code of the impedance time courses is as before. The endogenous ligand hPP (100 nM) is represented by (i) a black solid line when the liquid was not exchanged or (ii) an orange solid line, when the liquid with the free ligand was replaced by buffer. The vehicle control (DMSO, 0.01 % v/v, no washing) is indicated by a black dashed line. The impedance response for Z-28 is shown in red, the one for E-28 in blue. Both isomers were applied in 50 nM concentrations as before. The green curve corresponds to Z-28 in Figure 8A and E-28 in 8B. Only the cell population represented by the green curve was exposed to light (A: Z-28, 455 nm; B: E-28, 340 nm) at the time indicated by vertical dotted lines. As suggested by the red and blue curves in Figures 8A and B, washing led to a significant decrease of the impedance presumably due to a loss of a fraction of ligands from the receptor binding pockets when the bulk concentration was experimentally set to zero by washing. The mechanical load on the cells imposed by liquid handling may also contribute to the observed impedance decrease. In situ switching of the remaining Z-28 to the less potent E-28 after 40 min led to a significant and step-like reduction of impedance which is in line with the dose-response relationship of both ligands (Figure 8A). Re-isomerization to Z-28 was induced by irradiation with 340 nm after 70 min of experimental time. It was associated with an increase in impedance. However, values did not recover to those of the Z-isomer that has not been switched at all. When the corresponding experiment was performed with E-28 (Figure 8B), the outcome was similar. Initial isomerization of E-28 to Z-28 increased impedance almost to the values of the unperturbed Z-isomer. Re-isomerization by irradiation at 455 nm reduced impedance back to values of the unperturbed E-isomer. It is noteworthy that in these experiments no ligand was present in the bulk phase. Any dissociation from the binding pocket led to a practically infinite dilution so that any re-association of a formerly bound ligand back into the binding pocket was elusive. Conducting this washing/in situ photoswitching experiment with compounds E-30 and Z-30 returned very similar impedance time courses (data not shown). Taken together, these experiments demonstrate that in situ switching of the signalling cascade is possible even after unbound ligands have been washed out. Accordingly, the data provides evidence that isomerization is likely to occur with the ligand bound in the binding site of the receptor.
Conclusion
Photochromic ligands for cell surface receptors have significantly expanded the experimental toolbox for an in-depth analysis of ligand-receptor interactions. In combination with real time impedance measurements these molecules allow controlling GPCR signaling cascades starting from the conformational change of the receptor but entirely unaffected by the association or dissociation kinetics of the agonist. Ligand binding may get separated in time from a precisely controllable change in agonistic activity. With systems as described here, it will become possible (i) to activate the receptor periodically with different frequencies, (ii) to study the minimum activation time needed to trigger signaling events downstream of the receptor or (iii) to test whether reducing agonistic activity after a certain amount of time will stop receptor internalization or desensitization. When switching of photochromic ligands is performed on a microscope stage with microscopic precision, they provide an unmet temporal and spatial control of receptor activation or modulation to study how activation of receptors in a fraction of cells affects the ensemble. Two general conditions need to be fulfilled to exploit the ligands’ full analytical potential: (i) When optical readouts are being used to monitor the biological model system, the light that is used for photo-switching must not show spectral overlap with the light that is used for detection. (ii) The experimental setup must allow for in situ switching of the photochromic moieties. Label-free impedance measurements of adherent cells grown on planar gold-film electrodes are particularly well-suited to monitor the switching of bioactive photochromic probes as it provides an orthogonal readout with no interference by the light-induced switching. As the readout is sensitive to such a global indicator of cell state as morphology, it is applicable to a wide variety of receptors and signaling cascades. On the downside, impedance time courses do not contain any molecular information but only report on the integrated cell response. Molecular information requires the use of specific pharmacological modulators of the signaling cascades under test. The measurement itself is non-invasive and provides time resolutions that may be tailored to experimental needs from milliseconds to days or weeks. Since the gold electrodes are an integral part of the growth substrate, a typical setup provides a maximum of space to place light sources for switching. The data presented in this study illustrate how photochromic ligands in combination with tailored dosing/washing protocols may be used to unravel mechanistic details of receptor activation or signaling. The future combination of photochromic ligands with microfluidic chips to host the cells, specialized dosing protocols (e.g. stopped or pulsed flow), spatio-temporal control of bioactivity with the help of structured illumination and label-free detection will enable a new generation of assays to unravel dynamic properties of cellular signaling that are not available today.
Acknowledgments
The authors thank Susanne Bollwein, Maria Beer-Krön and Brigitte Wenzl for excellent technical assistance, and would like to acknowledge financial support of this study by the Research Training Group RTG 1910 “Medicinal chemistry of selective GPCR ligands” funded by the German Research Foundation (DFG) under project number 222125149. Open Access funding enabled and organized by Projekt DEAL.
Conflict of interest
The authors declare no conflict of interest.
Open Research
Data Availability Statement
The data that support the findings of this study are available from the corresponding author upon reasonable request.


