Intracellular Protein–Drug Interactions Probed by Direct Mass Spectrometry of Cell Lysates
Abstract
Understanding protein–ligand interactions in a cellular context is an important goal in molecular biology and biochemistry, and particularly for drug development. Investigators must demonstrate that drugs penetrate cells and specifically bind their targets. Towards that end, we present a native mass spectrometry (MS)-based method for analyzing drug uptake and target engagement in eukaryotic cells. This method is based on our previously introduced direct-MS method for rapid analysis of proteins directly from crude samples. Here, direct-MS enables label-free studies of protein–drug binding in human cells and is used to determine binding affinities of lead compounds in crude samples. We anticipate that this method will enable the application of native MS to a range of problems where cellular context is important, including protein–protein interactions, drug uptake and binding, and characterization of therapeutic proteins.
Introduction
In modern drug development, a molecular target is typically selected a priori and pursued.1 Evaluation of candidate drugs must involve efficacy and specificity of target engagement as well as compound physicochemical properties, including cellular uptake. While many cell-based activity assays provide an indirect readout of a drug's uptake and downstream cellular effects, they do not validate the molecular origin of the response. It is important to develop reliable analytical tools that bridge the gap between in vitro analyses of target binding and in-cell validation of compound uptake.2
Native mass spectrometry (MS) is a label-free tool for characterizing protein-ligand interactions.3, 4 In native MS, intact protein complexes are transferred to the gas phase while maintaining interactions between subunits and non-covalently bound biomolecules.5, 6 Advantages of native MS include high sensitivity and the ability to observe the full distribution of coexisting protein populations.7, 8 However, native MS analysis typically requires protein purification, which can be costly and labor-intensive.
We recently introduced direct-MS as a method for rapid analysis of overexpressed proteins directly from crude samples without purification.9-11 Direct-MS relies on the limited dynamic range of MS, which causes more abundant ions in a sample to suppress the signal of less abundant ones.12 Provided that the protein of interest is among the most abundant in the sample, direct-MS enables users to collect well-resolved spectra directly from crude samples and bypass lengthy purification procedures. These MS measurements can immediately assess stability, assembly state, post-translational modifications (PTMs), ligand binding, and even protein–protein interactions.9-11, 13
While our previous work focused on prokaryotic or secreted eukaryotic proteins,9-11 eukaryotic expression is important for proper folding and PTM of many human proteins.14 Here, prompted by the desire to develop direct-MS as a tool for drug development against human cellular targets, we extend direct-MS to human intracellular expression systems. Our results demonstrate that direct-MS can be used to analyze drug uptake and dose-response behavior for covalent and non-covalent drugs, with simultaneous measurement of multiple drugs to ascertain the most stable binder. Protein–drug affinities are also quantified in crude lysates. The approach presented here enables a wide range of native-MS experiments to be carried out for eukaryotic proteins directly from lysate, including drug screening, high-throughput analysis of protein engineering and production, and assessment of structural features.
Results and Discussion
Direct-MS requires protein overexpression followed by cell lysis in MS-compatible buffer and MS measurement of crude lysate. For robust protein overexpression in human cells, we chose the pHLsec plasmid, previously used in high-throughput structural genomics and in-cell NMR efforts,15, 16 and developed an optimized approach to yield MS-compatible lysates following transient transfection of HEK293T cells (see Experimental Section of the Supporting Information). We first examined superoxide dismutase, or SOD1, an ALS-related enzyme that converts the superoxide radical to hydrogen peroxide and molecular oxygen.17 Native MS has previously been used to study SOD1 and its post-translational modifications (PTMs), dimerization equilibrium, and small molecule binding.13, 18, 19 In its mature form, human SOD1 is a dimer with one Zn2+ and one Cu2+ ion bound to each monomer (Figure 1A). We overexpressed SOD1 in the presence of zinc,20 yielding lysate enriched in SOD1 (Figure S1). Native MS measurement of this lysate gave well-resolved spectra where the major charge series corresponded to SOD1 (Figure 1 B) bearing PTMs including removal of the initiator methionine residue and N-terminal acetylation, as is common for eukaryotic proteins. SOD1 has a clearly dominant charge state pattern that facilitates assignment, but protein peaks can also be assigned using top-down sequencing if PTMs or unknown cofactors complicate assignment.21
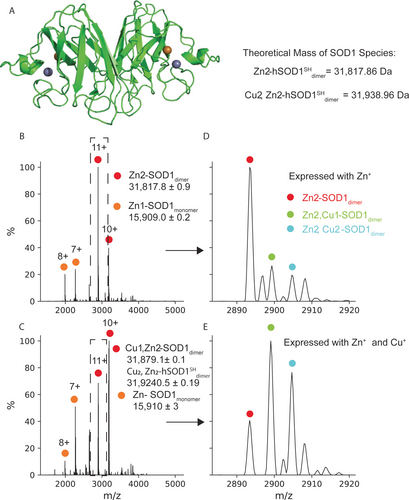
Direct-MS reveals the cellular metallation state of SOD1. A) Structure of SOD1 dimer bound to Cu2+ (red) and Zn2+ (blue) ions (green, PDB 1SPD). Also shown are theoretical masses of the Zn2+ and Zn2+, Cu2+ bound dimers, calculated accounting for proton displacement upon metal chelation (see SI). B) Direct-MS from cells expressing SOD1 in the presence of zinc yields a spectrum with peaks corresponding to monomer and dimer. C) MS spectrum upon addition of both copper and zinc to the expression media. D),E) Expansion of the 11+ charges state (dashed squares in B and C) reveals dimers with a range of metalation states; copper supplementation shifts the distribution towards dimers bound to both Cu2+ and Zn2+. Peaks that are not annotated correspond to adducts of the main metal-bound dimers.
Consistent with previous reports,20 the primary species following overexpression with zinc is a dimer with one Zn2+ ion bound to each monomer, an assignment confirmed by MS/MS analysis (Figure S2). Upon addition of copper to the culture media, the major species shifts to Cu2+ bound dimers (Figure 1 B–E). These results demonstrate that direct-MS can be used to analyze the PTMs, cofactor binding, and response to growth conditions for eukaryotic intracellular proteins without purification.
A major advantage of direct MS is that spectra informing on the distribution of bound states can be collected directly from cells, making it uniquely suitable to assess drug binding and uptake. We applied our approach to the kinase domain of Bruton's tyrosine kinase (BTK_KD), an important drug target in many diseases (Figure 2A).22 While BTK_KD had a lower expression level than SOD1, semi-quantitative Western blotting determined that BTK_KD comprises 4±1 % by weight of the lysate (Figure S3). This corresponds to ca. 250 nM BTK_KD in MS samples, well within the range accessible to native MS. Well-resolved spectra of BTK_KD (Figure 2 B) were collected that reveal removal of the N-terminal methionine followed by acetylation, as with SOD1.
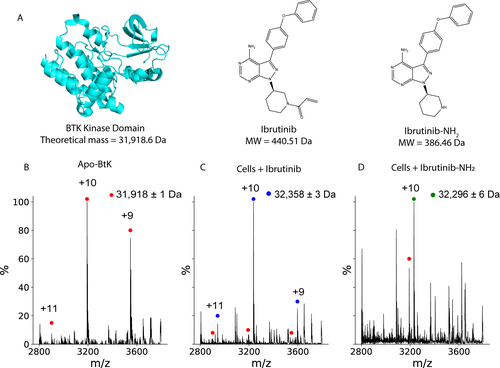
Drug–protein complexes are formed after addition of drugs to cells. A) Structure and masses of BTK kinase domain (cyan, PDB 5P9J), the covalent BTK inhibitor Ibrutinib and the noncovalent version Ibrutinib-NH2. B) MS spectrum of BTK_KD from crude lysate of cells overexpressing BTK_KD. C) Only 2 minutes after cells are exposed to 1 μM Ibrutinib, the dominant peak is already the drug-bound protein (blue marker), with less than 5 % of the intensity from the free protein (red marker). D) Varying concentrations of Ibrutinib-NH2 can be added to cells, which is reflected in the relative amount of bound BTK_KD. Shown is a spectrum from cells exposed to 0.5 μM drug, which has both peaks of the apo- and bound protein.
We next incorporated a drug incubation period into our direct-MS workflow (see Figure S4), confirming via the Trypan Blue exclusion test23 that cellular viability was unaffected by the incubation (see Experimental Section). To remove unbound drug, cells were briefly rinsed with ice-cold ammonium acetate. This rinse did not affect the measured amount of bound drug; samples rinsed 0, 1 or 2 times had similar percentages of the bound non-covalent inhibitor Ibrutinib-NH2 (see Figure S5). These experiments indicate that our protocol reliably captures mostly binding of drugs that penetrated the cells and not binding that occurred post-lysis.
To examine drug binding via direct-MS, we started with Ibrutinib, a clinically approved covalent drug targeting BTK_KD. After only 2 minutes of Ibrutinib exposure (see Experimental Section), the BTK_KD charge series primarily corresponded to the drug-bound complex, with a minor charge series consistent with the apo protein (Figure 2 C). This implies rapid drug uptake to the cells, as expected for a clinically approved drug.
Direct-MS can also be used to study the cellular uptake of non-covalent drugs. For this we chose the non-covalent version of Ibrutinib, Ibrutinib-NH2, which binds BTK_KD tightly.24 BTK_KD expressing cells were incubated with concentrations of Ibrutinib-NH2 spanning 3 orders of magnitude. The percentage of protein-drug complex observed via MS was correlated with the amount of Ibrutinib-NH2 added to the cells (Figure 2 D, Figure S6). We did not use these data to determine an affinity for Ibrutinib-NH2 since the concentration of drug in the final MS samples is unknown. However, fitting the data to a simple saturation-binding equation revealed an apparent IC50 of ≈0.2 μM (Figure S6). We compared this to a cellular IC50 that we measured for full-length, native BTK in Mino B-cells, a cell line in which BTK is natively regulated (ca. 0.4 μM, see Figure S7). It is notable that the two estimates have the same order of magnitude despite different experimental conditions, thereby implying that direct-MS measurements can be a good proxy for cellular activity assays.
We anticipate that our direct-MS method can evaluate cellular uptake and target engagement in a semi-high throughput fashion. At the current scale, each drug is screened in 1 mL of PBS containing 2 million cells, with a 100 mm plate yielding approximately 4 samples. However, MS requires only minute amounts of sample, with individual needle containing lysate from only about 2000 cells. By scaling down the size of screening samples, each plate could be used to prepare many samples, limiting the throughput of the method to user capacity to measure native-MS samples, which is 20–30 samples per day per instrument.
Another major advantage of direct-MS is that it directly identifies which drug is bound to the protein of interest from the mass shift in the protein peak. This is in contrast to other approaches, such as in-cell NMR25 or CETSA,26 in which only the protein is detected and thus the identity of the bound drug is unknown. This permits us to pool compounds and identify in one experiment which drug is the most potent cellular binder. For this, the two drugs must have sufficiently different masses. For BTK_KD, given an average peak width at 5 % of 3 m/z units for the 10+ charge state, we estimate that drugs differing by 30 Da can be distinguished.
We selected four compounds that bind BTK with varying efficacies; pluripotin, LY2409881, vemurafenib, and PP-121.27 Previously, the binding capacity of these compounds to BTK was assessed through competition with a chemiluminescent probe (1 μM). The extent of displacement of the probe by pluripotin, PP-121 and vemurafenib was found to be 100 %, 70 % and 25 %, respectively, at 10 μM.27 LY2409881 does not bind BTK. Moreover, pluripotin, the tightest binder, has a cellular IC50 below 64 nM.27 Incubating cells expressing BTK_KD with a mixture of these compounds, each at 1 μM, clearly showed that pluripotin bound the vast majority of BTK, with no signal from the other three compounds (Figure 3 A, B). We next added Ibrutinib-NH2 to this mix of drugs. The resultant spectrum showed again that the predominant species is pluripotin-bound, with a weak signal from Ibrutinib-NH2 that allowed us to put an upper limit of 10 % on the amount of Ibrutinib-NH2 bound (Figure 3 C). Given a cellular IC50 for Ibrutinib-NH2 of 400 nM (see above), the ratios of bound drug are in the range of what would be expected from solving a competitive binding equation for a system of two ligands in which one has a Kd of ca. 64 nM while the other has a Kd of ca. 400 nM.28 Thus, our direct-MS method can be used to rank in-cell binding efficacy of multiple drugs in a single experiment.
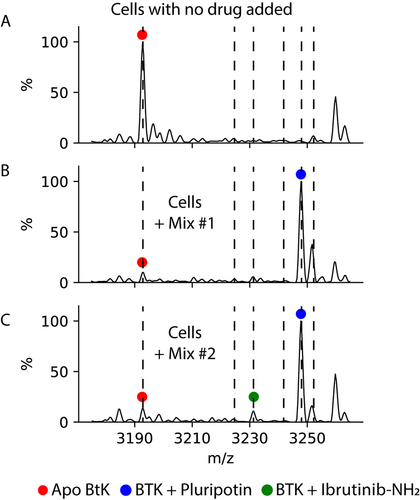
Direct-MS enables multiplexing of in cell drug binding. Cells expressing BTK_KD were incubated with a mixture of drugs that bind BTK_KD with varying affinities. Mix #1 included pluripotin, LY2409881, vemurafenib, and PP-121, all present at 1 μM concentration. Mix #2 was the same as Mix #1 with the addition of Ibrutinib-NH2. Order of affinity for BTK_KD is pluripotin > Ibrutinib-NH2 > PP-121 > vemurafenib > LY2409881 (see text). Dashed lines without peak assignment represent the theoretical complex m/zs for PP-121, vemurafenib, and LY2409981 (in order from lower to higher m/z). For a table with the MWs of the added drugs and expected complex masses, see SI Table 2. A) Extended view of the 10+ charge state of BTK-KD from cells with no drug added. B) Extended view of the same region from cells incubated with Mix #1, indicating that the vast majority of protein was bound to pluripotin. C) Extended view of the same region from cells incubated with Mix #2, indicating that the majority of the protein was bound to pluripotin with <10 % bound to Ibrutinib-NH2.
Despite the wide abundance of BTK inhibitors, including approved drugs,22 we explicitly chose to examine non-optimized lead compounds. We analyzed the binding of L6, a recently identified molecule targeting BTK_KD with a Kd of 0.25 μM.29 Applying our method to cells incubated with a saturating concentration of L6 revealed that at least 80 % of the protein was bound to L6 (Figure S8 and 4A). Next, we used direct-MS to rank two additional non-optimized compounds, L1 and L5, relative to L629 (Figure 4 A). L1 and L5 have Kds of 5 and 1 μM, respectively (Figure 4 A). After adding each compound at 1 μM to lysate, the % of protein bound to L5 and L6 was 24 and 75 %, respectively, in line with their relative affinities. We could not detect a BTK_KD/L1 complex, which is likely due to either weak affinity or compound dissociation in the mass spectrometer. Given that these are non-optimized inhibitors, these results demonstrate the utility of our approach to measure uptake and rank different compounds over the course of a lead optimization campaign.
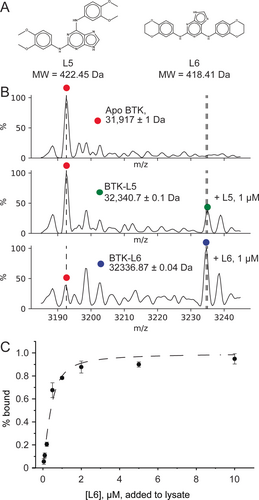
Direct-MS measures lead-compound affinity in crude lysates. A) Structures and molecular weights of two structurally similar compounds, L5 and L6, developed to inhibit BTK_KD. B) We compared L5 and L6′s ability to stably engage BTK_KD by comparing the relative intensities of the apo and bound complexes in lysates to which 1 μM drug was added. Shown is the 10+ charge state for lysate without drug and with L5 and L6 added; the L6 sample has a higher proportion of bound complex, in line with its higher affinity. Dashed lines represent the m/z for apo, L6 bound, and L5 bound BTK_KD complexes (in order from lower to higher m/z). C) A plot of the percent of BTK bound to L6 as a function of increasing L6 concentration. Each point is the average of three measurements, with error represented by the standard deviation. Data were fitted in Origin to Equation 2 (see Experimental Section) accounting for drug binding with depletion, with an R2 value of 0.97 (black line). This yielded a BTK_KD affinity of 150±145 nM for L6, comparable to that measured by ITC.29
Native MS can quantify protein/ligand affinity constants from the ratio of bound/unbound protein observed in spectra.4, 30-32 To apply the direct-MS method to determine drug affinity, we chose to use crude lysates, where we can precisely control the concentration of added drug and, thus, circumvent cellular drug uptake ambiguity. This approach enabled the fitting of binding curves to binding equations (see Experimental Methods). We mixed lysate samples with concentrations of L6 ranging from 0.05 to 10 μM and measured direct-MS spectra after incubation. The percentage of bound protein was calculated from the direct-MS spectra and plotted as a function of drug input. The data were fitted to an equation for drug binding that accounts for protein and substrate depletion as well as the fact that the exact concentration of expressed BTK protein is not known (see Experimental Section). The apparent BTK/L6 binding constant determined from the MS data is 150±145 nM (Figure 4 C). This Kd is in the range of the 250 nM Kd calculated via ITC,29 with discrepancies attributable to our use of 1 % instead of 5 % DMSO33 as well as the different incubation temperatures (4 °C vs. 25 C°). Moreover, our fitting protocol also determined the protein concentration to be ≈500 nM; this is similar to the value estimated by Western blotting (250 nM, see Figure S34), further validating our approach. This experimental approach for Kd determination directly from crude lysates is a quick and simple method to calculate protein–drug affinities in a complex mixture.
Conclusion
Here, we describe a simple and rapid approach for label-free analysis of intracellular overexpressed proteins directly from crude samples, with no purification, using native MS. We show that direct-MS can be used to study drug and lead-compound uptake, target binding and even to estimate the affinity of non-covalent drugs. We collect well-resolved spectra that report on the assembly state, post-translational modifications, and non-covalent associations of target proteins, as well as the impact of growth conditions on these properties. This method is applicable to a broad range of biophysical and biopharmaceutical applications, including screening of focused small molecule libraries, optimization and comparison of therapeutic compounds, and screening of engineered protein constructs.
Acknowledgements
We thank the laboratory of Prof. Lucia Banci from the University of Florence, Italy, for generously providing the pHLsec plasmid, and Haim Barr from the Nancy and Stephen Grand Israel National Center for Personalized Medicine for providing drugs. M.S. is grateful for the support of the Israel Science Foundation (ISF) (300/17), a Sagol Institute for Longevity Research grant and a Moross Proof-of-Concept grant. M.S. is the incumbent of the Aharon and Ephraim Katzir Memorial Professorial Chair. R.R. was a Fulbright postdoctoral fellow for the years 2019/2020.
Conflict of interest
The authors declare no conflict of interest.


