An evaluation of clinical inflammatory and coagulation markers in patients with sepsis: a pilot study
Funding Information
This study did not receive any research funding.
Abstract
Aim
Presepsin values could assist early diagnosis and prognosis of sepsis. In sepsis, prognosis is determined according to multiple organ dysfunction, where coagulopathy is common and associated with prognosis. This study aimed to determine the correlation between presepsin value trend and prognosis, and investigate coagulation abnormality in sepsis.
Methods
We retrospectively examined 18 intensive care unit patients diagnosed with sepsis whose presepsin values at admission were ≥500 ng/mL. If presepsin values had decreased ≥50% on hospital day 6, compared to admission values, the patient was allocated into a decreased presepsin group.
Results
Presepsin values in non-survivors with sepsis were significantly higher than in survivors on day 6 (P = 0.022). No significant differences in procalcitonin or C-reactive protein were identified between survivors and non-survivors, and platelet counts were significantly lower in non-survivors on days 0, 3, and 6 (P = 0.001, P < 0.001, and P = 0.001, respectively). The 90-day mortality rate in a decreased presepsin group significantly improved, even when presepsin values were high on admission (P = 0.012). Platelet counts were significantly lower on all hospital days in the non-decreased presepsin group.
Conclusion
Fifty percent decrease in presepsin levels could be a useful prognostic predictor of sepsis. Larger studies are required to confirm our findings.
Introduction
Critically ill patients with sepsis have high mortality rates. Sepsis is accompanied with shock, followed by multiple organ failure. Early diagnosis and treatment in patients with sepsis are important. Recently, sepsis has been defined using sequential organ failure assessment (SOFA) criteria;1 however, the SOFA score in critically ill non-sepsis patients also increases. Therefore, a precise distinction between sepsis and other critical illnesses, such as major surgery or trauma, is required. Although C-reactive protein (CRP) and procalcitonin (PCT) have been used as measures to diagnose inflammation, they also show high values in other critical illnesses. As presepsin is released when monocytes phagocytize bacteria, the production mechanism differs from that of PCT and CRP produced due to inflammatory cytokine stimulation, and presepsin could be an alternative marker of blood concentrations rapidly increasing in sepsis.2, 3 It has been reported that presepsin values could be useful not only in early diagnosis of sepsis but also in prognosis prediction.4-6 Dynamic monitoring of presepsin might reflect the prognosis of sepsis patients;7 however, it remains unclear what trend of presepsin indicates a better prognosis.
In sepsis, a prognosis is finally determined according to multiple organ dysfunction. In patients with multiple organ dysfunction, coagulopathy is known to be common in sepsis and associated with a worse prognosis.8 We retrospectively investigated the correlation between the presepsin value trend and prognosis, and investigated coagulation abnormalities in sepsis.
Materials and Methods
Participants
This study was approved by the Shiga University of Medical Science Ethics Committee (approval no. 28-167 2016; Otsu, Japan). From June 2014 to December 2014, we retrospectively examined sepsis patients who had been admitted to the intensive care unit (ICU) at Shiga University of Medical Science Hospital, and identified patients with a presepsin value ≥500 ng/mL on admission. Patients <20 years old, chronic maintenance dialysis patients, and patients with a blood disease were excluded.
Measurements
We classified the sources of infection into pulmonary, genitourinary, abdominal, skin or soft tissue, indwelling line, central nervous system, and unknown. Presepsin, PCT, and CRP values were measured every day from the day of admission to day 7. In all cases, age, sex, history, acute physiology and chronic health evaluation (APACHE) II score at admission, SOFA score at admission, hematological examination, biochemistry examination, coagulation examination such as prothrombin time (PT) (PT-control, 11.4 s), blood gas analysis, prognosis (28-day mortality rate, 90-day mortality rate), and the disseminated intravascular coagulation (DIC) score were recorded. Each factor of the SOFA score was evaluated for investigation of organ failure. The International Society on Thrombosis and Hemostasis diagnostic criteria were used to evaluate the DIC. Kidney Disease Improving Global Outcomes criteria9 were used to determine kidney injury and, during the study period, we investigated the use of continuous renal replacement therapy (CRRT). In our hospital, presepsin, PCT, and the leukocyte fraction could only be measured during weekdays, and the measured values were classified into three groups covering days 0–1, days 2–4, and days 5–7. The measured values are reported as day 0, day 3, and day 6 hereafter, and in Figures 1-3. Trends were also compared for all variables. The main prognostic outcome was 90-day all-cause mortality, and each comparison between survivors and non-survivors was investigated. In order to investigate the correlation between the presepsin trend and prognosis, we examined whether there had been a 50% decrease in presepsin values on day 6, based on the values obtained at admission (day 0). We defined ≥50% decrease of presepsin on day 6, compared to the presepsin value at admission, as the decreased presepsin group (D group), and <50% decrease or increase in presepsin values as the non-decreased group (N group). We then compared the background data and the prognosis between groups D and N.


Statistical analysis
For patient background, the values of the two groups were compared using the χ2-test and Mann–Whitney U-test, as appropriate.
To compare each value between survivors and non-survivors at each point, and after classification according to a 50% decrease in presepsin values at each point, a comparison of each value between a decreased presepsin group and a non-decreased group was made using the Mann–Whitney U-test. A comparison of the values at day 0 and day 6 in each group was undertaken using the Wilcoxon signed rank order test. A P-value <0.05 was regarded as significant. A Kaplan–Meier curve was plotted as a function of time during the 90-day follow-up period.
Results
We enrolled 18 patients and measured for presepsin in sequence during the study period. Although there were no significant differences in age or APACHE II score between survivors and non-survivors, a significant difference was found in SOFA score (Table 1). In each factor of the SOFA score, a significant difference was only found in the coagulation factor between survivors and non-survivors (day 0, P = 0.003; day 3, P < 0.001; and day 6, P < 0.001).
| Survivors | Non-survivors | P-value | ||
|---|---|---|---|---|
| Number | n = 18 | n = 8 | n = 10 | |
| Age (years) | 71 (62–74) | 65 (59–73) | 73 (63–76) | 0.360 |
| Sex M/F | 10/8 | 4/4 | 6/4 | 0.671 |
| APACHE II score | 21 (10–26) | 16 (6–23) | 23 (16–34) | 0.146 |
| SOFA score | 9 (7–12) | 8 (6–9) | 11 (8–12) | 0.034 |
| AKI +/− | 7/11 | 0/8 | 7/3 | 0.002 |
| CRRT +/− | 12/6 | 3/5 | 9/1 | 0.019 |
- AKI, acute kidney injury; APACHE, acute physiology and chronic health evaluation; CRRT, continuous renal replacement therapy; F, female; M, male; SOFA, sequential organ failure assessment.
Inflammatory response
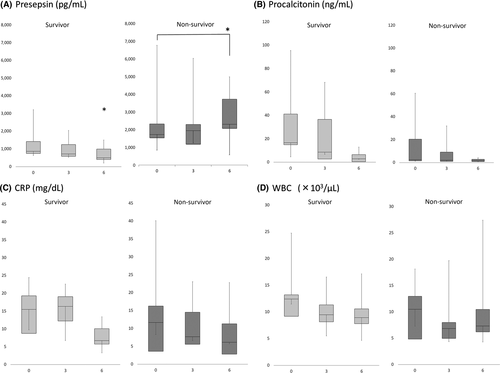
Presepsin values for non-survivors were significantly higher than for survivors at day 6 (survivors versus non-survivors, 502.0 ng/mL [range, 313.2–1,225.0 ng/mL] versus 2,326.0 ng/mL [range, 1,873.0–3,795.0 ng/mL], P = 0.022; Fig. 1A). No significant difference was found between survivors and non-survivors in terms of PCT, CRP or WBC values on days 0, 3, and 6 (Fig. 1B-D). A comparison of these factors between day 0 and day 6 revealed that presepsin values only were significantly elevated in the non-survivors (P = 0.036), whereas these values were not elevated in the survivors (P = 0.279; Fig. 1A).
Coagulopathy
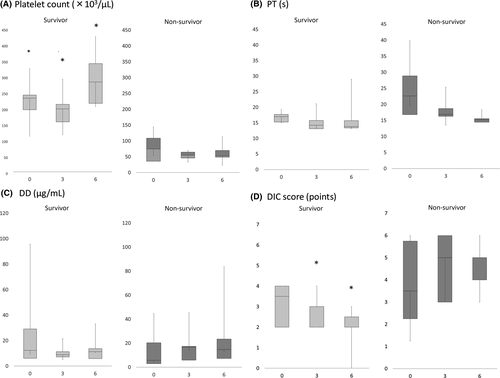
When comparing survivors and non-survivors on days 0, 3, and 6, platelet counts were significantly lower in non-survivors (survivors versus non-survivors: day 0, 231.2 [range, 168.2–247.2] versus 74.5 [range, 28.0–112.1] P = 0.001; day 3, 197.3 [range, 126.0–214.7] versus 55.0 [range, 39.8–66.1], P < 0.001; and day 6, 282.0 [range, 148.6–373.6] versus 52.3 [range, 48.6–77.0], P = 0.001, respectively) (Fig. 2A). There were no significant differences in PT and D-dimer between survivors and non-survivors (Fig. 2B,C).
The DIC scores (median [Q1–Q3]) of survivors were 3.5 [range, 2–4] on day 0, 2 [range, 2–3] on day 3, and 2 [range, 2–3] on day 6; and those of non-survivors were 3.5 [range, 1.5–6] on day 0, 5 [range, 2.5–6] on day 3, and 4 [range, 4–5] on day 6. There were significant differences on days 3 and 6 (P = 0.573, P = 0.046, and P = 0.001, respectively; Fig. 2D).
Acute kidney injury
Among non-survivors, estimated glomerular filtration rate was significantly lower than in the survivors on day 6 (non-survivors versus survivors: day 0, 37.0 [range, 30.0–70.4] versus 79.9 [range, 48.0–99.9], P = 0.203; day 3, 51.6 [range, 29.2–106.3] versus 108.9 [range, 71.8–136.2], P = 0.167; and day 6, 35.5 [range, 33.9–65.6] versus 122.3 [range, 68.8–150.2], P = 0.038, respectively). The numbers of patients with acute kidney injury and CRRT were both significantly higher among non-survivors than survivors.
Background data comparing groups D and N
When comparing groups D and N, there was no significant difference in background data (data not shown). In group N, there were four patients with pulmonary, six with abdominal, one with skin or soft tissue, and one with indwelling line infections. In group D, there was one patient with pulmonary and four with abdominal infections. In group D, platelet count was significantly higher at all points, but PT was not significantly different (Table 2) (platelet count: day 0, P < 0.001; day 3, P = 0.001; and day 6, P = 0.012).
| D group | N group | P-value | |
|---|---|---|---|
| Presepsin (pg/mL) | |||
| Day 0 | 1,032.5 (747.0–2,509.2) | 1,647.0 (769.0–2,801.2) | 0.606 |
| Day 3 | 580.0 (419.2–701.0) | 1,952.5 (1,104.6–2,246.0) | 0.008 |
| Day 6 | 452.6 (243.1–842.3) | 2,323.5 (1,593.2–3,775.2) | 0.019 |
| Procalcitonin (ng/mL) | |||
| Day 0 | 16.5 (14.8–41.0) | 2.8 (1.3–40.9) | 0.240 |
| Day 3 | 5.6 (1.3–28.7) | 3.9 (1.2–26.3) | 1.000 |
| Day 6 | 0.9 (0.2–5.8) | 2.2 (0.9–3.5) | 0.898 |
| CRP (mg/dL) | |||
| Day 0 | 12.7 (6.2–20.2) | 12.5 (7.3–22.1) | 0.959 |
| Day 3 | 15.8 (7.4–19.8) | 11.5 (5.8–16.3) | 0.574 |
| Day 6 | 6.4 (3.6–8.6) | 8.7 (2.8–12.5) | 0.440 |
| Platelet count (×103/μL) | |||
| Day 0 | 237.5 (231.2–287.0) | 81.2 (35.8–136.2) | <0.001 |
| Day 3 | 210.0 (154.6–253.3) | 60.8 (47.3–75.4) | 0.001 |
| Day 6 | 282.0 (215.1–364.3) | 62.5 (48.8–125.9) | 0.012 |
| PT (s) | |||
| Day 0 | 16.9 (14.8–18.2) | 18.1 (15.2–27.9) | 0.442 |
| Day 3 | 13.6 (12.9–19.2) | 16.3 (14.6–18.4) | 0.506 |
| Day 6 | 13.8 (13.1–23.1) | 14.4 (14.2–15.5) | 0.699 |
| DIC score (points) | |||
| Day 0 | 4.0 (2.0–4.0) | 3.0 (2.0–5.5) | 1.000 |
| Day 3 | 2.0 (2.0–3.0) | 4.5 (2.0–5.7) | 0.160 |
| Day 6 | 2.0 (1.0–3.0) | 4.0 (2.5–5.0) | 0.042 |
- D group, ≥50% decrease of presepsin on day 6 compared to admission; N group, <50% decrease or increase of presepsin on day 6 compared to admission.
- CRP, C-reactive protein; DIC, disseminated intravascular coagulation; PT, prothrombin time.
The DIC score in group N was higher than the DIC score for group D. Eight patients had received anticoagulation therapy, and three had undergone plasma exchange. Regarding the SOFA score, there was a significant difference only with regard to the coagulation factor (coagulation factor: day 0, P = 0.006; day 3, P = 0.009; and day 6, P = 0.019).
Presepsin value trend
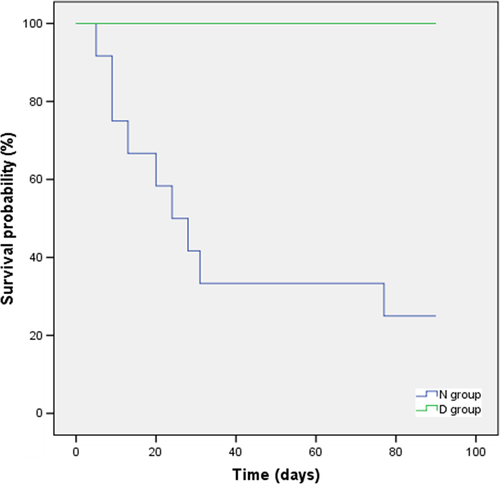
Groups D and N comprised 5 patients and 12 patients, respectively. The 90-day mortality rate in group D was significantly better than in group N, even with a high presepsin value on day 0 (P = 0.012; Fig. 3). All of the patients in group D survived >90 days post-admission. The presepsin trend in group N was as follows: three patients showed a decreasing trend (two deaths, one survivor), and nine patients showed an increasing trend (seven deaths, two survivors).
Discussion
The presepsin values tended to decrease during the study period in the survival group, even though these values were not significantly different between the survival group and non-survival group at admission. Sequential measurement of presepsin supports the prognosis of sepsis. We examined whether there had been a 50% decrease in presepsin values on day 6, based on the values at admission. The 90-day mortality rate in the decreased group was significantly better than that in the non-decreased group, even with a high presepsin value on day 0. Platelet count were significantly lower in non-survivors at all points. An increase in the DIC score on day 6 was observed in patients after platelet depression, and it is recommended sequential coagulation tests are carried out in platelet depression cases. When determining the SOFA score, in patients with a decreased presepsin group, only coagulation factor had a significant difference. In combination, the presepsin trend and the platelet count at admission appear to be useful as prognostic predictors of sepsis.
Comparison with other reports
A previous study has reported that presepsin values were significantly higher on days 3, 5, 7, and 12, and the decrease in presepsin in the survival group was larger.7 In our study, similar results were found and, additionally, we classified whether there had been a ≥50% decrease in presepsin. Even though presepsin values were high on admission, prognosis improved in patients with decreasing presepsin. Furthermore, we compared the coagulopathy between patients in group D and group N. In group N, the platelet count was significantly lower.
Presepsin
There were no significant differences between survivors and non-survivors in regard to PCT, white blood cell count, or CRP at all points. All patients with ≥50% decreased presepsin survived >90 days, and sequential measurement of presepsin seems to predict the prognosis of sepsis. These findings suggest that controlled infection appears to be defined as a ≥50% decrease of presepsin.
Platelet count
It has previously been reported that platelet reduction in ICU patients increases the mortality rate.10-14 However, the reasons for the worsening prognosis in patients with thrombocytopenia are not well understood. Thrombocytopenia in ICU patients is considered multifactorial, involving factors relating to the destruction of platelet in the peripheral blood, such as a decrease in production within the bone marrow, and abnormality in distribution;15 however, the mechanism of thrombocytopenia due to sepsis is still unclear. In severe sepsis, bone marrow suppression sometimes occurs as one of many organ disorders, and hemocyte production in the bone marrow is reduced.16
Recently, sepsis-associated coagulopathy has been reported to affect prognosis, that is, platelet count and PT – international normalized ratio can predict sepsis-associated coagulopathy.17 In our study, the platelet count was significantly lower in group N on admission than in group D, but there was no deterioration in PT. It seems to be difficult to determine coagulopathy according to PT in patients with sepsis because PT is likely to be affected due to the lowering of protein synthesis in sepsis and liver function following shock. In our study, platelet count at admission to the ICU might have reflected a poor prognosis; thus, continuous hematologic measurements appear necessary for the diagnosis of DIC.
Acute kidney injury
The effect of kidney dysfunction on presepsin could not be totally excluded. Although patients with renal dysfunction frequently undergo CRRT, there is a possibility that high presepsin values would be sustained due to impaired renal function. There is also a possibility that acute kidney injury could be responsible for the serum presepsin levels. Further large-scale studies are needed. In this study, we investigated the presepsin trend, that is, the ≥50% decrease in presepsin, and not the absolute value of presepsin. Therefore, the presepsin trend might reflect the prognosis of sepsis even in patients who have undergone CRRT.
Limitations
This was a retrospective single-center study. Data were missing because we could not measure presepsin values in our hospital on the weekends. Although we excluded dialysis patients, acute kidney injury is common in sepsis patients. It has been reported that presepsin is metabolized in the kidney and shows high values in patients with chronic renal failure;18 however, the correlation between presepsin and acute kidney injury has not been investigated.
Conclusion
Fifty percent decrease in presepsin levels could be a useful prognostic predictor of sepsis. Larger studies are required to confirm our findings.
Acknowledgements
The authors would like to thank A. Suzuki for her help with data collection.
Disclosure
Approval of the research protocol: This study was approved by Shiga University of Medical Science Ethics Committee (approval no. 28-167 2016).
Informed consent: Informed consent was not required as this was a retrospective observation study and the information had been previously released.
Registry and the registration no. of the study/trial: N/A.
Animal studies: N/A.
Conflict of interest: None declared.


