Comparative analysis of mamushi (Gloydius blomhoffii) bite patients indicates that creatinine kinase levels/white blood cell count trends reflect severity
Abstract
Aim
There has been no indicator that allows an early quantitative evaluation of the severity of a mamushi snake (Gloydius blomhoffii) bite. Because the number of severe mamushi bite cases is much fewer than non-severe cases, a formal case–control study is difficult. Therefore, we tried to generate a preliminary quantitative, real-time index for its severity by referring to published reports of severe mamushi bite cases.
Methods
We enrolled patients who presented with a mamushi bite and visited our outpatient clinic. Severe cases were collected from published works. Creatinine kinase levels and white blood cell counts of non-severe and severe cases were compared and analyzed.
Results
There was a lag time of 10 h before the creatinine kinase level began to rise. The speed of the increase was higher in severe cases than in non-severe cases, and severe cases were recognized as those showing speeds of above 250 IU/L/h. White blood cell counts increased earlier than creatinine kinase levels without any lag time. Severe cases were recognized as those with the counts of over 1,000 × (h) + 6,000 [/μL] before 5 h and 300 × (h) + 10,000 [/μL] after 5 h.
Conclusion
We herein present the creatinine kinase level and white blood cell count trends and demonstrate preliminary cut-off equations. The trends for both parameters serve as quantitative indicators of the severity of a mamushi bite until a large scale case–control study is achieved.
Introduction
A mamushi (Gloydius blomhoffii) bite is a common event. It is estimated that 3,000 people are bitten by this venomous snake in Japan each year, with 10 dying from the venom.1 One problem in treating mamushi-bite patients is that there have been no quantitative indicators that reflect the severity of the bite. We previously reported that the maximum creatinine kinase (CK) level and white blood cell (WBC) count during the clinical course were indicators of severe cases.2 However, the maximum values can appear several tens of hours after a bite, and clinical symptoms may precede the evaluation of severity. Thus, early quantitative evaluations of the severity are needed. Another problem is that the number of patients who present with serious clinical symptoms is much less than non-severe patients. In order to collect a high enough number of severe cases, a large-scale case–control study would be necessary, but it is also difficult to achieve. Therefore, we collected the clinical data of severe cases from published reports and compared them with those of our cases, and we thereby describe preliminary quantitative, real-time indexes for distinguishing severe cases from non-severe cases of mamushi bites.
Patients and Methods
We referred to medical records and retrospectively evaluated patients who presented with a mamushi bite and visited the outpatient clinic of the dermatology/plastic surgery department in Oita University Hospital (Hasama-machi, Yufu-shi, Japan) between 2005 and 2014. From these cases, we selected the patients for whom blood analyses were carried out three times or more during the period of 120 h after the bite for both the CK and the WBC analysis. The patients were classified into non-severe and severe groups according to the definitions described below. We evaluated all mamushi bite publications appearing in Igaku Chuo Zasshi of the Japan Medical Abstract Society between 1995 and 2014 that corresponded to definitions of severe cases, as described below, if they included more than two analyses of the CK or WBC values during the same time periods described above. We adopted the values of these parameters as they appeared in the report, irrespective of the method for measuring the CK and WBC values.
Severe cases were defined as those in which the patient received hemodialysis/ hemodiafiltration or systemic care in the intensive care unit because of heart failure or respiratory insufficiency or those in which the patient showed disseminated intravascular coagulation. Other cases were defined as non-severe cases. The criteria for excluding patients are shown in Table 1. Under these special conditions, the intensity of the required care and the laboratory values did not reflect the degree of systemic severity.
| Non-severe | Severe | P-value | ||
|---|---|---|---|---|
| Sex | Male | 23 | 8 | 0.23† |
| Female | 15 | 12 | ||
| Age, years | Median (range) | 66 (2–88) | 70 (17–82) | 0.032*‡ |
| Lesion | Finger | 21 | 7 | 0.92† |
| Hand | 5 | 4 | ||
| Arm | 1 | 1 | ||
| Toe | 3 | 2 | ||
| Foot | 7 | 6 | ||
| Leg | 1 | 0 | ||
| Initial grade | 1 | 7 | 1 | 0.024*† |
| 2 | 7 | 0 | ||
| 3 | 17 | 7 | ||
| 4 | 6 | 5 | ||
| 5 | 1 | 7 | ||
| Final grade | 1 | 3 | 0 | 1.21 × 10⁻⁶*† |
| 2 | 6 | 0 | ||
| 3 | 12 | 0 | ||
| 4 | 12 | 0 | ||
| 5 | 5 | 20 | ||
| Serum injection | 0 | 10 | 8 | 0.68† |
| 1 | 22 | 7 | ||
| 2 | 5 | 4 | ||
| 3 | 1 | 1 | ||
| Time of arrival, h | Median (range) | 0.5 (0.5–12) | 2 (0.5–31) | 0.15‡ |
| Minimal CK | Median (range) | 166.5 (37–9,000) | 8,463.5 (37–112,200) | 0.0016*‡ |
| Maximal CK | Median (range) | 285 (46–16,600) | 59,290 (11,700–277,800) | 1.92 × 10⁻⁶*‡ |
| Minimal WBC | Median (range) | 6,150 (3,790–13,050) | 10,600 (7,720–16,530) | 0.0069*‡ |
| Maximal WBC | Median (range) | 8,300 (5,100–17,300) | 22,930 (11,500–34,300) | 5.54 × 10⁻⁴*‡ |
- Excluded patients: those bitten on the tongue, those showing iatrogenic compartment syndrome, and those showing only thrombocytopenia. †χ2-test; ‡Mann–Whitney U-test. *P < 0.05. CK, creatinine kinase; WBC, white blood cell.
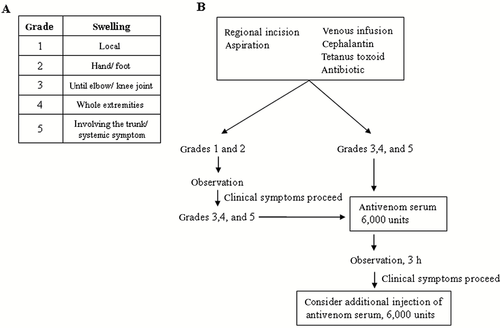
The cases were selected irrespective of treatment. However, basic treatment was carried out in many cases, as shown in Figure 1. The patients were classified into groups of grades 1–5 based on swelling (Fig. 1A), and the injection of antimamushi venom serum was applied according to a protocol developed by the emergency unit at Saga University Hospital (Nabeshima, Saga-shi, Japan) (Fig. 1B).3 If the patient arrived at hospital a long time after the bite (typically more than 20 h), the injection of the serum was decided by each physician.

Grading and therapeutic protocol for mamushi bites. A, Grading of mamushi bites. B, Therapeutic protocol for mamushi bites. These findings were based on a previous publication,3 with some modification in the expression.
Gender, age, bitten part, initial and final grades, antiserum usage, CK level/WBC count were compared between the non-severe and severe cases. All CK levels/WBC counts and corresponding time points in each patient were subjected to the analysis. The CK and WBC values were selected because we have found that these parameters become extreme in severe cases.4 The Mann–Whitney U-test was used to compare the values between the non-severe and severe groups. The F-test was used to compare the dispersion of the CK levels, if necessary. The χ2-test was used to evaluate the degree of deviation of elements in these groups. P-values of less than 0.05 were considered to be statistically significant.
Results
Forty patients who visited our clinic were suitable for both the CK and WBC analyses. Among these 40 cases, 38 were non-severe and 2 were severe; 1 of the severe cases had been published previously.4 Eighteen severe cases from 17 publications were suitable for the CK analysis,5-21 and five were suitable for WBC analysis.12-14, 17, 19 In summary, the number of non-severe cases for the CK analysis was 38, while that of severe cases was 20. For the WBC analysis, the number of non-severe cases was 38 and the number of severe cases was 7.
The patients' demographics are shown in Table 1. There was a statistically significant difference in the patients' ages, although the clinical significance of the median age difference of four years was not clear. Gender, lesion, serum injection, and time of arrival did not show any statistical differences between the two groups. In contrast, the initial and final grades, CK levels, and WBC counts were greater in the severe cases than in the non-severe cases, indicating that these parameters are related to severity. Eight (40%) out of 20 severe cases were not given antiserum. When these 8 cases were compared with the remaining 12 cases, only the CK values were less in severe cases with the serum injection than those without the serum injection (P = 0.046, data not shown). No difference was seen in the CK trends during early phase (less than 40 h), and in the WBC trends during the whole clinical course (data not shown). These findings indicate that the antiserum usage in the severe cases had limited effects.
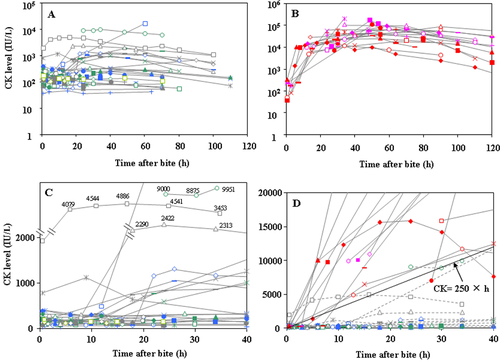
In order to evaluate the laboratory values more closely, we plotted the CK levels against time after the bite (Fig. 2A, B). The number of available plots was 199 for the non-severe cases and 97 for the severe cases. The final CK levels were distributed below 10,000 IU/L in most of the non-severe cases (Fig. 2A), and from 10,000 to 100,000 IU/l in the severe cases (Fig. 2B). The most obvious difference was apparent in the trends in CK levels during the first 40 h. We therefore replotted the levels that were obtained during this time period.

A, B, Trends in creatinine kinase (CK) levels after non-severe (A) and severe (B) mamushi bites. The y-axis is shown as an exponential scale. Each symbol represents a different case. C, D, Trends in CK levels at early time points. C, Non-severe cases. D, A comparison of the non-severe and severe cases. Red and magenta symbols indicate severe cases; blue, green, and gray symbols indicate the non-severe cases. The black solid line indicates the cut-off that distinguishes between non-severe and severe cases. Note that the scale on the y-axis in severe cases differs from that of the non-severe cases.
As shown in Figure 2C, the CK levels in 36 (94.7%) of 38 non-severe cases remained less than 500 IU/L until approximately 10 h after the bite. However, in the period from 10 to 40 h after the bite, the CK levels in 11 cases (28%) became elevated at over 500 IU/L. These findings indicate that the CK levels have a lag time of 10 h, and a quarter of the non-severe cases showed CK elevation thereafter. A statistical summary of these data is shown in Table 2. The CK levels before 10 h and at 10–40 h did not reach statistical significance (P = 0.094), whereas a difference was seen in the variation of these values (P = 9.37 × 10⁻⁹, F-test), indicating that the CK levels greatly diverged after 10 h. This result supports the finding that the CK levels in some non-severe cases increased 10 h after the bite.
| Median (range), n = available point number | |||
|---|---|---|---|
| CK (IU/L) | <10 h | 10–40 h | P-value |
| Non-severe | 149 (37–4,079), n = 65 | 194.5 (37–9,951), n = 88 | 0.094,† 9.37 × 10⁻⁹*‡ |
| Severe | 230 (50–10,099), n = 11 | 22,317 (4,900–204,274), n = 32 | 9.01 × 10⁻⁵*† |
| P-value | P = 0.026*† | P = 1.67 × 10⁻⁶*† | |
| WBC (/μL) | <5 h | 5–40 h | P-value |
|---|---|---|---|
| Non-severe | 6,050 (3,610–12,500), n = 42 | 6,850 (3,400–17,300), n = 108 | 0.005*† |
| Severe | 9,630 (7,720–15,400), n = 6 | 20,580 (11,500–34,300), n = 14 | 0.0018*† |
| P-valule | 0.0051*† | 1.21 × 10⁻⁵*† |
- †Mann–Whitney U-test; ‡F-test. *P < 0.05.
However, CK levels in some severe cases had become elevated before 10 h (Fig. 2D), and the CK levels in the severe cases were significantly higher at less than 10 h than those noted in the non-severe cases (P = 0.026). In summary, compared with the non-severe cases, the CK levels in severe cases tended to become elevated earlier.
The CK levels in the severe cases were also greater at 10–40 h than those observed in the non-severe cases (Table 2), indicating that there is a boundary between these groups. A fair distinction between the two groups occurred at the following line: CK = 250 × h (Fig. 2D). In the very early time period of less than 2 h after the bite, no significant differences in CK levels were seen (P = 0.083, Table 3A). However, during the period from 2 to 40 h, the CK levels in the severe cases were significantly greater than those noted in the non-severe cases (P = 3.82 × 10⁻⁵). Accordingly, the CK levels at 32 out of 39 points in the severe cases were located above the line; 32 of the 36 points that located above the line corresponded to severe cases (sensitivity and positive predictive values of 82% and 89%, respectively) (Table 3B). Similarly, in the non-severe cases, the sensitivity and positive predictive value were 97% and 94%, respectively.
| Median (range), n = available point number | ||
|---|---|---|
| CK (IU/L) | <2 h | 2–40 h |
| Non-severe | 141 (37–1,923), n = 33 | 171 (37–9,951), n = 123 |
| Severe | 230 (50–9,792), n = 5 | 15,683 (82–204,274), n = 39 |
| P-value | 0.083 | 3.82 × 10⁻⁵* |
- Mann–Whitney U-test.
| CK, 2–40 h | WBC, <5h | WBC, 5–40 h | ||||
|---|---|---|---|---|---|---|
| Non-severe | Severe | Non-severe | Severe | Non-severe | Severe | |
| Above the line | 4 | 32 | 7 | 6 | 3 | 12 |
| Below the line | 118 | 7 | 28 | 0 | 105 | 2 |
| Sensitivity, % | 97 | 82 | 82 | 100 | 97 | 86 |
| Positive predictive value, % | 94 | 89 | 100 | 46 | 98 | 80 |
- *P < 0.05. CK, creatinine kinase; WBC, white blood cell.
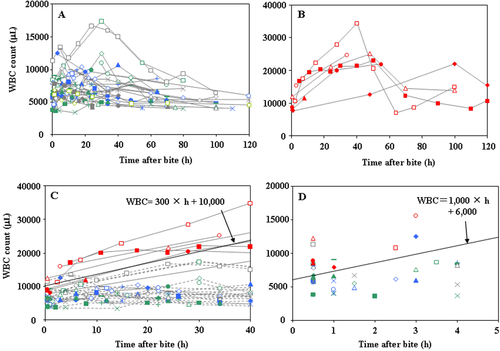
Next, we plotted WBC counts against the time after a bite. The number of available plots was 198 for the non-severe cases and 37 for the severe cases. In both of the groups, many of the counts reached peaks 20–40 h after the bite (Fig. 3A,B). We analyzed changes in WBC counts within 40 h after a bite and observed a trend: the WBC counts rose slowly without any lag time in either group (Fig. 3C,D).

A, B, Trends in white blood cell (WBC) counts after non-severe (A) and severe (B) mamushi bites. C, D, Trends in WBC counts at early time points. Comparison of non-severe and severe cases until 40 h after the bite (C) and until 5 h after the bite (D). Red and magenta symbols indicate severe cases; blue, green, and gray symbols indicate non-severe cases. The black solid line indicates the cut-off that distinguishes between non-severe and severe cases.
As shown in Figure 3C, the points from severe cases are well separated from non-severe cases. Non-severe and severe cases were fairly distinguished by the following line: WBC = 300 × h + 10,000. During the time period from 5 to 40 h, the WBC counts were greater in the severe cases than in the non-severe cases (P = 1.21 × 10⁻⁵, Table 2). Based on the distinction of this cut-off line, the sensitivity and positive predictive values of the severe cases were 86% and 80%, respectively (Table 3B).
During the period less than 5 h from the bite, the distinction between both groups by the line was poor. However, within 5 h, points from severe cases also tended to be located above those of non-severe cases (Fig. 3D, P = 0.0051, Table 2). Both groups were barely distinguished by a line of WBC = 1,000 × h + 6,000. The positive predictive value of the severe cases was 46% (Table 3B), and all of the severe cases were located above the line.
Discussion
This study provided the trends in CK and WBC values in patients bitten by the mamushi snake. Increases in CK levels in most of the non-severe cases had a lag time of approximately 10 h; in some of the severe cases, the CK levels became elevated before 10 h. In contrast, WBC counts tended to increase slowly without a lag time. These trends allow us to recognize whether a change in these parameters is typical or not.
The new cut-off equation of CK = 250 × h obtained in our study is close to that of CK = 300 × h described in our previous study.2 Both of these equations would function as indicators of the severity of mamushi bites. Another previous study indicated that many cases that show CK elevation at speeds of greater than 100 IU/L/h are grade V or cases that require intensive care.22 This cut-off value also fits well with many of our non-severe cases. The difference between our cut-off value and that of the abovementioned study would largely depend on the definitions of severe cases.
Creatinine kinase levels in a mamushi bite reflect the severity of rhabdomyolysis.23 The major factor to induce rhabdomyolysis is a glycoprotein named HR-1.24 Thus, the lag time reflects the time that is required for the injected HR-1 to attach itself to the cell membrane and cause muscle damage. An earlier elevation of CK levels may suggest the direct injection of the venom into circulation.
In the present study, it was newly found that the bite severity is reflected by the WBC count, which begins to increase before the CK level. The non-severe and severe cases could be distinguished by two cut-off lines, depending on the time. Although the CK equation covers most of this time period, the WBC equations are effective because, in some severe cases, the CK levels remained low and only become elevated after 10 h. Therefore, the WBC count is a steady early indicator of the severity of a mamushi bite.
The increase in WBC count after a mamushi bite is reminiscent of the trend of WBC counts in patients with myocardial infarction, in whom the earliest blood parameter to change is the WBC count.25 These findings suggest that there might be a signal whereby leukocytes are recruited into circulation in response to local stress after a mamushi bite.
In this study, in order to obtain information on severe cases, we referred to previously reported times and CK levels/WBC counts. Therefore, this study is not a formal case–control study, but is a comparison of our cases and reported cases. A potential problem for this study is that these publications do not represent all severe cases. But as far as there has been no case–control study with a sufficient number of severe cases, estimation of the indexes by referring to published works is inevitable. It is expected that the cut-off equations will serve for clinicians until a good case–control study is achieved.
Conflict of Interest
None.


