GPS-identified, low-level nocturnal activity of vervets (Chlorocebus pygerythrus) and olive baboons (Papio anubis) in Laikipia, Kenya
Funding information: National Science Foundation, Grant numbers: BCS 99-03949, BCS 1266389; EAGER-IOS-1250895 and III-1514174; Wenner-Gren Foundation, Grant number: 8386, Japan Society for the Promotion of Science, Grant numbers 23405016 and 10H05776; BBSRC, Grant number: BB/L006081/1; L.S.B. Leakey Foundation, University of California, Davis
Abstract
Objectives
Except for owl monkeys (Aotus spp.), all anthropoid primates are considered strictly diurnal. Recent studies leveraging new technologies have shown, however, that some diurnal anthropoids also engage in nocturnal activity. Here we examine the extent to which vervets (Chlorocebus pygerythrus) and olive baboons (Papio anubis) are active at night.
Materials and Methods
We deployed GPS collars with tri-axial accelerometer data loggers on 18 free-ranging adult females: 12 vervets spread among 5 social groups, and 6 olive baboons spread among 4 groups. Their locations were recorded every 15 min, and their activity levels, for 3 s/min over 7.5 months. We also used camera traps that were triggered by heat and movement at seven sleeping sites.
Results
Travel was detected on 0.4% of 2,029 vervet-nights involving 3 vervets and 1.1% of 1,109 baboon-nights involving 5 baboons. Travel was mainly arboreal for vervets but mainly terrestrial for baboons. During the night, vervets and baboons were active 13% and 15% of the time, respectively. Activity varied little throughout the night and appeared unaffected by moon phase.
Discussion
Our results confirm the low nocturnality of vervets and olive baboons, which we suggest is related to living near the equator with consistent 12-hr days, in contrast to other anthropoids that are more active at night. Since anthropoid primates are thought to have evolved in northern latitudes, with later dispersal to tropical latitudes, our results may have implications for understanding the evolution of anthropoid diurnality.
1 INTRODUCTION
It is well established that the size of the eye orbits is a reliable indicator of diel activity in primates, with nocturnally active species having larger orbits than diurnally active species (Ankel-Simons & Rasmussen, 2008; Kay & Kirk, 2000; Kirk, 2006; Ross & Martin, 2007; Ross, Hall, & Heesy, 2006). Recent studies have shown that some strepsirrhine primates in Madagascar do not fit neatly into these two activity categories. Eulemur and Hapalemur are now known to be cathemeral, that is, active at any time during the day or night (Colquhoun, 1998; Curtis & Rasmussen, 2002; Donati, Lunardini, Kappeler, & Borgognini Tarli, 2001; Kappeler & Erkert, 2003; Tattersall 1987), and their orbits overlap in size between nocturnal and diurnal species (Kay & Kirk, 2000). The discovery of cathemerality was made only fairly recently in the history of primatology because human observers are diurnal and tend to conduct their research during the daytime.
Technological advances have now made it possible to monitor animal movements and activity throughout the 24-hr cycle via camera traps and biotelemetry collars that record locational data (via GPS) as well as orientation and three-dimensional movement (via tri-axial accelerometers). While GPS/accelerometer collars have been deployed on many animal taxa, this approach is rarely used on primates, especially diurnal species, because most are easily observed without recourse to trapping and sedation, interventions that are necessary for collar deployment. However, studies using such remote sensing methods have revealed surprising results. For instance, although accelerometer data confirm that Verreaux's sifakas (Propithecus verreauxi) are strictly diurnal (Erkert & Kappeler, 2004), nocturnal observations, camera trap imagery, and GPS monitoring reveal that ring-tailed lemurs (Lemur catta), also traditionally considered strictly diurnal (Jolly, 1966), exhibit substantial nocturnal activity and spatial displacement (Donati, Santini, Razafindramanana, Boitani, & Borgognini-Tarli, 2013; LaFleur, Sauther, Cuozzo, Yamashita, Youssouf, & Bender, 2014; Parga, 2011). Perhaps future work will reveal that other Malagasy strepsirrhines are also flexible in their diel patterns.
In contrast to strepsirrhines, all anthropoid primates except owl monkeys (Aotus spp.) are considered strictly diurnal. Thus it is even more surprising that two anthropoid species (chimpanzees, Pan troglodytes, and Guizhou snub-nosed monkeys, Rhinopithecus brelichi) have shown nocturnal travel and activity (Krief et al., 2014; Tan, Yang, & Niu, 2013). This opens up the possibility that other anthropoid primates may also be more active at night than expected. We investigated this possibility in sympatric vervets (Chlorocebus pygerythrus) and olive baboons (Papio anubis), two African anthropoid species that tend to live in tropical, semi-arid environments. As the subjects of many studies over the years, they are considered strictly diurnal. However, to the best of our knowledge they have not yet been studied to assess nocturnal activity. Here we use remote GPS/accelerometer technology to assess the extent to which vervets and olive baboons are active at night. Discovery of frequent activity at night would be relevant for studies of energetics and social behavior. For instance, a population of chimpanzees was discovered to engage in crop-raiding at night, thus supplementing their energy intake from wild foods (Krief et al., 2014). It has also been argued that group-living primates are constrained in the time required to invest in social relationships via social grooming to the extent that it limits group size (Dunbar, 1991; Lehmann, Korstjens, & Dunbar, 2007). Nocturnal activity involving grooming could, presumably, reduce this pressure. Reports of nocturnal activity in animals whose vision is adapted for sunlight might also stimulate research on their effectiveness in seeing at night and lead to greater understanding of visual processes.
2 MATERIALS AND METHODS
2.1 Study site and subjects
We conducted this research at the Mpala Research Centre on the Laikipia Plateau of central Kenya (0.29°N, 33.90°E), a semi-arid environment (total rainfall in 2014: 443.2 mm) that includes riverine habitat along the Ewaso Nyiro River, dominated by Acacia xanthophloea, and bushlands away from the river, dominated by A. etbaica, A. mellifera, A. brevispica, and Boscia angustifolia. The study area supports a nearly full complement of wild mammals (Isbell & Bidner, 2016; Young, Okello, Kinyua, & Palmer, 1998).
We monitored five groups of vervets and four groups of olive baboons with GPS and VHF/GPS radio-collars, respectively, all with tri-axial accelerometer data loggers (Savannah Tracking, Inc., Nairobi, Kenya). The goal was to place collars on two adult females in each study group. Females were targeted because they are philopatric and served as representatives of their groups. We trapped vervets in drop-traps modified from Grobler and Turner (2010) and baboons in wire cage traps placed near regular sleeping sites (Jolly, Phillips-Conroy, & Mueller, 2003). The traps were prebaited with dried maize prior to trapping for 4–24 days. When an adult female entered a trap, we caught vervets by pulling the prop away using a rope tied to it, and baboons, by releasing a taut rope attached to the wire cage door, both from inside a vehicle at least 20 m away. Trapped primates were immobilized with 10 mg/kg ketamine administered via hand injection or blow dart. After weighing and measuring the animals, and fitting the collars on them, we returned them to cage traps or to two drop-traps stacked together to recover from immobilization. We fitted nine vervets and six olive baboons with collars in January 2014, and fitted three more vervets with collars in March 2014.
2.2 Data collection
The data collection period reported here spanned 7.5 months from 16 January to 31 August 2014. We programmed the collars to take GPS fixes every 15 min, and accelerometer recordings for 3 s/min at 32 Hz, continuously throughout the study. When we were within Ultra High Frequency (UHF) range of each collar, we downloaded the collar's GPS and accelerometer data using a base station (E-obs GmbH, Gruenwald, Germany) fitted with either an omnidirectional marine antenna (cxl 900–3LW: Procom, Frederikssund, Denmark) or a nine-element yagi antenna (YAGI-869A: Low Power Radio Solutions, Witney, UK).
We also monitored terrestrial activities of primates at or near seven sleeping sites with camera traps (Reconyx Hyperfire PC900 and Rapidfire RM45; Reconyx, Inc., Holmen, WI) that ran continuously day and night. Body heat or movement triggered the cameras to take bursts of three photographs at the rate of 1/sec. All cameras used infrared illumination for nocturnal photos.
2.3 Data analysis
“Travel” and “activity” are measures that both involve movement. Travel was identified via GPS data and always involved spatial displacement of the collared individual greater than the precision of our GPS units. Activity was identified based on accelerometer data and involved bodily movement (McFarland, Hetem, Fuller, Mitchell, Henzi, & Barrett, 2013) that could, but did not have to, involve spatial displacement. For example, a primate engaged in grooming, local foraging, scratching, or body shifting would be scored as active but not traveling in our analysis. To quantify individual activity patterns, we calculated the overall dynamic body acceleration (ODBA), an aggregate measure that combines data from all three accelerometer axes. We first generated a histogram of ODBA values during the daytime, from which we identified a threshold ODBA value for distinguishing active from inactive states. We then applied this threshold to the night-time ODBA values to estimate the proportion of ODBA measures that were above this threshold (and thus the proportion of time spent active).
2.4 Travel
We extracted GPS data from 3,138 primate-nights between 20:00 hr and 04:00 hr, inclusive (local time). We limited our analyses to these hours to avoid confounding effects from animals arriving late at their sleeping trees or leaving particularly early. We first explored the characteristics of GPS units left in situ where vegetation was either sparse or wooded for 1–4 days to examine the accuracy of the units. We found that when the GPS unit's internal horizontal inaccuracy estimate was >23 m for a given point, the error of the point became unpredictable. In contrast, when the value was <23 m, the location error had a 95% error range of 11 m (but up to about 20 m error). Thus, we expect about 95% of the location estimates for a stationary GPS collar to lie within a 22 m-diameter circle of the collar's true location.
To determine whether animals traveled during the night, we developed and applied a spatiotemporal clustering algorithm to identify changes in the centroid of consecutive observations. This algorithm involved first calculating the distance between consecutive points (step length) and multiplying this by the time between points (in minutes). We then applied a hierarchical clustering algorithm (using the complete linkage algorithm) to these distances to generate a hierarchical tree in which the branch length is equal to the spatiotemporal distance between clusters of observations. We found that the distribution of between-cluster distances was bimodally distributed, and applying a cut-off of 45 m (which is twice the maximum GPS error) as the minimum spatiotemporal distance between clusters enabled us to generate an a priori set of candidate travel nights (Figure 1). The two modes in the distribution of travel nights are shown in Figure 1, with most nights having very little travel (gray) and fewer nights potentially having some travel (red). These candidate travel nights (n = 577) included many false positives, so we visually examined the nightly travel tracks for each animal-night found in the right-hand half of that distribution to manually extract the ones that showed clear evidence for travel (i.e., two clusters with separated centroids) in the movement plots.
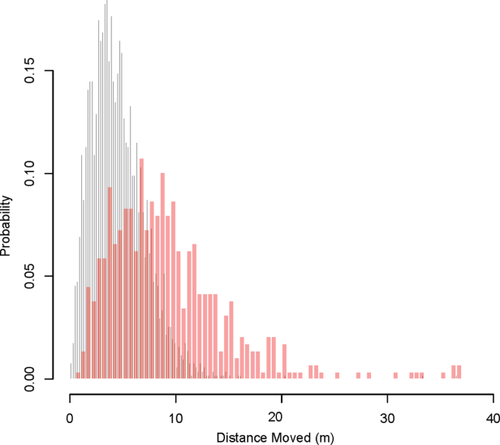
Histogram of travel distances. Nights with no travel shown with gray bars. Candidate travel nights shown with red bars. These nights were identified by hierarchical clustering as having potentially more than one cluster of observations (i.e., at least two sets of observations that were more tightly grouped around themselves than with each other; see Figures 2 and 3)
When trying to characterize nightly travel of these diurnal primates, we found that there was no simple way of classifying distance traveled into movement versus nonmovement due to GPS noise. For example, we found the log of the distance between each consecutive GPS point to be normally distributed. This suggests that there were no cases where an individual moved a distance in a 15-min period that was larger than GPS error (or at least they were very rare). Had individuals made significantly larger movements than the size of the GPS error during the course of a night, for example, hundreds of meters, these points would have appeared as a second “hump” in the distribution of between-point distances (step lengths) and thus would have been clearly identifiable.
2.5 Activity
The total time spent active, pooled across individuals for each species, was estimated using data taken from 3D accelerometers integrated into the GPS collars. For each 3-s measurement of activity, we calculated ODBA by summing the total acceleration across all three axes of the accelerometer (Wilson et al., 2006). We then calculated the frequency distribution of log(ODBA) values and found that these were clearly bimodal. Comparing the nighttime distribution of log(ODBA) values to those from the daytime suggested that “active” and “non-active” were clearly different modes, and that an ODBA threshold value of log(992) = 6.9 would separate out observations of active individuals from those of nonactive individuals. This number represents the mean minima between distributions across all individuals. Thus, to calculate total time spent active for each night, we calculated the proportion of log(ODBA) values above 6.9. We calculated the moon phase for each night using the R package lunar (Lazaridis, 2014) to examine rates of activity relative to moon phase.
3 RESULTS
3.1 Travel
We analyzed 3,138 primate-nights (vervets: n = 2,029; baboons: n = 1,109) and found evidence of nighttime travel on only 21 of these nights (vervets: n = 9; 0.4% of vervet-nights; baboons: n = 12; 1.1% of baboon-nights). Only 3 of 12 vervets, all in different groups, ever traveled at night. In contrast, five out of six baboons, representing all four study groups, engaged in nighttime travel at least once. Baboons traveled on significantly more nights than vervets (χ2 = 4.33, p = .04). On travel nights, vervets moved an average of 29.7 m (range: 11.−66.5 m, SD: 21.5 m) whereas baboons moved an average of 22.8 m (range: 11.6–54.8 m, SD: 17.2 m). Figures 2 and 3 provide examples of nights with and without travel in each species. None of the camera traps ever revealed primates on the ground at night. Inspection of GPS locations on those nights using Google Earth indicates that vervets remained in the trees on six nights, but on three nights the same vervet did not move into her sleeping trees until 21:00–03:00. On these nights, before ascending she was in the same bushland area, suggesting that there might have been a unique refuge at that particular location, but we cannot identify it. One night of arboreal travel may have been in response to a leopard, which was caught on camera at the sleeping site that night. Baboons were located on kopjes (rocky outcrops) on nine of the 12 baboon-nights in which they traveled, indicating terrestrial travel. On one night, two females from the same group crossed the river together, suggesting the possibility of a predator attack. On another night, a female appears to have descended to the ground before returning to the trees.
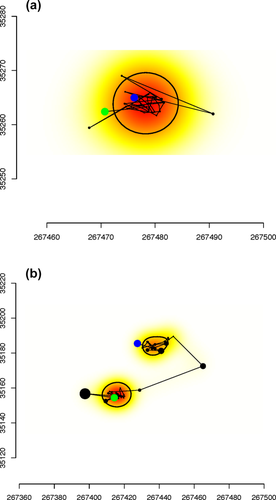
Example of (a, b) vervet between 20:00 and 04:00 hr. Axes are in UTM so that the distances are easily interpreted in meters. Green is the starting point, and blue is the end point. Filled black circles are sized according to the estimated error value calculated by the GPS, that is, large circles reflect large error. Each point is connected by lines to show the travel order. The black thin line demarcates the area(s) within which the animal is estimated to have spent 50% of its time. Points outside the 50% utilization range do not represent movement but instead represent points with large errors. The underlying color represents a continuous measure of utilization density (darker colors are areas where there is a greater probability of the individual being observed). Nights with no travel (a) are contrasted with nights with travel (b) by their more irregular shapes and the presence of more than one set of clustered observations (represented by two centers with darker colors on the utilization density and two black circles)
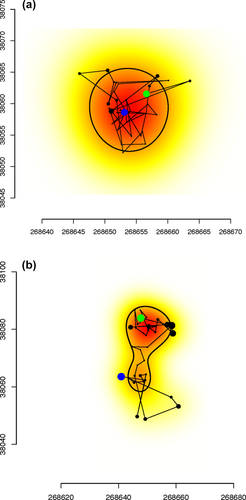
Example of baboon travel between 20:00 and 04:00 hr. Axes are in UTM so that the distances are easily interpreted in meters. Green is the starting point, and blue is the end point. Filled black circles are sized according to the estimated error value calculated by the GPS, that is, large circles reflect large error. Each point is connected by lines to show the travel order. The black thin line demarcates the area(s) within which the animal is estimated to have spent 50% of its time. Points outside the 50% utilization range do not represent movement but instead represent points with large errors. The underlying color is represents a continuous measure of utilization density (darker colors are areas where there is a greater probability of the individual being observed). Nights with no travel (a) are contrasted with nights with travel (b) by their more irregular shapes and the presence of more than one set of clustered observations (represented by two centers with darker colors on the utilization density)
3.2 Activity
Figure 4 contrasts high activity during the daytime with low activity during the nighttime for vervets and baboons. Separating out the active state (the right-hand peak) from the “inactive” state (the left-hand peak) on the daytime plot, and then applying this same threshold to the nighttime reveals that vervets were active 13% of the night, and baboons, 15%. Activity varied little throughout the night (Figure 5) and was also not obviously affected by moon phase (Figure 6).
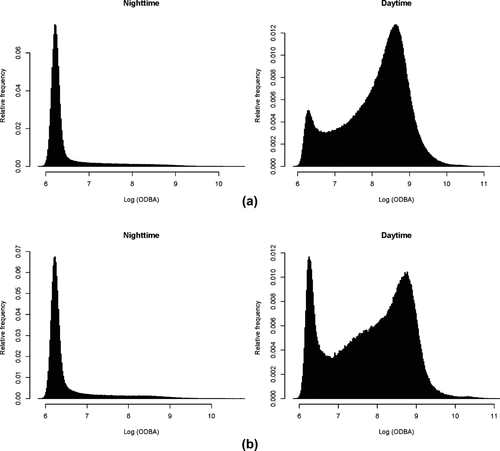
(a, b). Low activity during the nighttime versus high activity during the daytime for (a) vervets and (b) baboons. Daytime plots show a marked peak in high values of ODBA (values exceeding 6.9), representing active movements of individuals fitted with accelerometers. In contrast, night-time plots show only an extended tail, suggesting that although individuals were occasionally active, such behavior was infrequent during this period. Both daytime and nighttime data show frequent observations of individuals being inactive (values less than 6.9)
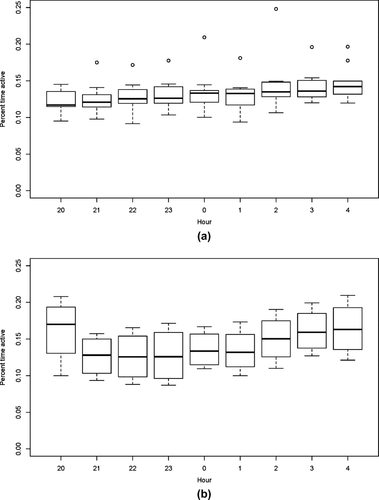
(a, b). Activity levels of (a) vervets and (b) baboons per hour between 20:00 and 04:00 hr based on three-axis accelerometer data. Boxes represent the median and 25th and 75th percentiles; whiskers indicate values within 1.5 times the interquartile range; circles are outliers
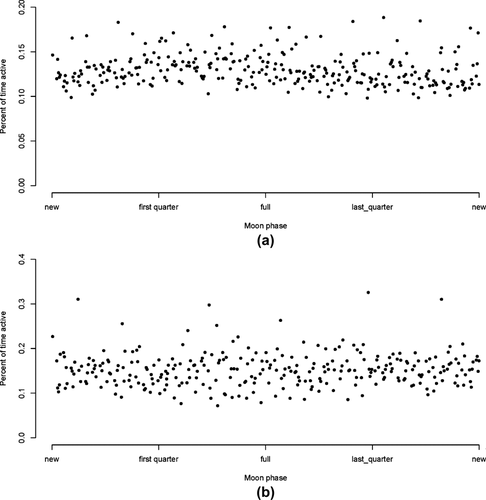
(a, b) Activity levels of (a) vervets and (b) baboons relative to moon phase. Each point represents the percentage of activity pooled for all individuals of each species on each night
4 DISCUSSION
Until fairly recently, it was widely thought that if a primate is active during the day it would not be active at night. The increasing awareness of cathemeral primates now challenges this view sufficiently that it is worth investigating nocturnal behavior in what have always been considered strictly diurnal primates. The availability of remote, automated technology to monitor the movements of animals throughout the 24-hr cycle now makes it possible to determine to what extent “strictly diurnal” primates are active at night. Our results confirm limited nocturnality in vervets and olive baboons, two cercopithecoid primate species traditionally considered strictly diurnal. Camera trap, accelerometer, and GPS data reveal that once vervets and olive baboons in Laikipia are settled down for the night, they rarely travel from their nighttime locations and are active at night no more than 15% of the time. Their level of nighttime activity is similar to that of humans with normal sleep patterns (Zhang et al., 2011). We were unable to identify specific types of nocturnal activity. To discriminate behaviors based on accelerometer data requires substantial time-matched data on behavioral states from direct observations. A recent study has used accelerometer data to delineate a more complete behavioral ethogram from remotely sensed data (Fehlmann et al., 2017). Time-matched data on behavioral states from direct observations are difficult to collect at night, however, because our vision is adapted for sunlight.
We propose that the rarity of nocturnal activity in vervets and olive baboons at our study site is linked to living near the equator where environmental influences vary little over time. At our study site, sunrise and sunset vary by 31 min and 11 min, respectively, over the course of a year. In 2014 the shortest day was 12.07 hr and the longest, 12.17 hr (United States Naval Observatory (USNO) (http://aa.usno.navy.mil)). Similarly, temperatures are consistently mild in this semi-arid environment, with mean monthly minimum and maximum temperatures of 9°C and 32°C, respectively, and fluctuating by 20°C at most, during the dry season months of January–March when cloud cover at night is uncommon (Isbell, 2013).
In contrast, snub-nosed monkeys living in China's temperate environment were active at night in 25% of all camera trap events, and their nocturnal activity was attributed to living in a temperate environment where sunlight fluctuates more and seasonality is stronger (Tan et al., 2013). Among owl monkeys, those species living in tropical habitats with low seasonality are nocturnal (Khimji & Donati, 2014) whereas A. azarai living in highly seasonal, subtropical Argentina (Fernandez-Duque, Rotundu, & Ramirez-Llorens, 2002) is more active during the day after nights when moonlight is reduced as well as during colder months (Fernandez-Duque & Erkert, 2006). Full cathemerality, with its more uniform diel activity, has been found thus far only in Malagasy strepsirrhines, whose environment has been described as hypervariable in rainfall and fruit productivity (Dewar & Richard, 2007), but which also includes variable hours of sunlight across the year (Curtis & Rasmussen, 2002; Donati & Borgongnini-Tarli, 2006). One way to test the effects of variable day length on nocturnal activities would be to investigate nighttime activity in vervets and baboons living in southern Africa where day length is not constant across the year (Hill et al., 2003). To our knowledge, this has not yet been done.
Our findings have implications for the evolution of diurnality in primates. Like other early placental mammals, the lineage leading to primates is thought to have been nocturnal (Hall, Kamilar, & Kirk, 2012; Isbell, 2009; Ross & Martin, 2007; Ross et al., 2006). Primates of modern aspect first appeared during the Paleocene and Eocene in the northern latitudes (Fleagle, 2013) and included diurnal primates based on orbit size relative to body size and diel activity of extant primates (Kay & Kirk, 2000). Although these latitudes were tropical in climate, daylight would have varied across the year much more than in the tropical latitudes (23.5° north and south of the equator) where most primates now live (Ankel-Simons & Rasmussen, 2008; Bennie, Duffy, Inger, & Gaston, 2014). Both conventionally diurnal and nocturnal extant primate species living outside the tropics are revealing greater flexibility in diel activity and perhaps extinct strepsirrhines living north of the tropics had similar flexibility. There is also growing evidence that anthropoids evolved in Asia (Beard, 2006). In Hubei Province, China where Archicebus was discovered (Ni et al., 2013), daylight fluctuates annually by four hrs (USNO: http://aa.usno.navy.mil). It is worth exploring the possibility that the visual systems of the first anthropoids evolved under dim light conditions (Melin, Matsushita, Moritz, Dominy, & Kawamura, 2013) and that the strict diurnality that is seen in today's anthropoids evolved only after they spread to tropical latitudes.
ACKNOWLEDGMENTS
This research was approved and conducted under IACUC protocol #17477 at the University of California, Davis. Permission to conduct research in Kenya was granted upon affiliation with the Kenya Wildlife Service (KWS) and approval from the governmental agencies NCST and NACOSTI (permit No. P/15/5820/4650). The field research was supported by the National Science Foundation (BCS 99–03949 and BCS 1266389), L.S.B. Leakey Foundation, and the University of California, Davis to L.A.I., and from the Wenner-Gren Foundation (grant number 8386) to L.R.B. and the Japan Society for the Promotion of Science (grant numbers 23405016, 10H05776) to A.M.O. M.C.C. and D.R.F. were supported by the National Science Foundation (EAGER-IOS-1250895 and III-1514174 to MCC); D.R.F. also received support from the BBSRC (BB/L006081/1 to B.C. Sheldon). We thank Mpala Research Centre Director Margaret Kinnaird and staff for logistical support, Mathew Mutinda and George Omondi for veterinary assistance, and Wilson Longor, Matt Snider, and Eric Van Cleave for field assistance. This manuscript was improved by thoughtful comments and suggestions from the associate editor, an anonymous reviewer, and R. McFarland.
AUTHOR CONTRIBUTIONS
L.A.I. conceived the study and wrote the manuscript. L.R.B. compiled the data and contributed to the manuscript. D.R.F. executed analyses and contributed to the manuscript. A.M.O. and M.C.C. contributed to the manuscript. GPS and accelerometer data are deposited at https://www.movebank.org.


