Correction to “Neutrophil to Lymphocyte Ratio in Captive Olive Baboons (Papio anubis): The Effects of Age, Sex, Rearing, Stress, and Pregnancy”
-
Approximately 25 baboon rearing statuses (mother-reared vs. nursery-reared) were incorrect in the data set. These were corrected in the data set, which affected the regression analysis in the article. The statistical significance and conclusions were unchanged, but there were changes to the subject sample sizes, some statistical parameters of the regression, and resulting tables. The corrections are as follows:
-
In the first paragraph of the Methods section, the number of mother-reared versus nursery-reared baboons included in the study was updated. This should read: “Of the 387 baboons, 210 were mother-reared, 173 were nursery-reared, and four had an unknown rearing history.” Additionally, in Table 1, the Ns, mean NLR, median age, mean age, and age range across colony and rearing were updated. The table should appear as follows:
| Males | Females | |||||
|---|---|---|---|---|---|---|
| SPF | MR | N | 81 | MR | N | 90 |
| Mean NLR ± SEM | 2.33 ± 0.22 | Mean NLR ± SEM | 3.08 ± 0.28 | |||
| Mean age ± SEM | 1.71 ± 0.25 | Mean age ± SEM | 3.68 ± 0.35 | |||
| Median age | 1 | Median age | 3 | |||
| Age range | 0−11 | Age range | 0−12 | |||
| NR | N | 68 | NR | N | 90 | |
| Mean NLR ± SEM | 1.84 ± 0.24 | Mean NLR ± SEM | 2.28 ± 0.20 | |||
| Mean age ± SEM | 2 ± 0.32 | Mean age ± SEM | 4.97 ± 0.5 | |||
| Median age | 1 | Median age | 2.5 | |||
| Age range | 0−16 | Age range | 0−18 | |||
| CONa | MR | N | 4 | MR | N | 35 |
| Mean NLR ± SEM | 0.85 ± 0.16 | Mean NLR ± SEM | 2.31 ± 0.31 | |||
| Mean age | 13.5 ± 0.96 | Mean age | 13.77 ± 0.46 | |||
| Median age | 13 | Median age | 14 | |||
| Age range | 12−16 | Age range | 9−19 | |||
| NR | N | 2 | NR | N | 13 | |
| Mean NLR ± SEM | 3.07 ± 2.63 | Mean NLR ± SEM | 1.94 ± 0.44 | |||
| Mean age ± SEM | 3.5 ± 1.5 | Mean age ± SEM | 7.77 ± 1.64 | |||
| Median age | 3.5 | Median age | 9 | |||
| Age range | 2−5 | Age range | 2−16 | |||
- Abbreviations: CON = conventional colony, MR = mother-reared, NR = nursery-reared, SEM = standard error of the mean, SPF = specific pathogen-free colony.
- a Conventional sample includes 4 additional baboons (2 males and 2 females) with unknown rearing histories.
-
In the first paragraph of the rearing, sex, age, and colony effects of the Results section, the F and R2adj for the regression were updated. The F value should read 9.11 and the R2adj should read 0.08. Additionally, the beta, standard error, standardized beta, t, and p values for the effects of age, sex, rearing, and colony were updated, such that Table 2 should appear as follows:
-
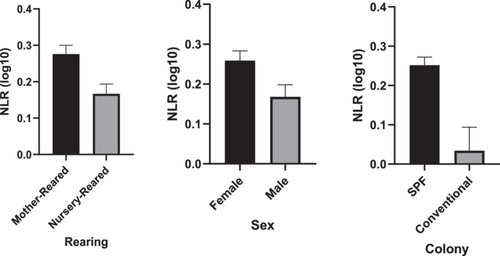
The means included in the mother- versus nursery-reared bar graph in Figure 3 were corrected. Figure 3 should appear as follows:
-
Lastly, the means and standard errors in Table 3 for baseline and transport NLR were updated. The table should read as follows:
| B SE | Beta | t | p | ||
|---|---|---|---|---|---|
| Intercept | 0.272 | 0.038 | 7.238 | 0.000 | |
| Age | 0.018 | 0.005 | 0.238 | 3.64 | 0.000 |
| Sex | −0.10 | 0.040 | −0.134 | −2.52 | 0.012 |
| Rearing | −0.108 | 0.036 | −0.148 | −2.97 | 0.003 |
| Colony | −0.250 | 0.066 | −0.238 | −3.80 | 0.000 |
| Phenotype | MR male mean (SEM) | NR male mean (SEM) | MR female mean (SEM) | NR female mean (SEM) |
|---|---|---|---|---|
| Baseline NLR | 2.26 (0.21) | 1.88 (0.24) | 2.87 (0.22) | 2.25 (0.18) |
| Transport NLR | 3.57 (0.64) | 3.70 (1.0) | 3.82 (0.31) | 4.05 (0.40) |

We apologize for this error.


