Extended Growth Curves for the Wolf-Hirschhorn Syndrome (4p-)
Funding: The authors received no specific funding for this work.
ABSTRACT
Wolf-Hirschhorn syndrome (WHS) is a rare, highly variable contiguous gene deletion syndrome caused by deletions of the distal portion of the short arm of chromosome 4. Individuals with this disorder have prenatal onset of poor growth of all dimensions, along with neurological manifestations, developmental disability, and distinctive facial appearance. There are two previously published growth charts for individuals with WHS. Antonius and colleagues included 101 children aged 0–4 years, and Shimojima and Yamamoto included 34 individuals ranging from 15 months to 24 years of age. We present detailed length/height and weight curves on an additional 65 patients from birth to 18 years of age and occipitofrontal circumference curves from birth to 2 years of age. Our data provide additional insight into growth patterns for individuals with WHS. As expected, these individuals are generally smaller than typically growing individuals for all parameters. Unexpected findings included near absence of the pubertal growth spurt and a higher-than-expected number of individuals overlapping the typical growing range. Growth charts are a critical part of pediatric healthcare, and syndrome-specific growth charts are particularly important in conditions where abnormal growth is a major feature. These additional growth charts serve as a useful addition to the literature on WHS, particularly providing additional information on growth through puberty and final adult height.
1 Introduction
Deletions of the short arm of chromosome number 4 were first recognized as a cause of human disease in the 1960s following the publication of two patients by Wolf et al. and Hirschhorn et al. in 1965 (Wolf et al. 1965; Hirschhorn et al. 1965). The syndrome associated with these deletions was named Wolf-Hirschhorn syndrome (WHS) (OMIM 194190) in recognition of these descriptions. The classical presentation of WHS includes the four cardinal features of growth deficiency (both pre-and postnatal), neurological manifestations (hypotonia and seizures), cognitive/developmental disability, and the distinctive typical facial appearance (tall forehead, prominent glabella, wide-spaced eyes, broad, prominent nasal root and bridge, short philtrum, and prominent upper lip with downturned corners of the mouth) (Battaglia 2021). As cytogenetic diagnostic technologies improved over time, milder phenotypes due to small deletions, including interstitial deletions, were described. Significant effort has been put into attempting to establish the critical region(s) for WHS, genotype–phenotype correlation, and understanding the contribution of individual genes to the phenotype. The cumulative evidence shows that WHS is a highly variable, true, contiguous gene deletion syndrome (no one gene is responsible for the entire phenotype) (Zollino et al. 2008; Battaglia et al. 2015; Battaglia 2021; Zollino and Doronzio 2018). Furthermore, cytogenomic microarray analysis (CMA) suggests that no two unrelated patients have the exact same deletion (Dr. Karen Ho, personal communication).
Growth failure of all dimensions of prenatal onset is a key feature of 4p-/WHS. Although WHS is a true contiguous gene deletion syndrome, and therefore, no single gene is both necessary and sufficient to cause the phenotype, the growth failure seen in this condition has been primarily attributed to NSD2 (Zollino and Doronzio 2018).
Existing WHS growth charts include those published by Antonius et al. (2008) and by Shimojima and Yamamoto (2012). The study by Antonius et al. included 101 children, ages birth to 4 years of age, of European ancestry. The Shimojima and Yamamoto study included 34 Japanese patients, ranging from 15 months to 24 years of age. Growth hormone deficiency has been reported, and the majority of patients have delayed bone age (Battaglia 2021). Also, a good response to growth hormone has been reported in non-GH-deficient patients with WHS (Austin et al. 2015). Due to these issues and despite the existing charts, endocrinologists caring for patients with WHS have argued that additional growth information, particularly growth through puberty and final adult height, is needed (Siew and Yap 2018).
2 Methods
This study was approved by the Institutional Review Board of the University of Utah. Participants were recruited from the 4p- Support Group (https://4p-supportgroup.org/). The 4p- Support Group is the largest patient/family support group for individuals with WHS and related disorders in the United States. Although this is a US-based group, there are a small number of members who are residents of other countries, primarily in North America. All participants had a deletion of the distal portion of 4p, detected by standard karyotyping, FISH, or CMA involving 4p16.3 at a minimum; individuals with 4p- due to an unbalanced translocation were also included. Written informed consent for participation was obtained. After informed consent, participants provided documentation of growth parameters. Some were provided in table format, and some participants submitted copies of growth curves. Data were deidentified, and growth parameters were abstracted from these sources prior to analysis. Each participant's data points were grouped to allow longitudinal analysis of individual growth over time. Data abstracted included sex, length/height, weight, occipitofrontal circumference (OFC), and age at the time each measurement was collected. The total number of participants was 68. One participant withdrew. Two participants did not have ages associated with their growth data points and could not be analyzed. Thus, the total number of patients analyzed was 65. Obvious outliers were carefully removed from the data set prior to analysis. Head circumference was only analyzed from birth to 24 months because OFC is not routinely measured after 2 years of age and there were an inadequate number of OFC data points available on individuals older than 2 years. For the length/height data, all available length or height measurements after age 18 were truncated to age 18 and, if there were multiple measurements after age 18, only the first was used. Data were analyzed longitudinally (each individual's personal growth trajectory). Weight and length/height measurement data from birth to 24 months and from 24 months to adulthood were analyzed separately. We explored separate models for each sex and sex as a covariate. However, we were unable to create separate male and female curves as there were inadequate numbers of males. This is not unexpected, as WHS occurs in a 2:1 female-to-male sex ratio (Battaglia 2021).
2.1 Statistical Analysis
Individual growth curves were summarized using a subject-specific, shape-invariant model approach known as SuperImposition by Translation And Rotation (SITAR) (Cole et al. 2010). This provides a common shape for all subjects' growth over time. Up to three parameters can vary from subject to subject. First, the curve can shift up or down. Second, the timing of growth can vary (when growth starts/ends). Last, the rate/magnitude of growth can vary. Separate models were fit for weight, length/height, and OFC. The shape used for each model was a cubic smoothing spline. Model fitting was performed for each measurement and age group using Akaike Information Criterion as a measure of model fit. Model parameters selected using the criterion included the number of spline knots and which subject-specific parameters to include (Table 1).
In addition to an “average” growth curve, we wanted to calculate and display curves corresponding to quartiles and 2.5, 5, 10, 90, 95, and 97.5 percentiles. This was achieved by assuming that random model parameters are normally distributed and by using the estimated variance and covariance of those parameters from each model. Prediction ellipsoids corresponding to the aforementioned percentiles were generated based on these assumptions, and predicted measurement curves were generated. In order to graphically compare to Centers for Disease Control (CDC) growth charts for normal children, we averaged CDC data for males and females to create quartile curves. All statistical analyses were performed using R Language and Environment (v 4.4.0, R Foundation, 2024).
3 Results
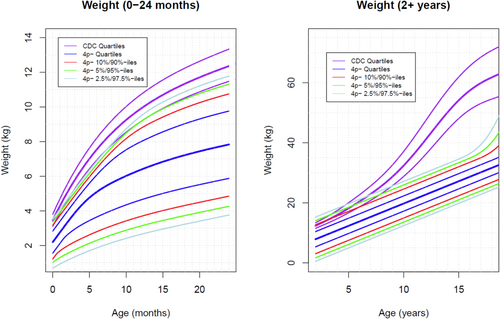
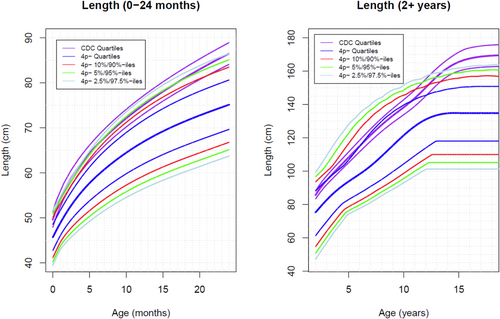
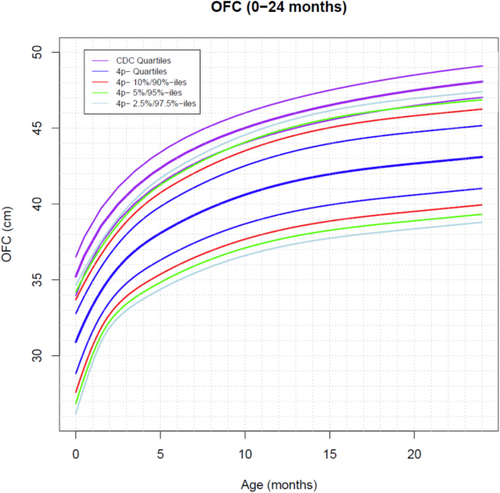
As mentioned above, 65 patients were analyzed. The total number of measurements was 960 weight points (725 from female individuals, 235 from male individuals), 680 length points (493F, 184 M), and 300 occipitofrontal circumference (OFC) points (234 F, 66 M). Weight curves were created from 0 to 24 months of age (Figure 1) and from 24 months to 18 years (Figure 1). Length curves were created from 0 to 24 months of age (Figure 2) and from 24 months to 18 years (Figure 2). An OFC curve was created from 0 to 24 months of age (Figure 3). As expected, patients with 4p- in this sample had much smaller growth parameters, on average, at all time points than are seen in the typical population. However, analysis of these data shows more individuals overlapping the typically growing range than previously anticipated. Some infants were relatively long and/or heavy for age compared with typical individuals, which was unexpected Table 1.


| Measurement | Age group | Number of knots | Parameters |
|---|---|---|---|
| Weight | ≤ 24 months | 2 | Shift, timing |
| Weight | ≥ 24 months | 3 | Shift, timing |
| Length | ≤ 24 months | 2 | Shift, timing |
| Length | ≥ 24 months | 3 |
Shift, timing, rate/magnitude |
| OFC | ≤ 24 months | 2 | Shift, timing |
4 Discussion
Comparing an individual's height with standard growth curves is a key component of pediatric medicine. Following growth over time is a key component of decision-making in relation to feeding interventions (e.g., the decision to pursue supplemental feeding or tube feeding) and for decision-making about additional evaluations (such as the need to evaluate for dysfunction of the growth hormone axis). Lack of syndrome-specific growth charts for disorders in which poor growth is a major feature makes this foundation of pediatric well-child care exceptionally challenging. This addition to the available literature on growth in 4p-related disorders is particularly useful because it includes individuals through adulthood and allows for additional information on growth through puberty and final adult height.
Importantly, our data raise implications regarding clinical care and further research needs in our population. The growth pattern in our population resembles populations known to respond to growth hormone therapy, such as Turner syndrome, Noonan syndrome, and even untreated growth hormone deficiency (Isojima and Yokoya 2017). Growth hormone deficiency has been reported in WHS/4p-. However, testing of the growth hormone axis is not done routinely in this population, although it has been recommended by a leading expert (Battaglia 2021).
The most striking feature of these growth charts is the small pubertal growth spurt. The pubertal growth acceleration in our population is less than in the typical population. This can be seen by comparing the rate of increase in height and the amount of height gained over the typical pubertal period by 4p- individuals (pale blue, green, red, and dark blue lines on the length for 2+ years graph, Figure 2) with the typical growth curve (purple lines on the length for 2+ years graph, Figure 2). In particular, this lack of acceleration raises a concern for hypogonadism (Balasubramanian and Crowley 2022). Individuals with 4p- are known to have an increased rate of genitourinary anomalies and renal insufficiency, which lends strength to this hypothesis. This finding clearly requires additional investigation.
Another surprising feature was the overlap of the charts with the typical growth range in infancy. Due to the method of data collection, the data on infant growth includes the participants who were the youngest at the time of enrollment and who are, therefore, the most recently managed. It is possible that innovations in feeding improved growth and weight gain in our youngest participants, skewing their growth toward the norm. Unfortunately, as stated in the methods section, we were unable to stratify by feeding intervention to scientifically assess the above.
The major strength of our study is the ability to do longitudinal analysis of data. Most patients submitted their growth data obtained directly from their medical records, usually with multiple sets of growth parameters per year starting from birth. Due to this, we were able to analyze the individual growth patterns over their entire lifespan. Another major strength of this study is that many of these individuals were adults, and we were able to assess individuals' growth through adolescence into adulthood, allowing us to address the question of height through puberty and final adult height.
Our study has limitations. The most major limitation is the subject number. WHS due to 4p- is rare, with an estimated incidence of 1/20,000–1/50,000 (Battaglia 2021; Battaglia et al. 2008), which makes recruitment of large cohorts very challenging. Secondly, our IRB procedures required comprehensive written consent (survey collection of data points was not allowed). The two existing growth curve studies, the Shimojima and Yamamoto (2012) and the Antonius et al. (2008), had similar limitations, with participant numbers of 34 and 101, respectively. Our sample size fits well in comparison with the two existing studies.
There are three critical impacts of the sample size limitation. First, and most importantly, due to the above-mentioned limitations, along with the known 2:1 female-to-male sex ratio in individuals with 4p-, we were unable to recruit enough male participants to create separate male and female curves. Second, many patients with 4p- have partial chromosome duplications along with the deletion. It is likely that duplications may have some effect on growth. Unfortunately, we did not have adequate numbers to separately analyze individuals with and without duplications or by specific duplication. Third, we were originally hoping to analyze subgroups by diet and feeding strategies, particularly the use of tube feeding, but our sample size did not allow for this.
Some of the data included in our length analysis was likely standing height and not true length. Standing height is shorter than length due to the effect of gravity. We were unable to differentiate in our data between length points and height points. It is likely that the inclusion of some height points in a length data set artificially decreases the overall length parameters. Also, some patients with 4p- have joint contractures and scoliosis. The presence of joint contractures or scoliosis will also artificially depress the length measurements for those individuals. Unfortunately, we were unable to identify the length measurements in our data set that may have been impacted by these associated musculoskeletal findings.
Our patient population was recruited from the 4p- Support Group. Therefore, this is not a randomly selected sample and has all of the potential limitations of a volunteer sample collected from an affiliative organization in the United States. Finally, we did not collect data on the race, ethnicity, or socioeconomic status of our participants, so these data must be considered with this limitation in mind.
In summary, these growth charts are an important addition to the available knowledge on growth in 4p−/Wolf-Hirschhorn syndrome, particularly because they address the previously unmet need for information on growth through puberty and final adult length.
Author Contributions
A.R.U.L.C.: conception of idea, data collection, writing drafts. A.L.: conception of idea, data collection, reading and editing drafts. T.C.C.: design and methods, analyzing data, reading and editing drafts. J.C.C.: conception of idea, reading and editing drafts.
Acknowledgments
The authors thank the many families of the 4p- support group who collected and shared their child's data. The authors also appreciate the guidance and advice from Drs. Agatino Battaglia and Karen Ho in the performance of the study.
Conflicts of Interest
The authors declare no conflicts of interest.
Open Research
Data Availability Statement
The data that support the findings of this study are available on request from the corresponding author. The data are not publicly available due to privacy or ethical restrictions.


