Prevalence, diagnostic features, and medical outcomes of females with Turner syndrome with a trisomy X cell line (45,X/47,XXX): Results from the InsighTS Registry
Abstract
Turner syndrome (TS) is defined by partial or complete absence of a sex chromosome. Little is known about the phenotype of individuals with TS mosaic with trisomy X (45,X/47,XXX or 45,X/46,XX/47,XXX) (~3% of TS). We compared the diagnostic, perinatal, medical, and neurodevelopmental comorbidities of mosaic 45,X/47,XXX (n = 35, 9.4%) with nonmosaic 45,X (n = 142) and mosaic 45,X/46,XX (n = 66). Females with 45,X/47,XXX had fewer neonatal concerns and lower prevalence of several TS-related diagnoses compared with 45,X; however the prevalence of neurodevelopmental and psychiatric diagnoses were not different. Compared to females with 45,X/46,XX, the 45,X/47,XXX group was significantly more likely to have structural renal anomalies (18% vs. 3%; p = 0.03). They were twice as likely to have congenital heart disease (32% vs. 15%, p = 0.08) and less likely to experience spontaneous menarche (46% vs. 75% of those over age 10, p = 0.06), although not statistically significant. Congenital anomalies, hypertension, and hearing loss were primarily attributable to a higher proportion of 45,X cells, while preserved ovarian function was most associated with a higher proportion of 46,XX cells. In this large TS cohort, 45,X/47,XXX was more common than previously reported, individuals were phenotypically less affected than those with 45,X, but did have trends for several more TS-related diagnoses than individuals with 45,X/46,XX.
1 INTRODUCTION
Turner syndrome (TS) is a rare genetic condition, occurring in 1 in 2000 females, caused by the partial or complete absence of the second sex chromosome in some or all cells. Females with TS are at an increased risk for several medical and neuropsychiatric comorbidities, the most common and well described in the literature being short stature, congenital heart disease, and ovarian failure (Gravholt et al., 2024). However, many other phenotypic associations exist, with notable variability across individuals. In contrast, Trisomy X syndrome (47,XXX) is a sex chromosome aneuploidy characterized by an additional X chromosome, which occurs in 1 in 1000 female live births (Stochholm et al., 2010). The phenotypic presentation of Trisomy X syndrome most commonly includes tall stature and neurocognitive deficits, but fewer and less frequent medical comorbidities in comparison to TS (Tartaglia et al., 2010; Wigby et al., 2016).
Individuals harboring both monosomy X (45,X) and trisomy X (47,XXX) cell lines represent only ~3% of all females with TS (Lim et al., 2017). With this estimate, mosaic 45,X/47,XXX affects only ~1250 individuals in the US, making it an ultra-rare condition (Michaeli et al., 2023) and thus, research is extremely limited. As such, most studies report 45,X/47,XXX findings together with mosaic 45,X/46,XX, which is a much more common mosaic karyotype in TS, accounting for up to 25% of all TS (Gravholt et al., 2024). While 45,X/46,XX has been well defined in literature to yield a milder phenotype for nearly all TS-related comorbidities (Bernard et al., 2016; Bryman et al., 2011; Cameron-Pimblett et al., 2017; El-Mansoury et al., 2007; Gravholt et al., 2024; Lim et al., 2017; Mondal et al., 2021; Tokita & Sybert, 2016), merging both mosaic karyotypes together minimizes the potential phenotypic impact of the 47,XXX cell line.
Literature specific to females with 45,X/47,XXX mosaicism is limited by exceptionally small sample sizes and an emphasis on height and fertility outcomes. Tang et al. (2019) summarizing 45 previously published cases of 45,X/47,XXX reported less severe phenotypic features (cardiovascular, renal, and skeletal anomalies) than those with nonmosaic 45,X. Ovarian function in 45,X/47,XXX females has been demonstrated to be variable, with the average age of ovarian failure estimated at 30 years of age, and spontaneous pubertal development and pregnancy being more common than in nonmosaic monosomy X (Loscalzo et al., 2005; Tang et al., 2019). Similarly, Blair et al. (2001) suggested that females with 45,X/47,XXX (n = 7) do not require estrogen therapy to undergo puberty and have fewer growth impairments than females with 45,X. Overall, these data support that females with 45,X/47,XXX are less impacted than those with nonmosaic 45,X. However, clinical outcomes have not been directly compared between individuals with 45,X/47,XXX and 45,X/46,XX karyotypes. Given a proportion of genes on supernumerary X chromosomes escape X-inactivation and individuals with 47,XXX have a unique phenotype, it is of interest to understand more how those with a Trisomy X cell line differ from those than those with 45,X/46,XX.
Understanding the genotype–phenotype associations specific to mosaic 45,X/47,XXX is needed to promote more individualized counseling and management. To address this gap, we utilized a national TS registry to access validated clinical data and compare the diagnostic, perinatal, neurodevelopmental and medical outcomes of individuals with mosaic 45,X/47,XXX to those with (1) nonmosaic 45,X and (2) mosaic 45,X/46,XX. This is not only the largest study to inform the clinical phenotype of 45,X/47,XXX, but it also serves as a model and proof of concept for studying other rare TS karyotypes where large knowledge gaps currently exist.
2 MATERIALS AND METHODS
2.1 Data source
Participants were enrolled through one of eight TS clinics participating in the InsighTS Registry, which has previously been described (Kanakatti Shankar et al., 2023). Briefly, the InsighTS Registry is a longitudinal study designed by stakeholders to centralize clinical data from a large, nationally representative, diverse cohort of patients with TS. Individuals are eligible for enrollment into the registry if they have a TS diagnosis as defined by the TS Clinical Practice Guidelines: phenotypic female with a karyotype of one X chromosome and complete or partial absence of the second sex chromosome, and one or more clinical manifestations of TS (Gravholt et al., 2024). For this study, participants with verified karyotypes of nonmosaic 45,X, mosaic 45,X/46,XX, and mosaic 45,X/47,XXX or 45,X/46,XX/47,XXX were included. This study was approved by the Colorado Multiple Institutional Review Board (COMIRB: 19-3027) which serves as the IRB of record for all registry enrollment sites, and informed consent was obtained for all participants.
2.2 Data collection
Data collection from the InsighTS Registry occurred from February 2021 to February 2023. Electronic health records (EHRs) were abstracted according to study-specific standard operating procedures (SOPs) and input into Research Electronic Data Capture (REDCap), a secure, password-protected, and HIPAA-compliant web application (Harris et al., 2009; Harris et al., 2019). Data were input and verified by trained study personnel and reviewed by a clinician if medical records were indeterminate. The SOP and ongoing communication between registry sites ensured input and verified data were standardized, accurate and reliable.
The number and relative proportion of unique cell lines for an individual was determined from clinically obtained genetic lab reports, including karyotype, chromosomal microarray, and/or fluorescence in situ hybridization (FISH). If more than one genetic test was done, cell line percentages were averaged. Participants were assigned a karyotype group: nonmosaic 45,X, mosaic 45,X/46,XX, and mosaic 45,X/47,XXX or 45,X/46,XX/47,XXX; participants with TS karyotypes not falling into one of these three groups were excluded from this analysis. For brevity, those with 45,X/46,XX/47,XXX will henceforth be grouped with and referred to as the 45,X/47,XXX group. Race and ethnicity was abstracted from the EHR or self-reported by the participant or their guardian. Data recorded included perinatal outcomes (maternal age at delivery, gestational age, birth weight, birth length, and specific pregnancy and neonatal complications), diagnostic information (diagnostic timing and reason(s) for genetic testing), medical diagnoses (binary yes/no for select comorbidities and the age of onset), gynecological/pubertal outcomes (pubertal timing and hormone replacement, primary ovarian insufficiency [POI]), and psychosocial diagnoses (presence of concern/diagnosis of a psychological condition). Spontaneous thelarche and menarche were defined as breast development or vaginal bleeding without exogenous estrogen exposure. If binary variables were not documented in the EHR, the individual was assumed to not have that condition.
2.3 Statistical analyses
Descriptive statistics were reported as the mean ± standard deviation, if normally distributed, or median with interquartile range (IQR), if non-normally distributed. Normality was determined using Shapiro–Wilks tests. Diagnostic history and perinatal outcomes were compared between karyotype groups for all individuals with available data using Kruskal–Wallis tests for continuous variables and Fisher's exact tests for categorical variables followed by pairwise comparisons. Due to association with age for some variables of interest, each subject with 45,X/47,XXX was age-matched (current age ± 1 year) to a subject from each of the other two groups (1:1:1) for medical, psychological, and gynecological outcomes. A match was not available for 45,X/46,XX in one adult 45,X/47,XXX case, therefore the age matching criteria was expanded to ±4 years. Prevalence between karyotypes of the outcomes were analyzed using generalized linear mixed models (GLMMs) with a logit link, accounting for current age, and included a random intercept for matched group. For outcomes where either 45,X/46,XX or 45,X/47,XXX significantly differed from 45,X, based on the GLMMs, odds ratio (OR) estimates and 95% confidence intervals (CI) were calculated, with respect to 45,X, and visualized with forest plots. When available, the age of onset for the medical outcomes were compared between groups using Kruskal–Wallis tests to test for overall and pairwise differences. Data were subset to complete case for each group of outcomes: enrollment, diagnostic, neonatal, medical, and pubertal. Likelihood-ratio tests (LRTs) were used to explore the added effect of the percent of 45,X and 46,XX cells, over karyotype alone, in predicting the GLMM outcomes that were found to be significant. When the percent of 45,X or 46,XX cells significantly improved model fit, as determined by the LRTs, an optimal predictive cut-point was determined by maximizing the sum of sensitivity and specificity. Given the largely exploratory nature of this study, we set alpha at a type I error rate of 0.05 for all outcomes without multiplicity adjustment. Statistical analyses were conducted in R version 4.2.2 (R Core Team, 2022).
3 RESULTS
3.1 Participant characteristics
Overall, 35 of 372 (9.4%) participants in the InsighTS Registry had a confirmed TS karyotype with a Trisomy X cell line, 30 with 45,X/47,XXX and 5 with 45,X/46,XX/47,XXX (from here on referred to as 45,X/47,XXX). Demographics and characteristics at the time of enrollment for these individuals compared to both 45,X (n = 142) and 45,X/46,XX (n = 66) karyotype groups are presented in Table 1. This sample was predominately pediatric with racial, ethnic, and geographic diversity. No differences between the age of enrollment, race, or ethnicity were present between karyotype groups. The median weight and BMI z-scores at the time of enrollment into the registry were not statistically different between karyotype groups. Significant differences between karyotype groups were identified in height z-scores.
| 45,X/47,XXX | 45,X | 45,X/46,XX | Kruskal–Wallis/Fisher's exact | |
|---|---|---|---|---|
| (a) (N = 35) | (b) (N = 142) | (c) (N = 66) | p-value | |
| Prevalence of karyotype in the InsighTS Registry | 9.4% | 37.0% | 17.2% | <0.001 |
| Age at enrollment (years) | 10 [5.5, 14] | 9 [4, 15] | 9 [2, 15] | 0.777 |
| BMI z-score at enrollment | 0.4 [−0.9, 0.9] | 0.6 [0.1, 1.2] | 0.5 [0, 1.5] | 0.485 |
| Height z-score at enrollment | −1.5 [−2.1, −0.7] | −1.8 [−3, −1.1] | −0.8 [−2.1, 0.1] | 0.011 |
| Weight z-score at enrollment | −0.4 [−1.5, 0.1] | −0.6 [−1.8, 0.3] | −0.3 [−1.3, 1.2] | 0.472 |
| Race | 0.082 | |||
| American Indian or Alaskan Native | 1 (2.9%) | 2 (1.4%) | 1 (1.5%) | |
| Asian | 5 (14.3%) | 5 (3.5%) | 1 (1.5%) | |
| Black or African American | 1 (2.9%) | 11 (7.7%) | 8 (12.1%) | |
| Native Hawaiian or Other Pacific Islander | 0 (0%) | 2 (1.4%) | 0 (0%) | |
| White | 26 (74.3%) | 100 (70.4%) | 48 (72.7%) | |
| Other | 2 (5.7%) | 17 (12.0%) | 3 (4.5%) | |
| Unknown/not reported | 0 (0%) | 5 (3.5%) | 5 (7.6%) | |
| Ethnicity | 0.762 | |||
| Hispanic or Latinx | 8 (22.9%) | 32 (22.5%) | 10 (15.2%) | |
| Non-Hispanic or Latinx | 25 (71.4%) | 104 (73.2%) | 53 (80.3%) | |
| Unknown/not reported | 2 (5.7%) | 6 (4.2%) | 3 (4.5%) | |
| Enrollment site | 0.014 | |||
| Children's Hospital Colorado | 18 (51.4%) | 73 (51.4%) | 24 (36.4%) | |
| Children's Hospital of Philadelphia | 4 (11.4%) | 21 (14.8%) | 20 (30.3%) | |
| Children's National (DC) | 2 (5.7%) | 9 (6.3%) | 2 (3.0%) | |
| Lurie Children's (Chicago) | 2 (5.7%) | 6 (4.2%) | 5 (7.6%) | |
| University of North Carolina Chapel Hill | 3 (8.6%) | 22 (15.5%) | 3 (4.5%) | |
| University of Texas Health Science Center at Houston | 0 (0%) | 1 (0.7%) | 2 (3.0%) | |
| Cincinnati Children's Hospital Medical Center | 1 (2.9%) | 0 (0%) | 0 (0%) | |
| Seattle Children's | 1 (2.9%) | 1 (0.7%) | 1 (1.5%) | |
| University of Iowa | 0 (0%) | 3 (2.1%) | 5 (7.6%) | |
| University of California San Diego | 4 (11.4%) | 6 (4.2%) | 4 (6.1%) |
- Note: Continuous variables are reported as median [Quartile 1, Quartile 3]. Categorical variables are listed as number (%). Bold text indicates statistical significance alpha (p < 0.05).
- Abbreviations: BMI, body mass index; DC, District of Columbia.
3.2 TS diagnosis
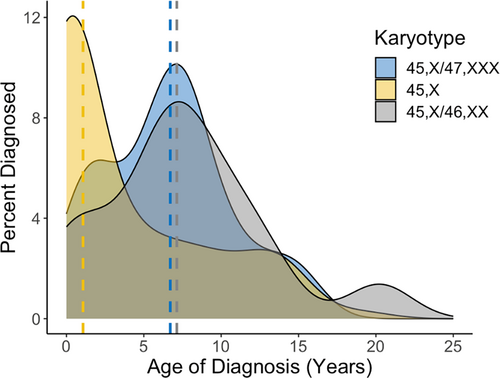
The diagnostic histories for all karyotype groups are outlined in Table 2 and postnatal diagnostic timing is demonstrated by Figure 1. A higher proportion of 45,X/47,XXX females (65.7%) were diagnosed postnatally than those with 45,X/46,XX (45.5%; p = 0.062), although this did not reach statistical significance. The median age of postnatal TS diagnosis for females with 45,X/47,XXX was 6.7 [3.4, 8.2] years, which was significantly older than postnatally diagnosed 45,X females at 1.1 [0.0, 7.5] years, (p = 0.003).
| 45,X/47,XXX | 45,X | 45,X/46,XX | Kruskal–Wallis/Fisher's exact | (a) versus (b) | (a) versus (c) | |
|---|---|---|---|---|---|---|
| (a) (N = 35) | (b) (N = 142) | (c) (N = 66) | p-value | p-value | p-value | |
| Percent 45,X cells | 55 [17, 72.3] | 100 [100, 100] | 27.5 [16, 48.8] | <0.001 | <0.001 | 0.037 |
| 46,XX cell line present | 6 (17.1%) | 0 (0%) | 66 (100%) | <0.001 | <0.001 | <0.001 |
| Percent 46,XX cells, if present | 9.2 [3.8, 76.5] | 0 [0, 0] | 70 [45.6, 84] | 0.187 | - | 0.187 |
| Diagnosis | ||||||
| Prenatal | 12 (34.3%) | 59 (41.5%) | 36 (54.5%) | 0.100 | 0.564 | 0.062 |
| Postnatal | 23 (65.7%) | 82 (57.7%) | 30 (45.5%) | 0.120 | 0.446 | 0.062 |
| Age of postnatal diagnosis | 6.7 [3.4, 8.2] | 1.1 [0, 7.5] | 7.1 [4.7, 10.5] | <0.001 | 0.003 | 0.402 |
| Prenatal reason | N = 12 | N = 59 | N = 36 | |||
|---|---|---|---|---|---|---|
| Routine/elective | 6 (50.0%) | 10 (16.9%) | 17 (47.2%) | 0.002 | 0.022 | 1.000 |
| Advanced maternal age | 0 (0%) | 7 (11.9%) | 5 (13.9%) | 0.556 | 0.593 | 0.312 |
| Abnormal triple/quad lab or abnormal US | 5 (41.7%) | 39 (66.1%) | 9 (22.2%) | <0.001 | 0.190 | 0.299 |
| High risk for aneuploidy | 0 (0%) | 0 (0%) | 2 (5.6%) | 0.199 | 1.000 | 1.000 |
| Unknown | 1 (8.3%) | 3 (5.1%) | 3 (11.1%) | 0.623 | 0.532 | 1.000 |
| Postnatal reason | N = 23 | N = 82 | N = 30 | |||
|---|---|---|---|---|---|---|
| Congenital anomaly | 0 (0%) | 23 (28.0%) | 4 (13.3%) | 0.003 | 0.003 | 0.124 |
| Dysmorphic features | 1 (4.3%) | 35 (41.5%) | 4 (13.3%) | <0.001 | <0.001 | 0.374 |
| Developmental delay or learning disability | 5 (21.7%) | 7 (8.5%) | 2 (6.7%) | 0.175 | 0.130 | 0.218 |
| Short stature | 18 (78.3%) | 33 (39.0%) | 22 (73.3%) | <0.001 | 0.002 | 0.756 |
| Delayed puberty/amenorrhea | 2 (8.7%) | 3 (3.7%) | 2 (6.7%) | 0.480 | 0.301 | 1.000 |
| Incidental finding | 0 (0%) | 1 (1.2%) | 1 (0%) | 0.647 | 1.000 | 1.000 |
| Failure to thrive/poor feeding | 1 (4.3%) | 1 (1.2%) | 0 (0%) | 0.371 | 0.392 | 0.434 |
| Seizures | 0 (0%) | 1 (1.2%) | 0 (0%) | 1.000 | 1.000 | 1.000 |
| Unknown | 1 (4.3%) | 3 (4.9%) | 2 (10.0%) | 0.834 | 1.000 | 1.000 |
- Note: Continuous variables are reported as the median [Quartile 1, Quartile 3]. Categorical variables are listed as number (%). There may be >1 reasons for postnatal diagnosis. The following reasons for postnatal diagnosis were omitted from the table given n = 0 across all karyotype groups: infertility and autoimmune disorders. Bold text indicates statistically significant p-value (p < 0.05).
- Abbreviation: US, ultrasound.
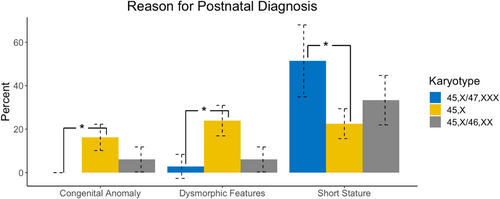
Indications for postnatal diagnoses are shown in Figure 2. Among individuals postnatally diagnosed, females with 45,X/47,XXX were significantly less likely than 45,X to be diagnosed secondary to congenital anomalies (0% vs. 28%; p = 0.003) or dysmorphic features (4.3% vs. 41.5%; p < 0.001). Congruent with their later age at diagnosis, females with 45,X/47,XXX were more likely than 45,X to have received genetic testing and a diagnosis of TS secondary to short stature (78.3% vs. 39.0%; p = 0.002). There were no differences between 45,X/47,XXX and 45,X/46,XX groups for the indication of diagnosis.
3.3 Perinatal outcomes
Birth outcomes and complications during pregnancy (both fetal and maternal), shown in Table 3, were similar between all groups, apart from cystic hygroma/fetal hydrops, which was significantly less common in fetuses with 45,X/47,XXX compared to 45,X (2.9% vs. 18.0%; p = 0.027). Postnatally, neonates with 45,X/47,XXX were significantly less likely to spend >24 h in the NICU (23.5% vs. 45.0%; p = 0.034), have a cardiac condition (11.8% vs. 45.0%; p < 0.001) or have lymphedema (0% vs. 36.9%; p < 0.001) compared to those with 45,X. There were no statistical differences in neonatal outcomes between the 45,X/47,XXX and 45,X/46,XX cohorts.
| 45,X/47,XXX | 45,X | 45,X/46,XX | Kruskal–Wallis/Fisher's exact | (a) versus (b) | (a) versus (c) | ||
|---|---|---|---|---|---|---|---|
| (a) (N = 34) | (b) (N = 111) | (c) (N = 55) | p-value | p-value | p-value | ||
| Birth length (cm) | 48.3 [46.3, 48.3] | 47 [44.5, 48.3] | 48.3 [46.7, 49.5] | 0.104 | 0.278 | 0.550 | |
| Birth weight (kg) | 2.8 [2.6, 3.2] | 2.9 [2.4, 3.2] | 3.1 [2.7, 3.4] | 0.301 | 0.974 | 0.218 | |
| Gestational age (weeks) | 38 [36, 40] | 38 [37, 39] | 39 [37, 39] | 0.538 | 0.735 | 0.922 | |
| Maternal age at birth (years) | 32 [28.5, 34.5] | 30 [25.8, 35] | 32 [28, 35] | 0.222 | 0.222 | 0.911 | |
| Fetal complications | |||||||
| None | 17 (50.0%) | 45 (40.5%) | 29 (52.7%) | 0.288 | 0.428 | 0.830 | |
| Any | 13 (38.2%) | 59 (53.2%) | 21 (38.2%) | 0.112 | 0.170 | 1.000 | |
| Cystic Hygroma or Fetal Hydrops | 1 (2.9%) | 20 (18.0%) | 0 (0%) | <0.001 | 0.027 | 0.382 | |
| IUGR/poor growth | 6 (17.6%) | 14 (12.6%) | 6 (10.9%) | 0.685 | 0.569 | 0.524 | |
| Congenital heart malformation | 3 (8.8%) | 23 (20.7%) | 6 (10.9%) | 0.150 | 0.132 | 1.000 | |
| Renal anomaly | 2 (5.9%) | 7 (6.3%) | 2 (3.6%) | 0.846 | 1.000 | 0.635 | |
| Oligohydramnios | 2 (5.9%) | 5 (4.5%) | 4 (7.3%) | 0.699 | 0.666 | 1.000 | |
| Polyhydramnios | 0 (0%) | 0 (0%) | 2 (3.6%) | 0.107 | 1.000 | 0.522 | |
| Breech Presentation | 0 (0%) | 3 (2.7%) | 2 (3.6%) | 0.834 | 1.000 | 0.522 | |
| Other | 6 (17.6%) | 20 (18.0%) | 10 (18.2%) | 1.000 | 1.000 | 1.000 | |
| Maternal complications | |||||||
| None | 18 (52.9%) | 61 (55.0%) | 23 (41.8%) | 0.283 | 0.847 | 0.383 | |
| Any | 5 (14.7%) | 27 (24.3%) | 18 (32.7%) | 0.165 | 0.344 | 0.081 | |
| Gestational diabetes | 1 (2.9%) | 8 (7.2%) | 4 (7.3%) | 0.785 | 0.686 | 0.645 | |
| Hypertension/pre-eclampsia | 1 (2.9%) | 7 (6.3%) | 5 (9.1%) | 0.526 | 0.681 | 0.401 | |
| Maternal infection (systemic) | 0 (0%) | 2 (1.8%) | 0 (0%) | 1.000 | 1.000 | 1.000 | |
| Premature labor | 3 (8.8%) | 12 (10.8%) | 8 (14.5%) | 0.727 | 1.000 | 0.521 | |
| Alcohol/drug use during pregnancy | 0 (0%) | 3 (2.7%) | 3 (5.5%) | 0.452 | 1.000 | 0.284 | |
| No or Late Prenatal Care | 0 (0%) | 2 (1.8%) | 1 (1.8%) | 1.000 | 1.000 | 1.000 | |
| Other | 6 (17.6%) | 18 (16.2%) | 13 (23.6%) | 0.488 | 0.798 | 0.600 | |
| Neonatal information | |||||||
| Passed newborn hearing screen | 34 (100%) | 105 (94.6%) | 53 (96.4%) | 0.363 | 0.336 | 1.000 | |
| NICU admission (>24 h) | 8 (23.5%) | 50 (45.0%) | 17 (30.9%) | 0.055 | 0.034 | 0.613 | |
| Hypoglycemia | 5 (14.7%) | 20 (18.0%) | 8 (14.5%) | 0.827 | 0.794 | 1.000 | |
| Respiratory difficulties | 3 (8.8%) | 26 (23.4%) | 8 (14.5%) | 0.130 | 0.077 | 0.511 | |
| Feeding difficulties | 10 (29.4%) | 36 (32.4%) | 11 (20.0%) | 0.187 | 0.827 | 0.306 | |
| Cardiac conditions | 4 (11.8%) | 50 (45.0%) | 15 (27.3%) | 0.001 | <0.001 | 0.169 | |
| Hyperbilirubinemia | 2 (5.9%) | 14 (12.6%) | 5 (9.1%) | 0.559 | 0.355 | 0.698 | |
| Lymphedema | 0 (0%) | 41 (36.9%) | 1 (1.8%) | <0.001 | <0.001 | 1.000 | |
| Sepsis or other systemic infection | 2 (5.9%) | 6 (5.4%) | 2 (3.6%) | 0.909 | 1.000 | 0.644 | |
| Chylothorax | 0 (0%) | 6 (5.4%) | 0 (0%) | 0.150 | 0.334 | 1.000 | |
| Other | 3 (8.8%) | 25 (22.5%) | 10 (18.2%) | 0.228 | 0.117 | 0.342 | |
- Note: Continuous variables are reported as median [Quartile 1, Quartile 3]. Categorical variables are listed as no. (%). Bold text indicates statistical significance (p < 0.05).
- Abbreviations: IUGR, intrauterine growth restriction; NICU, neonatal intensive care unit.
3.4 Medical outcomes
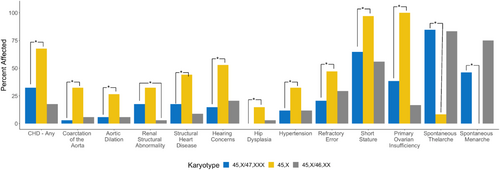
Compared to females with 45,X, females with 45,X/47,XXX karyotypes were less likely to have aortic dilation (27% vs. 5.9%; p = 0.042), aortic coarctation (32% vs. 2.9%; p < 0.001), structural heart disease (68% vs. 32%; p = 0.016), short stature (97% vs. 65%; p < 0.001), a swallowing disorder (21% vs. 2.9%; p = 0.043), hearing loss (53% vs. 15%; p = 0.002), hip dysplasia (15% vs. 0%; p = 0.006), hypertension (32% vs. 12%; p = 0.047), and refractory error (47% vs. 21%; p < 0.001). Compared to females with 45,X/46,XX, females with 45,X/47,XXX were more likely to have structural renal abnormalities (18% vs. 2.9%; p = 0.032), and structural heart disease (32% vs. 15%, p = 0.077), although the latter did not reach statistical significance. Other medical outcomes were not significantly different between karyotype groups. No differences were observed between 45,X/47,XXX and the other two karyotype groups for any neurodevelopmental or psychological diagnoses. All medical and psychological diagnoses evaluated are included in Table S1 and outcomes statistically different from the 45,X/47,XXX group are included in Figure 3. Odds and 95% CIs compared to 45,X can be visualized in Figures 4 and 5.
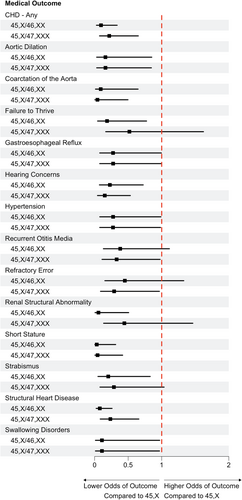
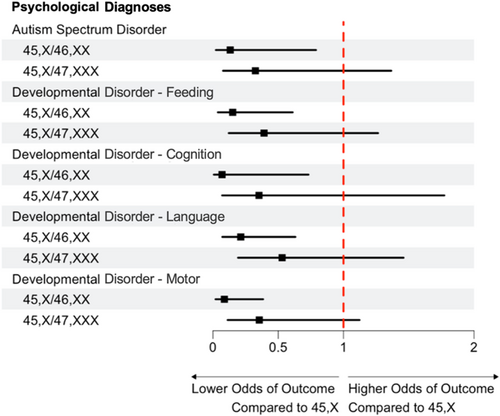
Ages at diagnosis of specific medical outcomes are also presented in Table S1. Of those who had aortic dilation, age at diagnosis was older in females with 45,X/47,XXX (15.4 [14.9, 15.8] years) than in females with 45,X (5.7 [3.8, 7.1]; p = 0.034). Age at diagnosis of failure to thrive was also later in the 45,X/47,XXX group (2.1 [1.3, 2.4] years) as compared to those with 45,X (0.2 [0.1, 0.5] years; p = 0.011). For eczema, however, age at diagnosis was earlier in the 45,X/47,XXX group (1.5 [1.2, 2.2] years) as compared to those with 45,X (8.2 [4.7, 11.3] years; p = 0.028). There were no significant differences in ages at diagnoses of specific medical outcomes between 45,X/47,XXX and 45,X/46,XX groups.
3.5 Pubertal outcomes
Ovarian function and pubertal outcomes for those >10 years of age are presented in Table 4 and Figure 6. Compared to the 45,X group, females with 45,X/47,XXX were less likely to have POI (38.5% vs. 100%; p < 0.001) and more likely to have spontaneous thelarche (84.6% vs. 8.3%; p = 0.003) and spontaneous menarche (46.2% vs. 0%; p = 0.002). The age of thelarche was also significantly younger in those with 45,X/47,XXX (11.6 ± 1.3 years) than those with 45,X (13.4 ± 1.15; p = 0.003), although the age at menarche was not significantly different. When compared to 45,X/46,XX, the prevalence of spontaneous menarche was lower but did not reach statistical significance (46.2% in 45,X/47,XXX vs. 75.0% in 45,X/46,XX; p = 0.061).
| 45,X/47,XXX | 45,X | 45,X/46,XX | Type III test | (a) versus (b) | (a) versus (c) | |
|---|---|---|---|---|---|---|
| (a) (N = 13) | (b) (N = 12) | (c) (N = 12) | p-value | p-value | p-value | |
| Primary ovarian insufficiency | 5 (38.5%) | 12 (100%) | 2 (16.7%) | <0.001 | <0.001 | 0.242 |
| Pubarche | 10 (76.9%) | 10 (83.3%) | 11 (91.7%) | 0.084 | 0.303 | 1.000 |
| Age | 12.1 (1.3) | 12.7 (0.9) | 11.5 (1.9) | 0.235 | 0.142 | 0.711 |
| Thelarche | 13 (100%) | 11 (91.7%) | 12 (100%) | 0.504 | 0.867 | 1.000 |
| Age | 11.6 (1.3) | 13.4 (1.2) | 11.1 (1.7) | 0.005 | 0.003 | 0.563 |
| Spontaneous thelarche | 11 (84.6%) | 1 (8.3%) | 10 (83.3%) | 0.003 | 0.003 | 0.668 |
| Menarche | 11 (84.6%) | 9 (75.0%) | 10 (83.3%) | 0.574 | 0.224 | 0.752 |
| Age | 14.4 (3.3) | 15.8 (2.7) | 13.0 (2.0) | 0.085 | 0.126 | 0.382 |
| Spontaneous menarche | 6 (46.2%) | 0 (0%) | 8 (75.0%) | <0.001 | 0.002 | 0.061 |
- Note: Characteristics of our sample of girls with TS by karyotype group. Continuous variables are reported as mean (standard deviation). Categorical variables are listed as no. (%). Bold text indicates statistical significance (p < 0.05).
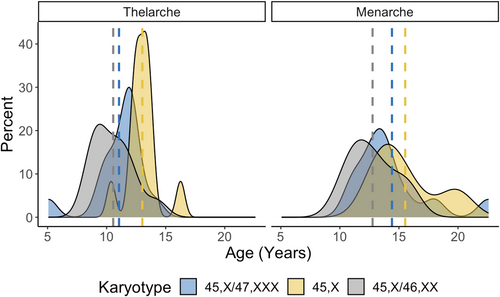
The proportion of monosomy X cells was greater in the 45,X/47,XXX group (55.0% [17, 72.3]) compared to the 45,X/46,XX group (27.5% [16, 48.8], p = 0.037; Table 2). When including either the proportion of 45,X cells or the proportion of 46,XX cells in the models for medical outcomes, the effect of the karyotype group variable was attenuated. LRT found that coarctation of the aorta, renal structural anomaly, hearing loss, and hypertension were primarily associated with a greater proportion of 45,X cells rather than the proportion of 46,XX cells or the karyotype group. Within this cohort, having ≥70% of 45,X cells was 90% sensitive and 60% specific for predicting a diagnosis of hypertension, with an overall accuracy of 90% (Table 5). In contrast, spontaneous thelarche and menarche were most dependent on the proportion of typical 46,XX cells, with ≥30% 46,XX cells predicting spontaneous menarche with 90% sensitivity, 100% specificity, and 92% overall accuracy. Table 5 includes the model statistics for the variables with ≥70% accuracy for either 45,X or 46,XX cell proportions.
| Risk attributable to % 45,X cells | p-value | Cut point | Sensitivity | Specificity | Accuracy |
|---|---|---|---|---|---|
| Coarctation of the aorta | 0.009 | ≥80% 45,X | 0.923 | 0.674 | 0.707 |
| Renal structural abnormality | 0.004 | ≥90% 45,X | 0.778 | 0.728 | 0.737 |
| Hearing loss | 0.003 | ≥65% 45,X | 0.862 | 0.632 | 0.701 |
| Hypertension | 0.001 | ≥70% 45,X | 0.895 | 0.600 | 0.895 |
| Protection attributable to % 46,XX cells | p-value | Cut Point | Sensitivity | Specificity | Accuracy |
|---|---|---|---|---|---|
| Spontaneous thelarche | 0.010 | ≥22% 46,XX | 0.833 | 1 | 0.846 |
| Spontaneous menarche | 0.002 | ≥30% 46,XX | 0.900 | 1 | 0.917 |
- Note: Table includes only the variables with model accuracy ≥70%. Bold text indicates statistical significance (p < 0.05).
- a Optimal is defined as the maximized sum of sensitivity and specificity across potential cut points.
Given the rareness of the 45,X/47,XXX karyotype and the exploratory nature of this study, the results presented in the tables were not adjusted for False Discovery Rate (FDR). When adjusting for FDR, the outcomes that remained different between the 45,X/47,XXX and 45,X groups were cardiac concerns in neonates, lymphedema in neonates, short stature, aortic coarctation, POI and spontaneous thelarche. No outcomes between the two mosaic karyotype groups remained significant when the analyses were FDR adjusted.
4 DISCUSSION
The aim of this investigation was to describe the prevalence and phenotype of females with 45,X/47,XXX using a large, nationally representative TS cohort from the InsighTS Registry. To the best of our knowledge, this is the largest 45,X/47,XXX study to date. In addition to supporting prior evidence from smaller studies that mosaic 45,X/47,XXX has a milder phenotype than nonmosaic 45,X, our results confer novel findings on the prevalence of 45,X/47,XXX as well as some potentially important differences when compared to mosaic 45,X/46,XX. These findings support continued work in understanding how mosaicism with two aberrant cell lines may affect phenotypic outcomes. These differences are relevant when counseling patients and families regarding expectations for an individual with 45,X/47,XXX karyotype. Further study of the implications of the trisomy X cell line are needed.
While previous literature reported the prevalence of 45,X/47,XXX to be ~3% (Gravholt et al., 2024) of all TS cases (or ~1 in 75,000 females), our data are above this estimate demonstrating that this karyotype may be more prevalent at 9.4% of TS cases, (or ~1 in 22,000 females). This observation is supported by Wang et al who recently described a large cohort (n = 389) of females with TS from China and found 31 (8.0%) to have a 47,XXX mosaicism (Gaowei Wang et al., 2024). These more recent higher estimates may potentially be due to increased sensitivity in genetic testing modalities or increased use of genetic testing in clinical practice in general, promoting identification of less “classic” TS cases. For example, routine use of prenatal cell-free screening can incidentally identify monosomy and/or trisomy X in the fetus or the mother (Dowlut-McElroy et al., 2022), potentially resulting in increased ascertainment of individuals with mosaic TS. The samples from Wang et al and our study, however, are both representative only of individuals diagnosed with TS, so the true prevalence of 45,X/47,XXX may be higher considering many individuals are undiagnosed (Gunther et al., 2004).
As anticipated, there was a lower prevalence of multiple TS-associated medical outcomes in females with 45,X/47,XXX when compared to females with 45,X. Importantly, however, psychological concerns were common in all three groups and did not significantly differ. In 2001, Sybert looked at psychiatric diagnoses in 17 of her own clinical patients, and in 38 individuals from published reports (all of which had 45,X/46,XX/47,XXX or 45,X/47,XXX). Psychiatric diagnoses in these individuals ranged from 9% (1/11 clinical patients) to 28% (2/7 published cases) and intellectual disability ranged from 0% (0/11 clinical patients) to 42.8% (3/7 published cases) (Sybert, 2002). Our results are higher than this estimate for psychological diagnoses, however indications for genetic testing in those with 45,X/47,XXX did trend toward learning disabilities or developmental delays (21.7% vs. 8.5% in 45,X and 6.7% in 45,X/46,XX), potentially biasing our cohort to have a more prominent neurodevelopmental and psychological profile than individuals with 45,X/47,XXX in general. Given that Trisomy X syndrome is associated with developmental delays and a neurocognitive profile unique from TS, (Tartaglia et al., 2010) deeper phenotyping of the neuropsychological profiles in individuals with 45,X/47,XXX is needed.
For the first time, we found differences for specific medical outcomes between the mosaic 45,X/47,XXX and 45,X/46,XX groups. Females with 45,X/47,XXX were more likely to have a renal anomaly, with trends toward more structural heart disease and ovarian dysfunction than those with 45,X/46,XX. Since the 47,XXX karyotype is associated with congenital malformations and ovarian dysfunction (Davis et al., 2020; Wigby et al., 2016), it is perhaps not surprising that these conditions were more prevalent among the 45,X/47,XXX group than those mosaic with a typical cell line. However, Tang et al.'s review of 45,X/47,XXX reported cardiovascular and renal anomalies in only 2 of 23 (8.7%) females with the 45,X/47,XXX karyotype (Tang et al., 2019). Larger sample sizes as well as deeper phenotyping will be needed to confirm and expand our findings.
In contrast to what we expected, we found short stature to occur at similar rates between the 45,X/47,XXX group compared to their age-matched controls with 45,X/46,XX. 47,XXX is typically associated with taller stature due to three copies of the SHOX gene, while the total or partial loss of this gene in TS is known to lead to growth failure and other skeletal anomalies (Clement-Jones et al., 2000; Fukami et al., 2016). Although it was not statistically significant, girls with a trisomy X cell line were diagnosed with short stature 3 years earlier than girls with 45,X/46,XX. This potentially could be due to the higher proportion of 45,X cells in the 45,X/47,XXX group, however short stature was not independently related to the percent of 45,X cells in our analysis. Growth trajectories, use of growth promoting medications, and ultimately adult height outcomes will be interesting to investigate as this cohort ages.
When comparing different karyotype groups within TS and their respective prognoses, it is important to acknowledge that proportion of the 45,X cell line vary by individual and likely throughout the body (Nazarenko et al., 1999). In our sample, females with 45,X/47,XXX had greater proportions of the 45,X cell line (51%) than those with 45,X/46,XX (28%). This difference may just be by chance in our sample; however it may have an underlying biological etiology. The 45,X cell line, similar to the 47,XXX cell line, is a result of nondisjunction during meiosis or early postzygotic development (Alvarez-Nava & Lanes, 2018) and mosaicism can be a result of postzygotic nondisjunction, anaphase lagging, or endoreplication (Taylor et al., 2014). The prolonged cell cycle hypothesis (Barrenas et al., 2000), however, provides an interesting perspective on the advantages of a 46,XX cell line on the genetic composition females with TS. It has been reported that the cell cycle time in 45,X cell lines is longer than that of those with 46,XX. Over time the 45,X cell line cannot proliferate at the rate of, and is “outcompeted” by, the 46,XX cell line (Alvarez-Nava & Soto-Quintana, 2022; Levine & Holland, 2018). No studies to our knowledge have investigated the cell cycle timing in 47,XXX; however, Paton et al. did compare the rates of euploid cells (46,XY) with the trisomic cells (47,XY,+21 and 47,XY,+18), and found increased cycle time in the trisomic groups (Paton et al., 1974). Therefore, it is possible, through the lens of the prolonged cell cycle hypothesis, that our 45,X/47,XXX group has significantly greater proportions of the 45,X cell than our 45,X/46,XX group because of the favorable proliferation rate of cells with two typical sex chromosomes.
Whether or not mosaicism with a 47,XXX cell line is predisposed to have a higher 45,X proportion, the phenotypic differences we found between the two mosaic groups may be attributed to the higher percent of the monosomy X cell line in our sample. Given that some features of TS are hypothesized to be secondary to haploinsufficiency of typically biallelically expressed genes on the sex chromosomes (Alvarez-Nava & Lanes, 2018; Fukami et al., 2016), a higher proportion of 45,X cell lines would be expected to be associated with higher risk of comorbidities. Our results confirmed this for several diagnoses including congenital anomalies, hearing loss, and hypertension, with a conclusion these TS features are secondary to the abnormal monosomy X cell line. In contrast, ovarian function was more dependent on the presence and proportion of typical 46,XX cells, therefore POI in TS is likely due to the absence of 46,XX cells rather than the presence of 45,X cells. We acknowledge it is difficult to make conclusions about the differences of 45,X percentages between our karyotype groups because cell line proportions differ between tissues and can change with age (Denes et al., 2015; Nazarenko et al., 1999). It also is important to note that the detection and accuracy of cell line proportions is largely dependent on the sensitivity of the genetic test used, which varied in our sample.
These results have several clinical implications. While current TS clinical practice guidelines recommend evaluation for these comorbidities independent of karyotype, there has been discussion of reducing screening recommendations for those with mosaic karyotypes due to the lower risk for comorbidities. Our data would caution against reduced screening for those with a trisomy X cell line, at least for congenital anomalies, neuropsychological conditions, and ovarian function. Given the median age in this analysis was quite young, longitudinal follow-up may also reveal additional differences that emerge with age and will be important data to evaluate prior to adopting less stringent surveillance recommendations. Furthermore, the proportion of abnormal 45,X and/or 46,XX cells may have more clinical impact than the karyotype group itself.
4.1 Limitations
The 45,X/47,XXX karyotype is extremely rare. Although our study compiles the largest cohort of females with 45,X/47,XXX in literature to our knowledge, the sample size remains small and future analyses of this cohort will benefit from ongoing enrollment of participants to the InsighTS Registry. Given that recruitment for this study required participants to be seen clinically a TS clinic, our cohort may not be comprehensive of the females with TS who do not have access or otherwise do not receive care from a TS clinic. This study also relies on abstraction of information from the EHR which may be limited by missing or incomplete information. In addition, our sample is predominately pediatric. As some medical conditions become more prevalent with age, the prevalence of outcomes in our study are likely lower than the lifetime prevalence, so caution should be used in directly using these numbers in a clinical context. Finally, this study relies on the medical outcomes predominately from those diagnosed prenatally or in childhood. It is known that not all females with TS receive a diagnosis, especially those who have mosaicism and are less are phenotypically affected. Therefore, these results may not be generalizable to the entire 45,X/47,XXX population, such as asymptomatic adult women incidentally identified to have this karyotype in pregnancy through prenatal cell-free DNA screening.
5 CONCLUSION
The karyotype 45,X/47,XXX represents 3%–10% of individuals with TS and in general results in a less complex phenotype than nonmosaic 45,X. However, even in our small sample we observed several conditions that were more common among individuals with 47,XXX mosaicism compared to individuals with 45,X/46,XX mosaicism, highlighting that 45,X/47,XXX is a unique karyotype that should not be merged with 45,X/46,XX as often occurs in both research and clinical practice. This investigation serves as an example of how the large and diverse InsighTS Registry can inform genotype–phenotype associations for rarer karyotypes that historically have had too small of sample sizes to draw conclusions. Importantly, our current sample is mostly pediatric, and future plans include recruitment of more adults and examination of the longitudinal progression of medical outcomes in our existing cohort.
AUTHOR CONTRIBUTIONS
NK and SMD conceived of study. NK, AEC, VB, JRL, WJB, KOK, RKS, CTP, PYF, SKP, IGL, SH, NT, and SMD enrolled subjects and collected data from health records. SB and SMD conceptualized the analytical plan. SB analyzed the data and made all figures within the manuscript. MG and KCR serve on advocacy groups that provided financial and organizational support. NK and SMD wrote the manuscript and all authors read, edited, and approved the final manuscript.
FUNDING INFORMATION
The InsighTS Registry has received financial support from the nonprofit advocacy organizations Turner Syndrome Global Alliance and Turner Syndrome Colorado. Additional funding that supported this work includes the NIDDK (K23 DK134810, CTP), the National Science Foundation (2129088, SKP), the Boettcher Foundation, and the NIH/NCATS Colorado CTSA (UM1TR004399).
CONFLICT OF INTEREST STATEMENT
WJB, JRL, KOK, PYF, IGL, and SMD are site investigators for Ascendis Pharma clinical trial in Turner syndrome and JRL has received consultant funds. VB is involved in research sponsored by Pfizer and Lumos. RKS has received research funding from Biomarin for an investigator-initiated study. IGL and VB are involved in research sponsored by Novo Nordisk. None of these companies had any involvement in the study.
Open Research
DATA AVAILABILITY STATEMENT
The data that support the findings of this study are available from the corresponding author upon reasonable request.


