Nutritional status and its association with physical fitness, physical activity and parasitological indicators in youths from rural mozambique
ABSTRACT
Background
Little information exists about the relationship of nutritional status and motor performance conditional on asymptomatic parasitemia in rural African children.
Aims
The aims of this study were to (1) determine if malnourished youths from rural African areas have lower levels of physical fitness (PF) and physical activity (PA) compared to normal weight youths, (2) verify the biological relevance of anthropometric criteria used to classify nutritional status in youth, and (3) determine the prevalence of parasitological indicators, and its association with nutritional status and PF.
Methods
The sample comprised 794 youths (6–17 years) from Calanga, a rural community in Mozambique. PF tests were selected from standardized test batteries, and PA was estimated by accelerometry. Nutritional status was defined according to WHO recommendations for stunting, wasting and normal weight. Parasitological indicators were determined based on stool specimens' analysis.
Results
In general terms the normal group out-performed the other nutritional groups (stunted and wasted) for PF. However, no significant differences were found for PA among nutritional groups. There were also no significant differences in prevalence of intestinal parasites.
Conclusions
Nutritional status was not associated with PA levels or the prevalence of parasitological indicators in youth, but was related to physical performance. Am. J. Hum. Biol. 25:516–523, 2013. © 2013 Wiley Periodicals, Inc.
The influence of malnutrition on somatic growth in developing countries is well documented. In these countries, anthropometry is probably the most commonly used tool to assess nutritional status for both epidemiological and clinical practices (de Onis et al., 1993; Delpeuch et al., 2000; Gillett and Tobias, 2002; Prista et al., 2003; Sereebutra et al., 2006; Steyn et al., 2005). Despite general use, there are still controversies regarding the use of international cut-off scores for anthropometric measures and indices to classify nutritional status. The controversies revolve around the significance, applicability, and the biological meaning of cut-off values for a variety of populations living under different environmental conditions (Goldstein and Tanner, 1980; Prista, 1998; Van Loon et al., 1986). Nevertheless, anthropometric indicators are still considered the most practical and useful tools for nutritional assessment in public health, given that they provide additional information on essential aspects of human physical growth and development as well as survival in adverse environmental conditions (WHO, 1995).
Advantages and disadvantages of reduced body size in developing countries have been discussed as issues affecting health and productivity (Prista, 1998; Spurr, 1988). Smaller body size and lower muscle mass, associated with malnutrition, are considered limiting factors of human performance, since studies comparing adequately nourished and malnourished children have shown an advantage, in absolute terms, of bigger bodies. Once body size is taken into account, differences in performance are reduced or disappear (Bénéfice et al., 1996, 1999; Malina and Buschang, 1985; Spurr and Reina, 1989a,; Spurr et al., 1983).
Due to the implications for morbidity and mortality, nutritional studies in Africa have mainly focused on children under five and very few studies have focussed on school-aged children and adolescents. Despite the generalized use of international indices in public health, studies incorporating physical fitness and physical activity (PA) as indicators of active lifestyles and functional capacities, their biological relevance and implications for health in school-aged children and adolescents are very scarce. Prista et al. (2003) verified differences between Mozambican school-aged children classified as malnourished and adequately nourished, using physical fitness, PA, and different clinical parameters (such as systolic and diastolic blood pressure, total cholesterol, hemoglobin and calcium concentration, and parasites in urine, feces, or both) to test the relevance of the aforementioned criteria. They did not find any differences between the nutrition groups except for body size. Since a poor nutritional status is expected to reflect reduced functional capacity, reduced PA levels and poor clinical health, the validity of those nutritional cut-off scores was questioned. A limitation of that study was, however, that only children and adolescents living in urban conditions were studied. Consequently, there is a need to verify these observations in children and adolescents living in rural areas, especially when the differences in living conditions between urban and rural are considered, as well as the observation that more than 71% of the Mozambican population is living in rural areas (INE, ).
In sub-Saharan Africa, one of the basic public health problems is infectious disease and intestinal parasites (WHO, 2008). In fact, in tropical areas of high endemicity, malaria is a major cause of morbidity and mortality in childhood, making it a priority issue for health authorities, because of its complex inter-relationship with malnutrition and intestinal parasites, and negative effects on cognitive and physical-motor development of children (Carter and Mendis, 2002). Nevertheless, with regard to asymptomatic parasitemia, little information exists that would establish a special relationship with nutrition and motor performance, especially in African children living in rural settings. Moreover, currently available information is inconsistent, and the relationship between parasitemia, nutrition, and motor performance remains unclear (Filho et al., 2011; Manganelli et al., 2012; Staat et al., 2011).
The present study aims to (i) test the hypothesis that malnourished children and adolescents from rural African areas have lower levels of working capacity and PA levels compared to their peers with ‘normal’ nutritional status, (ii) verify the biological relevance of the anthropometric criteria used to classify nutritional status in school-aged children, and (iii) determine the prevalence of parasitological indicators, and its association with nutritional status and functional fitness.
METHODS
Study area
Subjects for this study are from Calanga, a rural area on the eastern coast of southern Mozambique. The region is not served by electricity, water, sanitation, and roads. There is no medical assistance and during the rainy season Calanga remains isolated. The population was estimated at 9,451 inhabitants of whom 3,361 are between 6 and 20 years of age (INE, 1997). The main occupation of the inhabitants of Calanga is subsistence-level farming and raising cattle. A smaller number of the inhabitants, mainly adults, work as seasonal sugar cane cutters as well as fishermen.
Specific data for prevalence of HIV and other infections are not available. However, as a rural area from Mozambique, HIV, malaria, and several parasites are known to be endemic in the area. Foods available to these children are mainly grains (maize/corn or rice), cassava, and legumes (peanuts or beans). The predominant vegetables are those commonly eaten with xima, the cooked corn meal dish that is a staple in the diet. These vegetables include onion and tomato and the leaves of several plants: cassava, sweet potato, pumpkin, cacana and tseque. The predominant local fruit is massala, but banana and oranges are also reported. Sugar cane was a common snack (Prista et al., 2010).
Data were collected in August 2005 during the dry season. A team of 30 test instructors participated in the data collection. Before the start of the HBV-project, all of the test instructors were trained and a test–retest reliability study was carried out and intraclass correlation coefficients ranged from 0.92 to 0.99 for all variables. In order to reduce inter-observer error each test or measurement was taken by the same test instructor during the whole course of the study. Tests and measurements in girls were administered by female test instructors and in boys by male test instructors.
Sample
This study utilized a cross-sectional design. The sample comprised 794 subjects (456 boys; 384 girls) aged 6–17 years attending the 1st (1st−5th grades) or 2nd (6th−7th grades) levels of the primary school. All subjects attended schools for primary education in Calanga and were randomly selected by computer from the participants in the ongoing Human Biologic Variability project from this region. The number of subjects selected for this sample represents 23.6% of the Calanga school population.
The study was approved by the National Committee for Health Bioethics. The purpose of the study was communicated in advance to local authorities, both official authorities and traditional leaders, to parents and to teachers at the schools. Trained observers and local teachers read and explained the informed consent forms in the local language for illiterate parents. Informed consent to permit the participation of their children and adolescents was documented by signature or fingerprint.
Before participation in the study all children and adolescents underwent a clinical evaluation. They had to be free from symptoms of disease such as fever that would affect their performance, and had to be able to understand and execute all the performance tests. In total, 18 subjects were excluded for health problems. Since the clinical evaluation by the team physician was done before the testing started, all subjects with health problems were immediately prescribed with free medication or were sent to the local health center. Moreover, given the low prevalence of overweight in the region, which is reflected in the small number of overweight children in the sample (n = 16; see Table 2), these children were also excluded from further data analysis.
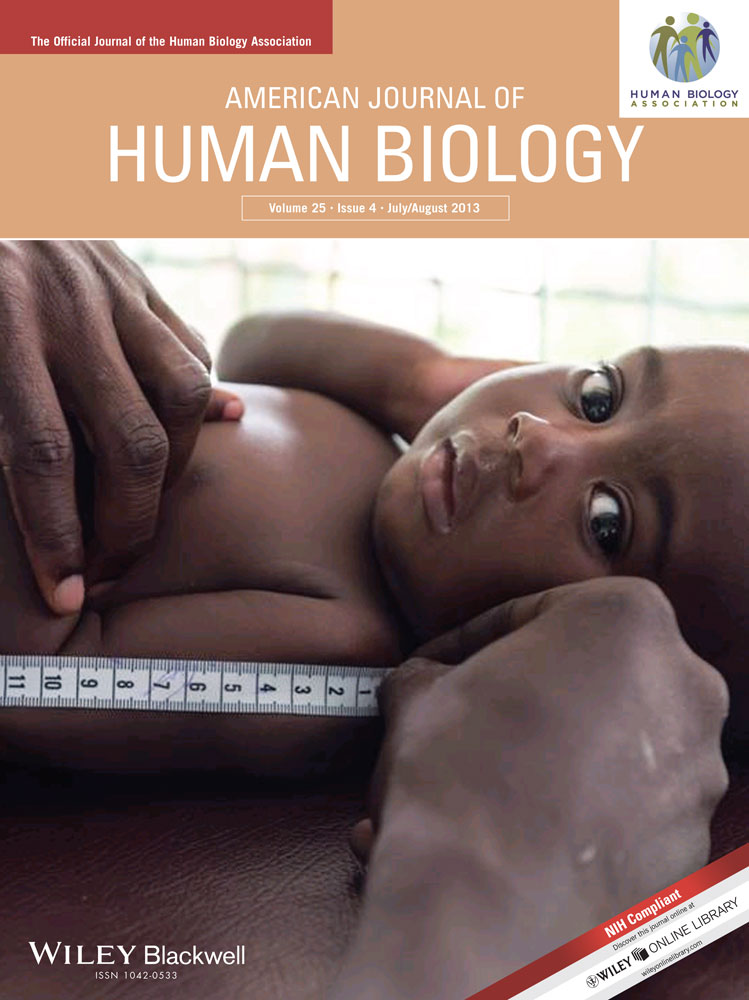
Anthropometric measurements
Height was measured with a Harpenden stadiometer (±0.1 mm; Holtain, Crymych, United Kingdom). Body mass was weighed with naked subjects on a Seca scale (M 01-22-07-245; Seca Germany). Values were recorded to the nearest 100 g.
Physical fitness
The physical fitness test battery included the following aptitudes: flexibility, lower limb explosive power, upper limb strength/endurance, trunk strength/endurance, static strength, speed, and cardiorespiratory fitness. Protocols were selected from standardized test batteries such as AAHPERD (1980): 1-mile run and handgrip; EUROFIT (1988): sit and reach, 10 × 5 meters run, standing broad jump and flexed arm hang and FITNESSGRAM (1994): curl-up. To avoid inter-observer errors, all the tests were supervised by the same test instructor.
Physical activity
PA was measured with an accelerometer, in a sub-sample of 250 individuals (117 female, 133 male). PA was assessed during waking hours with the Actigraph model 7164 (Fort Walton Beach, FL, USA, formerly CSA). The Actigraph is a uni-axial accelerometer designed to detect vertical acceleration ranging in magnitude from 0.05 to 2.00 Gs with frequency of 0.25–2.50 Hz. Each child wore the monitor during the waking hours of at least one day, and only waking hours of one day were analyzed. No concern with type of day (weekend vs. weekday) was taken, because in Mozambican rural areas there are no marked routines associated with type of days during the week (Prista et al., 2009). Monitors were attached to an elastic belt worn firmly over the waist. Subjects were instructed not to remove the device, except for bathing, swimming or sleeping.
Stool samples
Participants were instructed to collect an early morning stool specimen. This was collected into a sterile, wide mouth, leak-proof container with a tight fitting lid containing a preservative solution. Stools were kept at room temperature until delivery at the school within six hours of collection. Small amounts of stool specimens were placed on microscope slides and mixed with 0.9% NaCl solution to prepare wet mount smears. Slides were then examined under a light microscope for qualitative screening of parasite cysts, larvae, or ova.
Blood smear microscopy
Upon delivery of samples at the laboratory, a thick blood smear was mounted from anti-coagulated whole blood. All blood smears were stained using the Giemsa protocol and screened for Plasmodium falciparum, P. malaria, P. ovale, and P. vivax using light microscopy. Parasite density was estimated by means of a semiquantitative scale (Payne, 1988).
Nutritional status
Classification of nutritional status was made according to public health criteria recommended by the World Health Organization expert committee (WHO, 1995). For analytic purposes, the subjects were divided into five groups: (1) normal (height for age ≥ -2 SD and BMI for age >P5), (2) low height-for-age (stunted - height for age < -2 SD), (3) low weight-for-height (wasted - BMI for age < P5), (4) low height-for-age and low weight-for-height (stunted and wasted - height for age < -2 SD and BMI for age < P5) and (5) overweight (BMI for age > P85). Percentiles for BMI measurements were based on the National Health and Nutrition Survey (NHANES I) in the United States. Percentiles for height-by-age were based on growth charts from Centers for Disease Control and Prevention and the World Health Organization and computed by EPI Info 2000, version 3.3.2. (Dibley et al., 1987; WHO Working Group, 1986).
Statistical analysis
Before starting the data analysis, quality checks were carried out to identify outliers, and to verify normality of the distributions (using Kolmogorof-Smirnof tests) for the traits considered herein. Analysis of covariance (ANCOVA) was used to test for differences among groups with age and age-squared as covariates and nutritional group as the main factor. Post hoc examinations were made by using a Bonferroni correction. All of the analyses were sex-specific. To verify the effect of body size on physical fitness comparisons between nutritional groups, a second ANCOVA was run adding height and body mass index (BMI) as covariates. All statistical analysis were done in SPSS 14.0 (SPSS Inc, Chicago), and the significance level was set at P < 0.05.
RESULTS
Anthropometrics and nutritional classification
Descriptive statistics for height, weight, and BMI are provided in Table 1. As expected, the mean height, weight and BMI increased significantly with age. Girls have a mean height and weight significantly higher at 13–14 years, and boys have higher mean height at age 17. The mean values of BMI did not differ significantly between the sexes across age.
| Boys (B) | Girls (G) | |||||
|---|---|---|---|---|---|---|
| Age (y) | Height (cm) | Weight (kg) | BMI (kg/m2) | Height (cm) | Weight (kg) | BMI (kg/m2) |
| 6 (n = 30 B, 24 G) | 110.6 ± 5.3 | 18.6 ± 2.0 | 15.3 ± 1.2 | 111.0 ± 7.1 | 18.3 ± 3.1 | 14.8 ± 0.9 |
| 7 (n = 29 B, 25 G) | 116.9 ± 9.1 | 20.5 ± 2.1 | 15.1 ± 1.7 | 114.6 ± 7.0 | 20.5 ± 2.7 | 15.6 ± 1.5 |
| 8 (n = 54 B, 50 G) | 120.4 ± 6.7 | 21.8 ± 2.5 | 15.1 ± 1.6 | 120.4 ± 7.9 | 21.4 ± 2.7 | 14.8 ± 1.3 |
| 9 (n = 38 B, 30 G) | 125.2 ± 7.1 | 24.1 ± 3.0 | 15.4 ± 1.5 | 125.4 ± 8.6 | 24.0 ± 3.1 | 15.4 ± 2.1 |
| 10 (n = 41 B, 35 G) | 128.1 ± 5.5 | 25.6 ± 3.2 | 15.6 ± 1.5 | 128.6 ± 6.5 | 25.9 ± 3.5 | 15.6 ± 1.2 |
| 11 (n = 32 B, 43 G) | 134.3 ± 10.3 | 27.7 ± 3.7 | 15.4 ± 1.7 | 134.4 ± 8.2 | 28.9 ± 5.2 | 15.8 ± 1.5 |
| 12 (n = 35 B, 31 G) | 137.7 ± 7.5 | 30.6 ± 4.9 | 16.1 ± 1.7 | 139.2 ± 7.0 | 32.8 ± 4.3 | 16.8 ± 1.2 |
| 13 (n = 50 B, 42 G) | 143.3 ± 8.0 | 35.9 ± 8.5 | 17.6 ± 5.1 | 147.4 ± 6.5 | 38.9 ± 7.6 | 17.8 ± 2.4 |
| 14 (n = 45 B, 46 G) | 146.8 ± 10.1 | 37.6 ± 5.4 | 17.6 ± 2.4 | 151.2 ± 6.0 | 40.3 ± 5.4 | 17.7 ± 1.5 |
| 15 (n = 36 B, 28 G) | 153.6 ± 6.6 | 41.6 ± 6.7 | 17.6 ± 2.0 | 150.9 ± 12.4 | 42.0 ± 8.1 | 18.3 ± 2.6 |
| 16 (n = 27 B, 11 G) | 156.6 ± 11.3 | 46.3 ± 6.6 | 18.6 ± 2.7 | 157.2 ± 5.7 | 48.6 ± 7.6 | 19.9 ± 3.4 |
| 17 (n = 29 B, 9 G) | 166.0 ± 7.7 | 51.8 ± 7.0 | 18.7 ± 2.0 | 154.9 ± 14.9 | 48.2 ± 7.4 | 19.1 ± 3.2 |
| Boys (n = 429) | Girls (n = 365) | |||||||||||
|---|---|---|---|---|---|---|---|---|---|---|---|---|
| Height-for-age | Normal | Stunted | Wasted | Stunted and wasted | Overweight | Height-for-age | Normal | Stunted | Wasted | Stunted and wasted | Overweight | |
| Age (y) | z-score | (n = 242) | (n = 102) | (n = 48) | (n = 30) | (n = 7) | z-score | (n = 241) | (n = 75) | (n = 25) | (n = 15) | (n = 9) |
| 6 | −0.78 ± 1.23 | 72.4% | 13.8% | 13.8% | 0.0% | 0.0% | −0.39 ± 1.32 | 75.0% | 8.3% | 16.7% | 0.0% | 0.0% |
| 7 | −0.93 ± 1.79 | 70.4% | 25.9% | 3.7% | 0.0% | 0.0% | −1.10 ± 1.27 | 65.2% | 26.1% | 8.7% | 0.0% | 8.0% |
| 8 | −1.23 ± 1.26 | 64.0% | 20.0% | 12.0% | 4.0% | 3.8% | −1.00 ± 1.32 | 70.8% | 18.8% | 8.3% | 2.1% | 2.0% |
| 9 | −1.24 ± 1.26 | 70.3% | 18.9% | 8.1% | 2.7% | 0.0% | −1.06 ± 1.32 | 78.6% | 14.3% | 7.1% | 0.0% | 3.4% |
| 10 | −1.54 ± 0.90 | 60.0% | 22.5% | 15.0% | 2.5% | 2.4% | −1.43 ±0.95 | 61.8% | 26.5% | 5.9% | 5.9% | 0.0% |
| 11 | −1.35 ± 1.53 | 59.4% | 18.8% | 12.5% | 9.4% | 0.0% | −1.49 ± 1.18 | 55.8% | 30.2% | 7.0% | 7.0% | 0.0% |
| 12 | −1.59 ± 1.01 | 50.0% | 26.5% | 17.6% | 5.9% | 2.9% | −1.81 ± 1.03 | 71.0% | 25.8% | 0.0% | 3.2% | 0.0% |
| 13 | −1.59 ± 0.96 | 61.2% | 24.5% | 8.2% | 6.1% | 2.0% | −1.46 ± 0.98 | 60.5% | 28.9% | 2.6% | 7.9% | 7.3% |
| 14 | −1.90 ± 1.18 | 41.9% | 37.2% | 11.6% | 9.3% | 4.4% | −1.38 ± 0.90 | 68.2% | 20.5% | 6.8% | 4.5% | 0.0% |
| 15 | −1.92 ± 0.82 | 47.2% | 27.8% | 8.3% | 16.7% | 0.0% | −1.61 ± 1.84 | 69.2% | 11.5% | 7.7% | 11.5% | 3.7% |
| 16 | −2.10 ± 0.87 | 29.6% | 40.7% | 11.1% | 18.5% | 0.0% | −0.78 ± 0.85 | 80.0% | 10.0% | 10.0% | 0.0% | 9.1% |
| 17 | −1.65 ± 1.18 | 61.1% | 5.6% | 16.7% | 16.7% | 0.0% | −1.67 ± 2.50 | 85.7% | 0.0% | 14.3% | 0.0% | 0.0% |
| Total | −1.51 ± 1.27 | 57.3% | 24.2% | 11.4% | 7.1% | 1.6% | −1.29 ± 1.27 | 67.7% | 21.1% | 7.0% | 4.2% | 2.5% |
Results for nutritional status by age and sex are given in Table 2. Average Z-score for height-for-age are z = −1.51 for boys and z = −1.29 for girls. With the exception for girls at 6 years, negative z-scores for height for age were observed in all age groups. Values decreased across age for boys, whereas the values for girls increased after 12 years of age. Prevalence of stunting equalled 24.2% for boys and 21.1% for girls. Trends across age are similar to that observed for mean z-scores.
Total prevalence of wasting was 15.3%. Boys showed a significantly higher prevalence of wasting than girls (Boys = 18.7%; Girls = 11.2%; chi-square; P < 0.01). Table 2 provides the prevalence of wasting per age group taking into account that some wasted subjects were included in the stunted and wasted group. Prevalence of boys and girls that were simultaneously stunted and wasting were 7.1% and 4.2%, respectively. Only seven boys and nine girls were classified as overweight. Therefore the overweight children were not included in further analyses.
Physical fitness
Comparisons of performance in physical fitness tests between nutritional groups controlled for age are shown in Table 3. In general, mean values indicated better performance of the normal weight group relative to the other groups. Differences are significant for sit and reach, standing long jump, handgrip, and 1 mile run for both sexes. In addition, curl up performance and 10 × 5 meters run was also different for girls. No difference appears between the nutritional groups for flexed arm hang. Post-hoc comparison revealed that the average differences are mainly due to the differences between normal and stunted-wasted groups. Compared to the normal group, the stunted group performed less well in standing long jump, handgrip and 1 mile run in both sexes, and curl-up, 10 × 5 meters run for girls. Compared to the normal group, the wasted group performed significantly less well for handgrip in boys and for standing long jump, 10 × 5 meters and 1 mile run in girls.
| Nutritional status | ||||||
|---|---|---|---|---|---|---|
| Normal (N), (n = 244 B, 247 G) | Stunted (S), (n = 109 B, 78 G) | Wasted (W), (n = 47 B, 25 G) | Stunted and wasted (S-W), (n = 29 B, 15 G) | P-value | Contrast | |
| Boys | ||||||
| Sit and reach (cm) | 35.8 ± 0.39 | 34.5 ± 0.60 | 33.7 ± 0.90 | 31.8 ± 1.22 | 0.002 | N = S = W > S-W |
| S. L. Jump (cm) | 146.0 ± 1.47 | 137.3 ± 2.22 | 140.2 ± 3.30 | 128.4 ± 4.31 | <0.001 | N > S = W > S-W |
| Flexed A. Hang (s) | 11.6 ± 0.66 | 10.5 ± 1.07 | 13.5 ± 1.56 | 13.6 ± 2.13 | 0.516 | — |
| Curlup (nr of reps) | 8.0 ± 0.54 | 7.1 ± 0.84 | 6.5 ± 1.25 | 5.3 ± 1.56 | 0.346 | — |
| Handgrip (kg/F) | 20.5 ± 0.34 | 16.7 ± 0.51 | 18.3 ± 0.76 | 15.2 ± 0.98 | <0.001 | N > S = W > S-W |
| 10 × 5 m run (s) | 23.8 ± 0.21 | 24.3 ± 0.32 | 23.7 ± 0.45 | 24.7 ± 0.62 | 0.293 | — |
| 1-Mile (sec) | 484.5 ± 4.63 | 500.9 ± 7.39 | 510.2 ± 10.19 | 535.7 ± 14.61 | 0.003 | N > S > W > S-W |
| Girls | ||||||
| Sit and reach (cm) | 38.4 ± 0.36 | 36.8 ± 0.67 | 36.5 ± 1.14 | 30.8 ± 1.47 | <0.001 | N = S = W > S-W |
| S. L. Jump (cm) | 137.8 ± 1.68 | 126.4 ± 3.18 | 109.6 ± 5.7 | 118.0 ± 7.54 | <0.001 | N = S = W > S-W |
| Flexed A. Hang (s) | 8.6 ± 0.57 | 9.7 ± 1.11 | 10.4 ± 1.96 | 9.6 ± 2.76 | 0.591 | — |
| Curlup (nr of reps) | 6.0 ± 0.50 | 3.0 ± 0.94 | 7.7 ± 1.47 | 3.6 ± 1.94 | 0.004 | N > S = W > S-W |
| Handgrip (kg/F) | 17.2 ±0.32 | 13.3 ± 0.59 | 15.10 ± 0.98 | 10.9 ± 1.25 | <0.001 | N > S = W > S-W |
| 10 × 5 m run (s) | 24.6 ± 0.2 | 25.4 ± 0.38 | 25.9 ± 0.57 | 25.7 ± 0.82 | 0.018 | N > S > W > S-W |
| 1-Mile (sec) | 542.9 ± 6.89 | 580.7 ± 13.26 | 604.0 ± 23.70 | 577.7 ± 28.49 | 0.010 | N > S > W > S-W |
- a ANCOVA.
Physical activity
Results of accelerometry are documented in Table 4. The ANCOVA results indicate that the average activity counts were not statistically different across the nutritional groups, so pairwise tests were not conducted.
| Nutritional status | |||||
|---|---|---|---|---|---|
| Normal (N), (n = 139) | Stunted (S), (n = 58) | Wasted (W), (n = 32) | Stunted and wasted (S-W), (n = 15) | P-value | |
| Counts | 629.48 ± 19.89 | 599.23 ± 30.40 | 525.81 ± 38.74 | 609.77 ± 74.70 | 0.150 |
- a Boys and girls together since no differences between genders were found.
- b ANCOVA.
Malaria and intestinal parasites
Frequency of asexual forms of P. falciparum in blood smears ranged from 53.1% in the normal group to 72.7% in the stunted and wasted group (Table 5). No statistically significant differences were observed among the nutritional groups (P = 0.354). Prevalence of other forms, such as P. malaria, P. ovale, and P. vivax, were non-existent or very low. Consequently, no further statistical comparison among nutritional groups were performed.
| Parasites | Normal | Stunted | Wasted | Stunted and wasted | P-value |
|---|---|---|---|---|---|
| Plasmodium falciparum | 119/224 (53.1%) | 41/72 (56.9%) | 18/27 (66.7%) | 8/11 (72.7%) | 0.354 |
| Ascaris lumbricoides eggs | 68/188 (36.2%) | 17/59 (28.8%) | 15/28 (53.6%) | 5/13 (38.5%) | 0.168 |
| Ancylostoma duodenalis eggs | 39/188 (20.7%) | 14/59 (23.7%) | 7/28 (25.0%) | 4/13 (30.8%) | 0.804 |
- a Boys and girls together since no differences between gender prevalence were found.
- P-value resulted from a Chi-square test for differences of proportions between groups.
Eggs of A. lumbricoides and A. duodenalis were present in stools of individuals from all groups (Table 5). However, A. lumbricoides was more frequently encountered than A. duodenalis. Frequency of A. lumbricoides eggs ranged from 28.8% in the stunted group to 53.6% in the wasted group whereas the frequency of A. duodenalis ranged from 20.7% in the normal group to 30.8% in the stunted and wasted group. There were no significant differences in the prevalence of these two intestinal parasites among the four nutritional groups.
DISCUSSION
Chronic and acute malnutrition are major health concerns in developing countries. Despite a decreased prevalence of malnutrition observed in several regions of the developing world, Africa is still a continent with a high incidence of nutritional deficiencies, where even some increase in stunting rates have been observed (de Onis et al., 2000, 2004; Milman et al., 2005). The observed stunted and wasted rates in this rural school-aged population from Mozambique were comparable with those observed in other African countries. The rates for stunted and wasted are respectively 30% and 13% in Tanzania (Sellen, 2000), 16.7% and 3.7% in Kenya (Mukudi, 2003). In rural South-Africa stunting rates of 26.7% for boys and 23.7% for girls have been reported (Mukuddem-Petersen and Kruger, 2004).
Previous studies carried out in Mozambican youths considered selected urban and suburban populations (Prista, 1998, Prista et al., 2003). Over a period of 7 years, the prevalence in stunting dropped from 34.5% to 3% and from 24.6% to 2.3% for boys and girls, respectively. In turn, wasted status decreased from 34.9% to 25.0% for boys and 18.6% to 10.8% for girls (Prista, 1998; Prista et al., 2003). This was attributed to dramatic socio-economic changes resulting from the transition in Mozambique from war to peace (Saranga et al., 2002). No data on rural school-aged populations in Mozambique were found to permit further comparisons. However, the differences between rural and urban areas in Mozambique are similar to those described in other studies in Africa (Fotso, 2006, 2007; Glew et al., 2003; Oninla et al., 2007). Since the ethnic origin of the aforementioned studies in Maputo and the present rural sample in Calanga were similar, the interpretation that environmental stress caused the observed impaired growth of the school-aged population in Calanga may be justified.
Very few subjects in the present study were overweight and none were classified as obese. Despite the fact that obesity is a growing phenomenon worldwide (Kosti and Panagiotakos, 2006; Lasserre et al., 2007; Lobstein et al., 2004), even in countries in transition (Jain, 2004; Popkin, 2004; Popkin and Gordon-Larsen, 2004), it appears that this is still not the case in rural areas of Mozambique. The same aforementioned study done in urban Mozambican school-aged children demonstrated an increased overweight prevalence from 0% to 4.8% and 4.9% to 8.2% in boys and girls, respectively (Saranga et al., 2002). An examination of the foods available to a subsample of the present study suggests that the majority of the children have access to a very low quality diet which may be expected to contribute to the stunting and the wasting documented in this study (Prista et al., 2010).
As expected, and in concordance with the stunting prevalence, z-scores for anthropometric data are negative, which is common in Africa (Coly et al., 2006; Jinabhai et al., 2005; Mukuddem-Petersen and Kruger, 2004; Mukudi, 2003; Sellen, 2000). Patterns of z-scores with age were different between sexes. Z-scores for boys decline from younger to older, while for girls, they stop declining from 12 to 13 years of age. This suggests that diminished nutrient status was more pronounced in boys, particularly in the older boys, or that boys are more susceptible to the nutritional deficiencies. The trend for boys to be more prone to suffer from nutritional deficiency has been described previously (Gillett-Netting and Perry, 2005; Svedberg, 1990). However, it should be noted that the majority of the studies were done with children under five years of age. Several explanations for the larger impact of nutritional deficiencies in boys compared to girls have been formulated. First, a biological hypothesis suggests the possibility of a relatively lower immunity associated with late maturity in boys. Although some inconsistency exists across type of infection and age, males tend to have a greater infectious disease load than females (Green, 1992). By turn, boys' late maturity status when compared to girls, as observed in previous Mozambican studies (Prista et al., 2005), may eventually be explained by a lower nutritional condition. Second, behavior and or cultural factors may explain the sex-differences in nutritional status. A different trend is observed in Africa relative to Asia and Latin America, where males have a better profile than females (Darnton-Hill, 2005; Fikree and Pasha, 2004; Smith, 2003). The better nutritional status of females in Africa may be associated with the important economic role played by the African female in the economic productive system (Svedberg, 1990). This may be one important direction for future research in this population, particularly because it is recognized that women play an important social, moral and productive role in Calanga. However, this study did not address these issues. Third, methodological issues may be an explanatory factor. There is a consistent observation that a possible bias is introduced when boys and girls are classified using reference data from a different population and relates also the possibility of differences in the reporting of chronological age (Svedberg, 1990, Wamani et al., 2005). These two factors, combined or not, may cause an underestimation of males' age-related height and weight centile positions. Within this context, the exact date of birth is hard to ascertain in the Calanga population.
Once the classification of nutritional status was established using international reference data, and assuming that these criteria and cut-off scores are valid for children in Calanga, it was hypothesized that nutritional status had an influence on the clinical, physiological and functional parameters measured in this study. However, in the present study, PA was not different among groups with different nutritional status. This observation confirms what was previously shown in different samples from Mozambique (Prista, 1998; Prista et al., 2003), Colombia (Spurr and Reina, 1988a), and Senegal (Benefice, 1992). It has been observed that some subjects classified as malnourished do not reduce their levels of activity relative to their well-off peers and a probable explanation already has been proposed: environmental stress in the poor areas impose PA demands for everyone in order to survive (Prista, 1998; Satayanarayana et al., 1979; Spurr and Reina, 1988b). Another explanation may be the lack of sensitivity of the cut-off scores used to define nutritional status. As described, Mozambican urban children and adolescents with different nutritional status did not show any difference in PA levels, questioning the validity of the cut-off scores used to classify nutritional groups (Prista, 1998; Prista et al., 2003). Moreover, limitations of the instruments used to quantify PA may also impair the results.
Physical fitness tests were used in this study to quantify the functional. It is also expected that fitness levels will differ between subjects having malnourished or normal nutritional status. Several studies failed to demonstrate that nutritional status does discriminate for physical performance, except for the tasks where body size is a determinant in school-aged children (Bénéfice, 1998; Benefice et al., 1999; Prista, 1998; Prista et al., 1997, 2003; Spurr et al., 1984).
The interpretation of fitness results in poor nutritional environments using body size adjustments is still controversial (Martorell et al., 1988; Nkiama, 1993; Spurr, 1988). Some argue that the adjustments for size and the disappearance of the differences in fitness do not imply that these children are healthy since their growth is impaired. From this perspective, children performed well for their impaired growth status, which does not mean that their growth status was not affecting their health in some way. In the previous studies done in Mozambican urban areas only absolute performance was affected. This was already seen as a negative effect from the productivity perspective (Prista et al., 1997, 2003). In the present study both absolute and relative performances seem to be affected. This probably suggests a different quantitative expression, i.e., a higher distance between attained height and reference height in Mozambican rural than urban areas. This can be confirmed by analyzing the published data from those two populations.
An analysis of parasites was included in the study. The relationship between parasitic diseases and malnutrition remains controversial, with some studies reporting that this relationship exists, while others show that this relationship does not exist or is not significant (Abidoye and Akande, 2000; Deen et al., 2002; Filho et al., 2011; Friedman et al., 2005; Genton et al., 1998; Lai et al., 1995; Manganelli et al., 2012; Nyakeriga et al., 2004; Staat et al., 2011). For example, Manganelli et al (2012) reported a positive relationship between parasite infection with nutritional status in children aged 0 to 15 years; similar results were found by Araújo Filho et al (2011), but only in children from low income; however, similar to our results, Staat et al. (2011) did not find a significant association between malnutrition and intestinal parasites. In the present population, and as it has been documented in other African countries, prevalence of asexual forms of P. falciparum in blood and of intestinal parasites in stools was high in all nutritional groups. Interestingly, there was a trend for a lower prevalence of all parasites among individuals in the normal group. However, this difference did not reach statistical significance and no relationship between the prevalence of parasites and nutritional status was observed. Two explanations are offered: (1) the lower prevalence in the normal group could not be demonstrated as a result of the low number of children in some of the nutritional groups, and (2) the repeated exposure to parasites in an endemic area results in high prevalence, independently of nutritional status. Nevertheless, the present data suggest that, in a tropical rural setting endemic for parasitic diseases, the presence of parasites is not directly related to nutritional status.
This study has used reference values to classify nutritional groups instead of standards which may be more appropriate as proposed by de Onis et al. (2007). The World Health Organization published Child Growth Standards (WHO Multicentre Growth Reference Study Group, 2006) that were based on longitudinal data from children from several countries living in healthy environmental conditions. However, these standards are for children under five years. Standards for school-aged children and adolescents, based on longitudinal data of children and adolescents living in healthy environmental conditions, are not yet available. With this limitation in mind, and taking into account that recent literature has used the same reference values used in this paper to classify nutritional groups, reference data has to be used in these types of studies.
In conclusion, the findings of the present study give additional support to the controversy about the validity of the cut-off points used to define nutritional status in school-aged children and adolescents. In the present study, and different from what was previously observed in Mozambican urban school-aged population, the functional capacity of those classified as malnourished seem to be affected. However, PA and clinical parameters such as infection with parasites were not different from their normal peers. It is an unfortunate situation that impairs not only their metabolic, morphological and “physiological” fitness but also their general health.
ACKNOWLEDGMENTS
The cooperation of community, school authorities, parents and children in the Calanga locality is greatly appreciated. The authors thank the efforts of the entire field-work team and all the senior investigators of the Human Biological Variability in Mozambique project in facilitating the completion of this work.